. 2022 Nov 9:13:968317.
doi: 10.3389/fimmu.2022.968317. eCollection 2022.

Development and evaluation of low-volume tests to detect and characterize antibodies to SARS-CoV-2

Affiliations

Development and evaluation of low-volume tests to detect and characterize antibodies to SARS-CoV-2

Alice Halliday et al. Front Immunol. .

Abstract

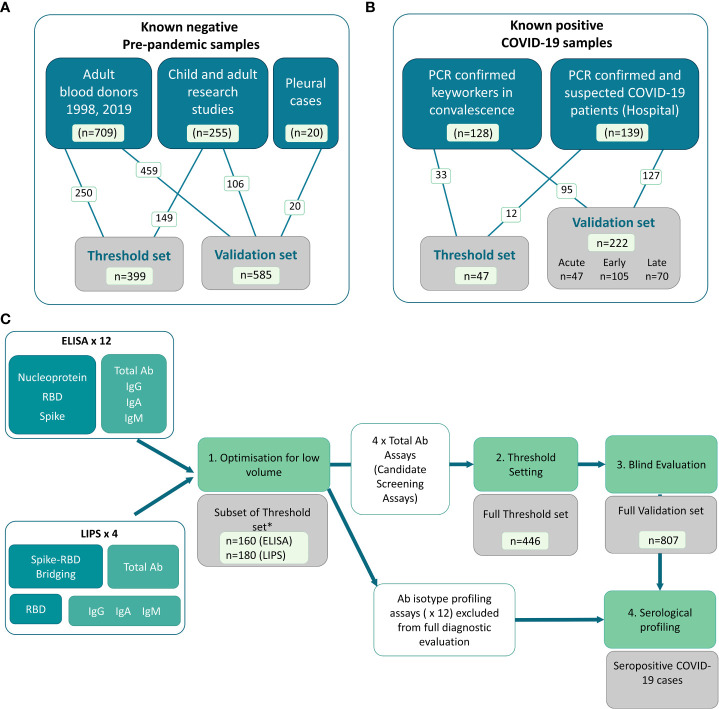
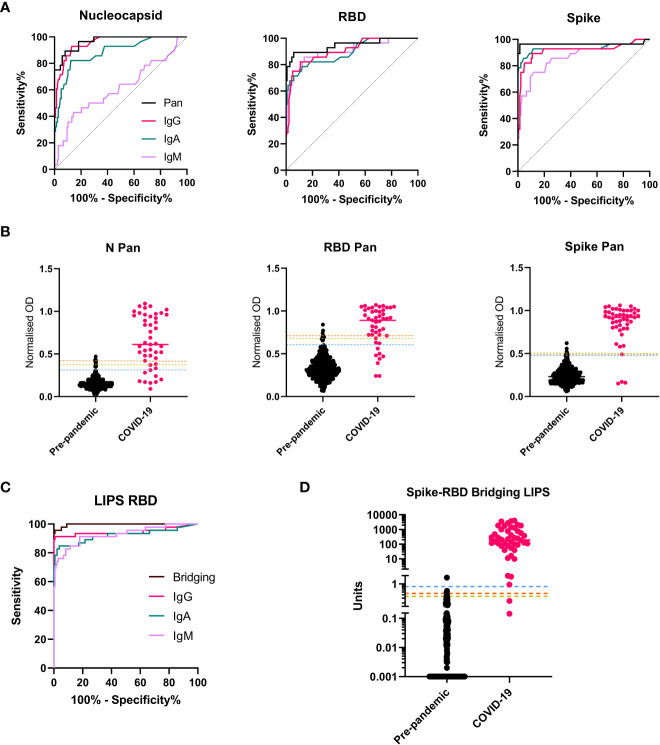
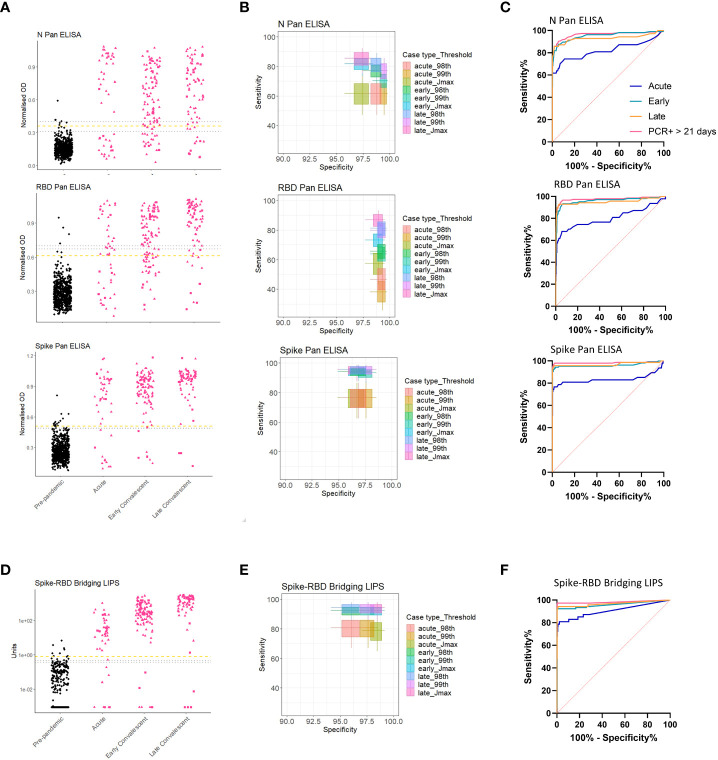
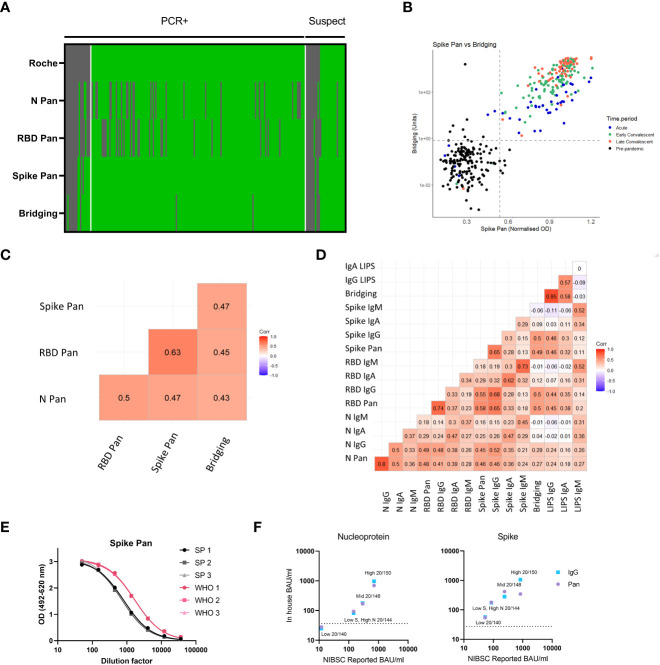
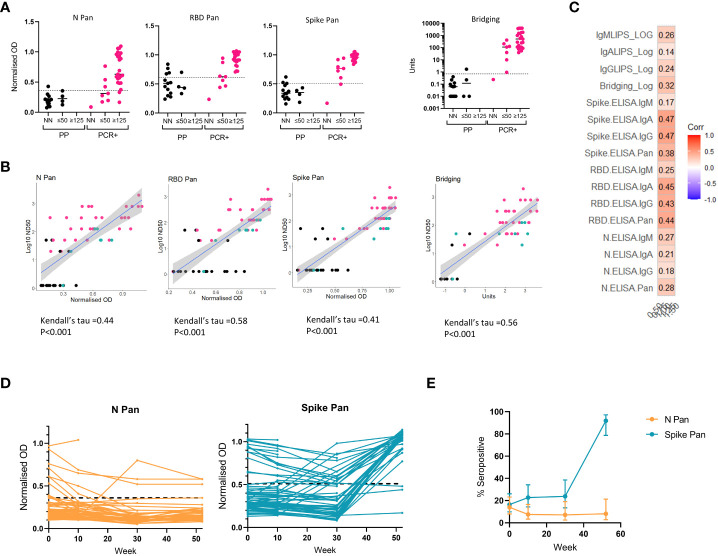
Low-volume antibody assays can be used to track SARS-CoV-2 infection rates in settings where active testing for virus is limited and remote sampling is optimal. We developed 12 ELISAs detecting total or antibody isotypes to SARS-CoV-2 nucleocapsid, spike protein or its receptor binding domain (RBD), 3 anti-RBD isotype specific luciferase immunoprecipitation system (LIPS) assays and a novel Spike-RBD bridging LIPS total-antibody assay. We utilized pre-pandemic (n=984) and confirmed/suspected recent COVID-19 sera taken pre-vaccination rollout in 2020 (n=269). Assays measuring total antibody discriminated best between pre-pandemic and COVID-19 sera and were selected for diagnostic evaluation. In the blind evaluation, two of these assays (Spike Pan ELISA and Spike-RBD Bridging LIPS assay) demonstrated >97% specificity and >92% sensitivity for samples from COVID-19 patients taken >21 days post symptom onset or PCR test. These assays offered better sensitivity for the detection of COVID-19 cases than a commercial assay which requires 100-fold larger serum volumes. This study demonstrates that low-volume in-house antibody assays can provide good diagnostic performance, and highlights the importance of using well-characterized samples and controls for all stages of assay development and evaluation. These cost-effective assays may be particularly useful for seroprevalence studies in low and middle-income countries.

Keywords: COVID-19; ELISA; SARS-CoV-2; antibody; diagnostic; evaluation; immunity; luciferase immunoprecipitation system (LIPS).


Conflict of interest statement

AF is a member of the Joint Committee on Vaccination and Immunisation, the UK National Immunisation Technical Advisory Group and is chair of the WHO European Regional Technical Advisory Group of Experts (ETAGE) on immunization and ex officio a member of the WHO SAGE working group on COVID vaccines. He is investigator COVID-19 vaccine on studies and trials funded by Pfizer, Sanofi, Valneva, the Gates Foundation and the UK government. This manuscript presents independent research funded in part by the National Institute for Health Research (NIHR). The views expressed are those of the authors and not necessarily those of the NHS, the NIHR, or the Department of Health and Social Care. The remaining authors declare that the research was conducted in the absence of any commercial or financial relationships that could be construed as a potential conflict of interest.

Figures

Figure 1
Figure 1
Distribution of samples into sets, and flow diagram of assay development and evaluation. In-house COVID-19 antibody assays using pooled controls and a set of well characterized samples to first optimize and then set thresholds for positive and negative. (A) Known negative samples were all collected pre-pandemic (i.e. pre-December 2019) from various Biobanks and included adult and child plasma and serum samples from research studies, adult blood donors and a small collection of samples from hospitalized cases of pleurisy. (B) Known positive samples were collected from a full spectrum of COVID-19 adult cases, including RT-PCR confirmed COVID-19 cases recruited in convalescence from the community and PCR confirmed and clinically suspected COVID-19 cases recruited in hospitals. (C) Flow diagram showing use of sample sets in assay development, selection of screening assays and diagnostic evaluation. A total of 16 assays including isotype-specific and total antibody assays on both ELISA and LIPS platforms were optimized using a subset of the threshold set of these samples (n = 160 or n = 180depending on assay platform) for initial selection of candidate screening assays (Stage 1). * Note that whilst the number of threshold set samples used for optimization was comparable for ELISA and LIPS assays, the exact samples used differed slightly due to low samples volume for use across 16 assays. The assays which performed best for each antigen/platform combination were then taken forward for the full threshold setting to determine optimal thresholds for specificity (stage 2) including the remaining n = ~300 samples for all 4 screening assays (i.e. total of n = 446). Candidate screening assays with pre-defined thresholds were then deployed on a blind validation cohort containing n = 222 samples from COVID-19 cases and n = 585 pre-pandemic samples. The performance characteristics were defined using the validation set to guide utility of deployment. The 12 x non-screening assays were subsequently used only for profiling of seropositive samples (stage 4) and comparing to functional assays.
Figure 2
Figure 2
Selection of screening assays and threshold setting with the threshold set. A subset of the threshold set samples were used for assay optimization and then to compare performance of isotype/total antibody specific assays for each antigen/platform combination. (A) ROC curves showing the relative performance of ELISAs using different secondary antibodies (Pan total antibody (Black); IgG (pink); IgA (green), IgM (purple) in a cohort of n = 27 COVID-19 samples and n = 133 pre-pandemic samples from the threshold set. For all three antigens, the Pan/total antibody assays provided the best performance as evidenced by highest AUCs. (B) Scatterplots showing the individual normalized OD readings for all three ELISA screening assays (N Pan, RBD Pan and Spike Pan) in the full threshold set of n = 45 COVID-19 samples and n = 399 pre-pandemic), with the median represented by a line for each group and the three thresholds for each assay indicated with a line across the plot: 1 – the 99th percentile of pre-pandemic levels (orange dashed line); 2 - The 98th percentile (yellow dashed line); 3 – Youden’s index (blue dashed line). (C) ROC curves for all LIPS assays deployed on a subset of the threshold set (n = 46 COVID-19 cases and n = 134 pre-pandemic) showing optimal performance with the Spike-RBD Bridging LIPS assay, which was therefore taking forward for full threshold setting on the full threshold set (n = 446) with results shown in the scatterplot in (D). (Interpolated unit values shown on y axis with log10 scale and broken axis to allow visualization of thresholds. To ensure all results were plotted, a result of zero units was assigned a value of 0.001 for this graph. The three thresholds are indicated: 1 – the 99th percentile of pre-pandemic levels (orange dashed line); 2 - The 98th percentile (yellow dashed line); 3 – Youden’s index (blue dashed line).
Figure 3
Figure 3
Performance of screening assays in validation cohort. Dot plots showing assay results for the 3 screening ELISAs [N, RBD and Spike Pan] (A), and the Spike-RBD Bridging LIPS (D); black dots represent pre-pandemic samples and pink dots represent COVID-19 samples separated by different periods post infection: Acute; Early Convalescent; Late Convalescent. One misrepresentative highly positive pre-pandemic result has been removed from (D) as analysis after unblinding indicated it was the result of human error after unmatching (it still is included in the ROC/sensitivity analyses). (B, E) Boxplots indicating sensitivity and specificities for COVID-19 performed by each assay at each of the pre-defined thresholds. (C, F) ROC curves indicating performance of each assay for differentiating acute (< 21 days p.s.o.; blue), early convalescent (21 days – 12 weeks p.s.o; turquoise) or late convalescent (> 12 weeks p.s.o.; orange) COVID-19 cases from pre-pandemic samples in the blind validation cohort. The performance for detection of the most likely to be ‘true seropositive’ COVID-19 cases is also included, i.e. those who were sampled after 21 days after a confirmed PCR test (pink).
Figure 4
Figure 4
Comparing sensitivity of screening assays to a commercial assay (Roche Elecsys nucleocapsid) and correlation/concordance of all antibody assay results in samples within the validation set. (A) Heatmap comparing results of the 4 screening assays to the commercially available Roche Elecsys nucleocapsid assay in a cohort n = 218 individuals with RT-PCR confirmed or suspected COVID-19 (from the validation set). Samples are arranged in columns, split first by COVID-19 status followed by Roche Elecsys result. The results of each test assay is indicated in the different rows going downwards. Green indicates above positive threshold, grey negative. (B) Scatterplot showing the quantitative readouts from the top performing screening assays – Spike Pan ELISA and Spike-RBD Bridging LIPS assay with their best performing threshold indicated with dashed lines. The colours of point indicate the clinical group as shown in the key. (C) Correlogram reporting correlation coefficients using Kendall’s tau of all 4 screening assays in full validation set including pre-pandemic samples (n = 806). (D) Correlogram showing the relationship between results of all 16 antibody assays in samples from COVID-19 cases (n = 222). (E) Comparison of the standard curves generated using either our in-house pooled serum standard, or the WHO/NIBSC international standard, by running these side by side on 3 plates of the N Pan and Spike Pan ELISAs. The curves were found to be parallel. From these plots a ratio could be calculated to allow for conversion to BAU/ml from in house standard. (F) BAU/ml values for 4 samples provided in the WHO/NIBSC reference panel, as calculated by a collaborative inter-lab comparison (X axis) compared to calculating using the in-house standard, on the N Pan/IgG and Spike Pan/IgG ELISAs.
Figure 5
Figure 5
Relationship between binding antibody results and neutralization titers and application of screening assay to longitudinal cohort. On a subset of the samples from the threshold and validation sets, we compared screening assay results to neutralizing antibody titers were measured using a microneutralization assay using SARS-CoV-2 and a pseudotype viral neutralization assay using vesicular stomatitis virus (VSV) expressing Spike (A-C). (A) A microneutralization assay was performed on 17 pre-pandemic serum samples and 31 from RT-PCR confirmed cases, and stratified the results into 3 groups: non neutralizing (ND); ND50 of 20 or 50 (≤50); ND50 of 125 or above (≥125) and compared these groupings to the screening assay results: N Pan ELISA; RBD Pan ELISA; Spike Pan ELISA; Spike-RBD Bridging LIPS assay (where readouts are normalised OD or Units). (B) The relationship between results from each screening assay results and ND50 measured using the microneutralization assay in n = 59 samples displayed in scatterplots from a mixture of pre-pandemic (black), PCR-confirmed COVID-19 cases (pink) and exposed individuals or recent COVID-19 suspects (green). with a line showing the smoothed mean determined using a generalized linear model +/- 95% confidence intervals; and correlation performed using Kendall’s tau. (C) Correlogram showing the relationship between a novel pseudotype viral neutralization assay (using mouse VSV expressing SARS-CoV-2 Spike and ACE-2 and TMPRSS-2) and all 16 ELISA and LIPS assays (total antibody and isotype specific) in n = 36 samples with neutralising capacity. (D) Field testing two screening assays (N Pan and Spike Pan ELISA) on longitudinal samples from a cohort of n = 79 healthcare workers in Bristol in 2020 and 2021. (E) Observed seroprevalence/antibody positivity to N and Spike proteins using Pan ELISA assays in a cohort of n = 79 healthcare workers. Total samples collected at each timepoint were as follows: week 0, n=79; week 10, n=66; week 30, n = 42; week 52, n = 37. 95% confidence intervals were calculated using the Wilson method.

References

    1. COVID-19 weekly epidemiological update. World Health Organization; (2022). Geneva, Switzerland. Available at: https://www.who.int/emergencies/diseases/novel-coronavirus-2019/situatio...
    1. Hall VJ, Foulkes S, Charlett A, Atti A, Monk EJM, Simmons R, et al. SARS-CoV-2 infection rates of antibody-positive compared with antibody-negative health-care workers in England: A large, multicentre, prospective cohort study (SIREN). Lancet (2021) 397(10283):1459–69. doi: 10.1016/S0140-6736(21)00675-9 - DOI - PMC - PubMed
    1. Jonczyk R, Stanislawski N, Seiler LK, Blume H, Heiden S, Lucas H, et al. Combined prospective seroconversion and PCR data of selected cohorts indicate a high rate of subclinical SARS-CoV-2 infections-an open observational study in lower Saxony, Germany. Microbiol Spectr. (2022) 10(1):e0151221–e. doi: 10.1128/spectrum.01512-21 - DOI - PMC - PubMed
    1. Earle KA, Ambrosino DM, Fiore-Gartland A, Goldblatt D, Gilbert PB, Siber GR, et al. Evidence for antibody as a protective correlate for COVID-19 vaccines. Vaccine (2021) 39(32):4423–8. doi: 10.1016/j.vaccine.2021.05.063 - DOI - PMC - PubMed
    1. Cromer D, Steain M, Reynaldi A, Schlub TE, Wheatley AK, Juno JA, et al. Neutralising antibody titres as predictors of protection against SARS-CoV-2 variants and the impact of boosting: A meta-analysis. Lancet Microbe (2022) 3(1):e52–61. doi: 10.1016/S2666-5247(21)00267-6 - DOI - PMC - PubMed

Publication types