. 2022 Nov 10:13:1008456.
doi: 10.3389/fimmu.2022.1008456. eCollection 2022.

Autologous organoid co-culture model reveals T cell-driven epithelial cell death in Crohn's Disease

Affiliations

Autologous organoid co-culture model reveals T cell-driven epithelial cell death in Crohn's Disease

Nassim Hammoudi et al. Front Immunol. .

Abstract

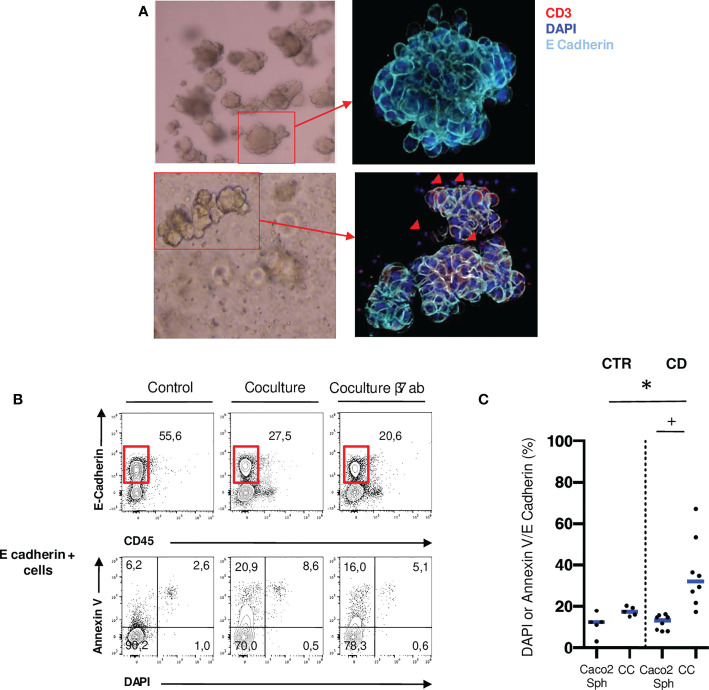
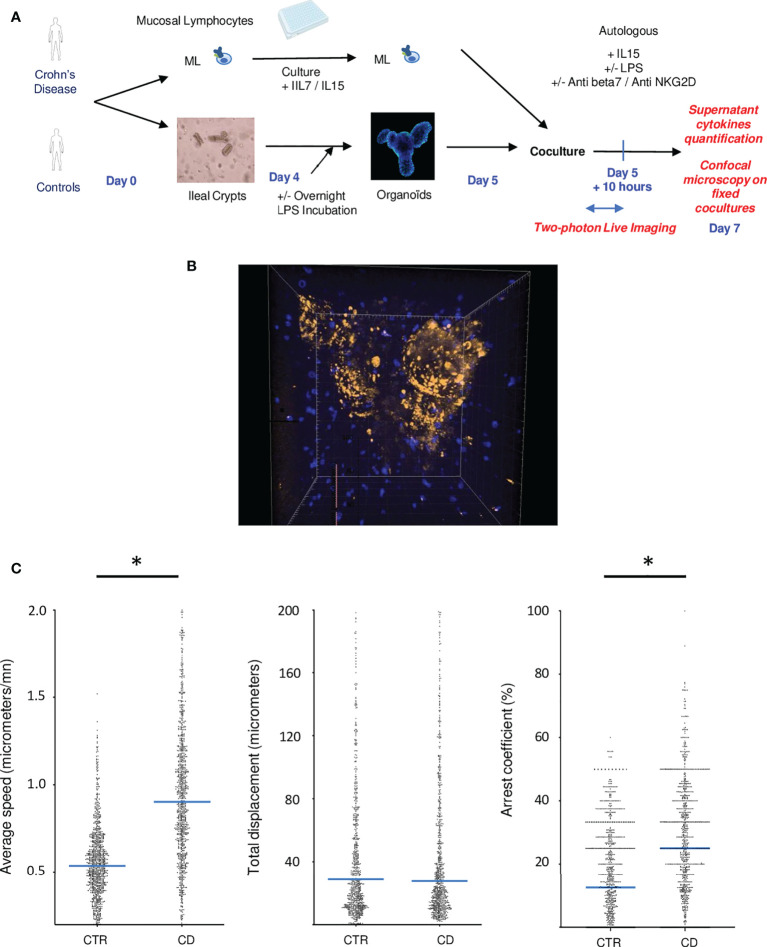
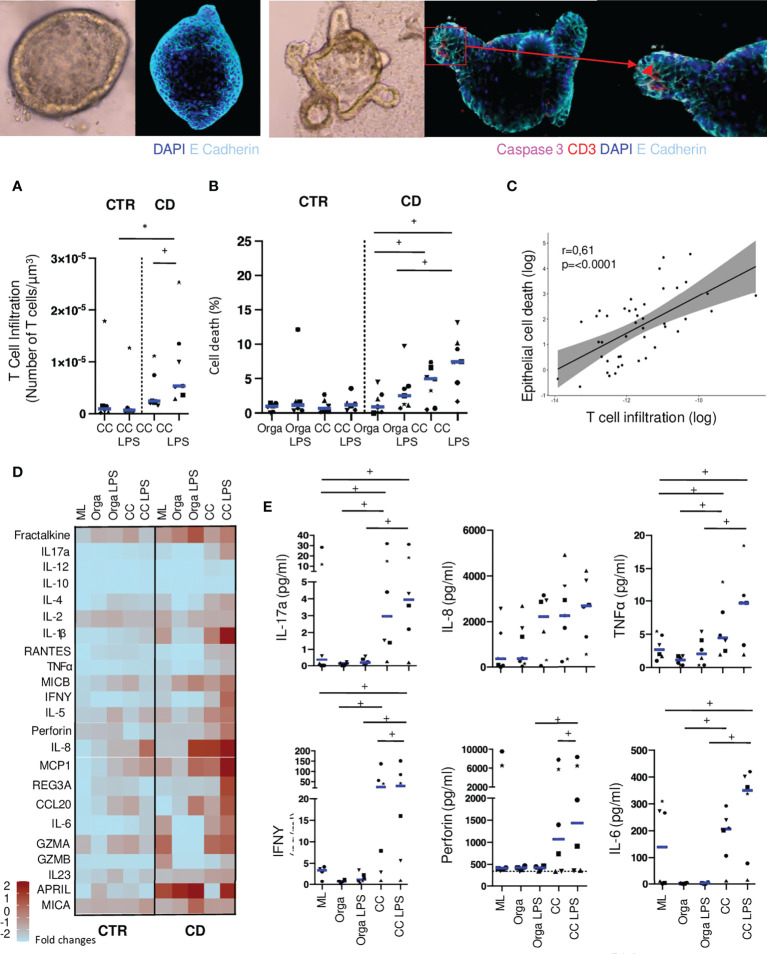
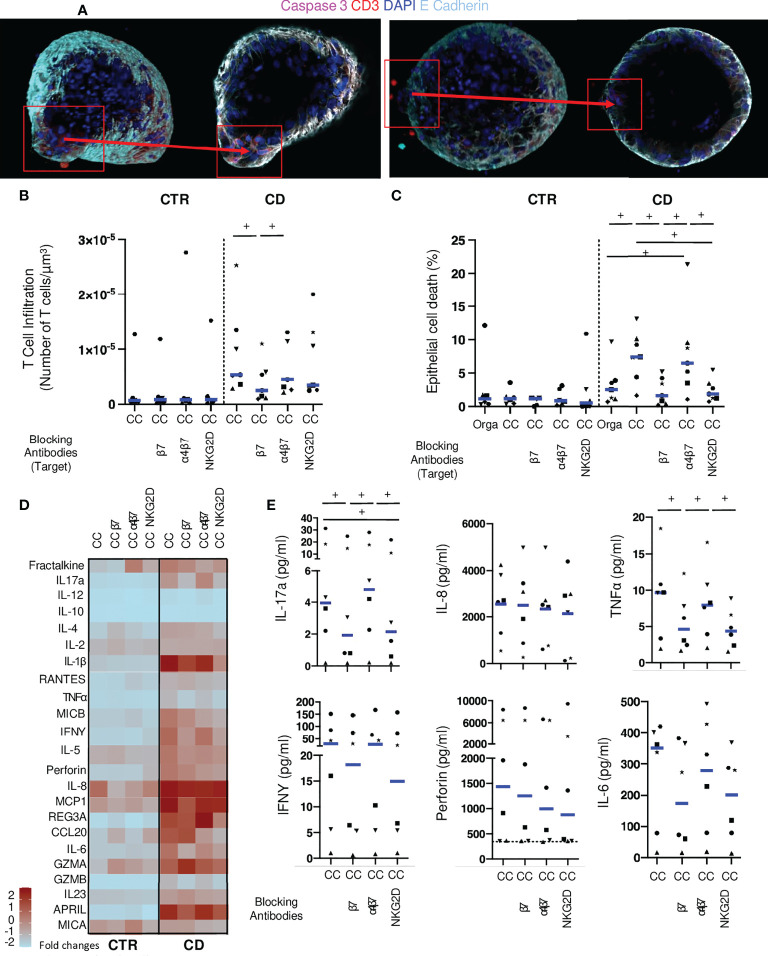
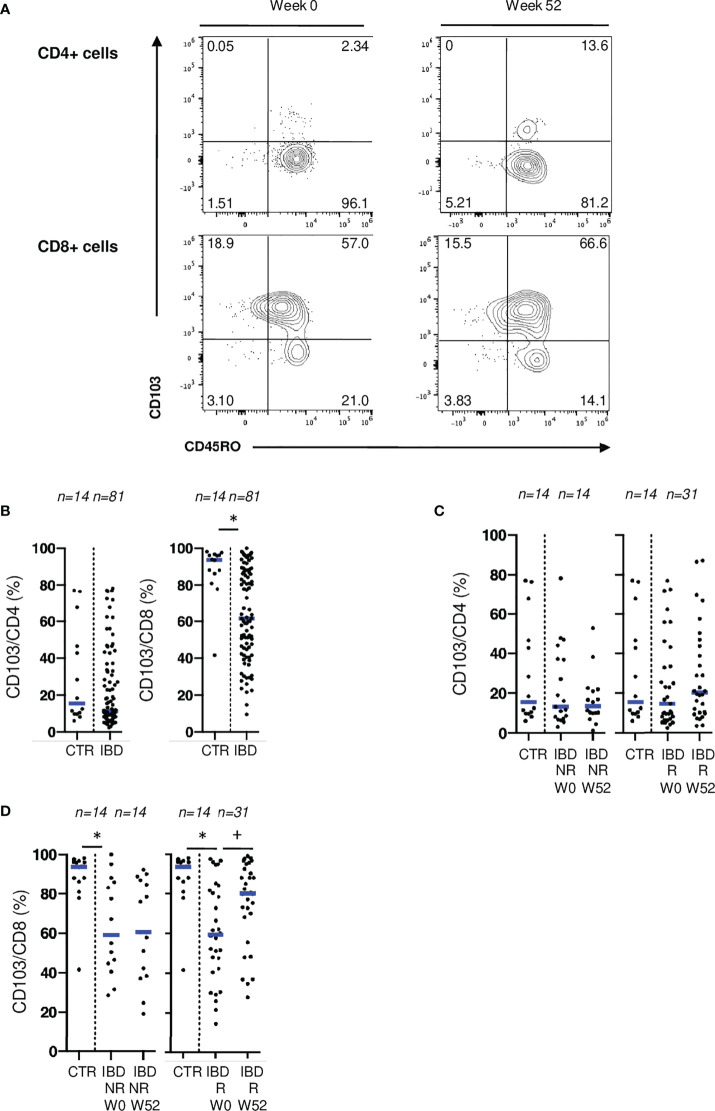
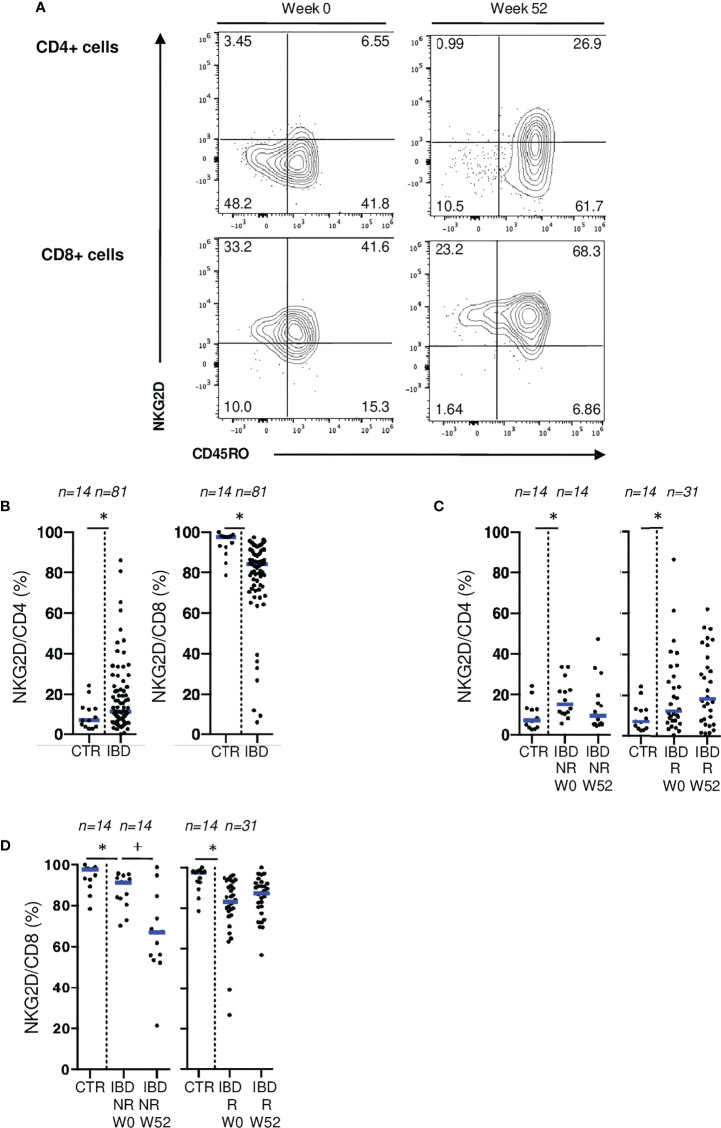
Lympho-epithelial interactions between intestinal T resident memory cells (Trm) and the epithelium have been associated with inflammatory bowel disease (IBD) activity. We developed ex vivo autologous organoid-mucosal T cell cocultures to functionally assess lymphoepithelial interactions in Crohn's Disease (CD) patients compared to controls. We demonstrate the direct epithelial cell death induced by autologous mucosal T cells in CD patients but not in controls. These findings were positively correlated with T cell infiltration of the organoids. This potential was inhibited by limiting lympho-epithelial interactions through CD103 and NKG2D blocking antibodies. These data directly demonstrate for the first time the direct deleterious effect of mucosal T cells on the epithelium of CD patients. Such ex-vivo models are promising techniques to unravel the pathophysiology of these diseases and the potential mode of action of current and future therapies.

Keywords: CD103; NKG2D; crohn’s disease; inflammatory bowel diseases; lymphoepithelial interactions; organoids.


Conflict of interest statement

MA received grant supports from Innate Pharma, Janssen, Takeda, Genentech/Roche, and honoraria for teaching activities or consultancy from Abbvie, Amgen, Biogen, Boehringer-Ingelheim, Bristol Myers Squibb, Celgene, Celltrion, Ferring, Genentech, Gilead, IQVIA, Janssen, Novartis, Pfizer, Roche, Takeda, Tillots. NH received honorarium for consultancy from Janssen and Takeda. M-LT-M received honoraria from Abbvie and Janssen. J-MG has been a speaker and/advisory board member for Abbvie, Amgen, Celltrion, Takeda, Janssen and Sanofi Genzyme. SH, JB, HB, KP, LC, MB, VC, BG, CG, DH, JB, HC, LM, CB, AT and LLB have no conflict of interest to declare. MN, JM are employed by Genentech and CB by Institut Roche. The remaining authors declare that the research was conducted in the absence of any commercial or financial relationships that could be constructed as a potential conflict of interest.

Figures

Figure 1
Figure 1
Ileal mucosal T cells from patients with active CD have an increased cytotoxic potential over Caco2 spheroids. (A) Caco2 spheroids alone or in coculture with mucosal T cells from CD patients in brightfield microscopy (10X) and confocal microscopy (200X: Blue: DAPI; Light Blue: E-Cadherin). Red arrows correspond to T cells infiltrating the spheroid (Red: CD3). (B) Gating strategy to assess Caco2 cell death with or without T cells in cocultures. Cell death was assessed through Annexin V and DAPI staining in E-Cadherin positive cells. (C) Comparison of Caco2 cells death rates between allogenic cocultures with mucosal T cells from controls and active CD patients. CD= Crohn’s Disease, CTR= Control. CTR: n=5; CD: n=8. *p < 0.05 Mann Whitney Test. +: p < 0.05 Wilcoxon paired Test.
Figure 2
Figure 2
Autologous co-cultures reveal direct interactions between mucosal lymphocytes and epithelial organoids especially in CD patients. (A) Experimental design of cocultures (B) Example of a two photon acquisition for a CD patient showing multiple interactions between T cells and an organoid. (C) Average speed, total displacement and arrest coefficient of lymphocytes in cocultures. Each dot corresponds to a lymphocyte. Cells from different individuals were combined in this figure. These figures represent 2 control patients and 3 IBD patients. CD= Crohn’s Disease, CTR= Control. *p < 0.05 Mann Whitney Test.
Figure 3
Figure 3
Autologous T cells from CD patients infiltrate organoids and induce epithelial cell death. (A) T cell infiltration in the organoids evaluated by the number of CD3 positive-cells in contact or infiltrating each organoid with or without LPS preincubation. Each dot corresponds to the median of the values obtained for organoids of a given patient. Each shape of point corresponds to a given patient. CTR: n=6, CD: n=7. (B) Organoid epithelial cell death evaluated by Caspase 3 fluorescence area over organoid volume in organoids alone or cocultures with or without LPS preincubation. CTR: n=6, CD: n=7 (C) Correlation between T cell infiltration and epithelial cell death in coculture with LPS preincubation. Each dot corresponds to the absolute value obtained for an organoid. (D) Cytokine detection matrix in the supernatants. Each square represents the median value of the results obtained for each well of a given condition in the distinct patients. The color of each square stands for the level expression. CTR: n=6 CD: n=6. (E) Absolute values of cytokine quantification of 6 analytes (IL-17a, IL-8, TNFalpha, IFNgamma, Perforin and IL-6) in the supernatants from CD patients. Each dot corresponds to the absolute value obtained for a given condition. Each shape of point corresponds to a given patient. CC= Coculture, CD= Crohn’s Disease, CTR= Control, LPS= Lipopolysaccharide ML= Mucosal Lymphocytes, Orga= Organoid. +: p < 0.05 Wilcoxon paired Test, *p < 0.05 Mann-Whitney Test.
Figure 4
Figure 4
Monoclonal antibodies targeting lympho-epithelial interactions reduce epithelial cell death in co-cultures. (A) Organoid in coculture with mucosal T cells from CD patients without (left) or with anti-beta7 (right) in confocal microscopy (200X: Blue: DAPI; Light Blue: E-Cadherin, Red CD3, Pink: Caspase 3). (B) T cell infiltration in the organoids evaluated by the number of CD3 positive-cells in contact or infiltrating each organoid with LPS incubation. Each dot corresponds to the median of the values obtained for organoids of a given patient. Each shape of point corresponds to a given patient. CTR: n=6, CD: n=7. (C) Organoid epithelial cell death evaluated by Caspase 3 fluorescence area over organoid volume in organoids alone or cocultures with LPS incubation. CTR: n=6, CD: n=7. (D) Cytokine detection matrix in the supernatant in LPS coculture conditions. Each square represents the median value of the results obtained for each well of a given condition in the distinct patients. The color of each square stands for the level expression (Form light blue: low expression to deep red: high expression). CTR: n=6, CD: n=6. (E) Absolute values of cytokine quantification of 6 analytes (IL-17a, IL-8, TNFalpha, IFNgamma, Perforin and IL-6) for CD patients. Each dot corresponds to the absolute value obtained for a given condition (with LPS). Each shape of point corresponds to a given patient. CC= Coculture, CD= Crohn’s Disease, CTR= Control, ML= Mucosal Lymphocytes, Orga= Organoid. +: p < 0.05 Wilcoxon paired test.
Figure 5
Figure 5
CD103 expression on mucosal T cells is associated with IBD disease activity. (A) Gating strategy for CD103 and CD45RO stainings in flow cytometry. (B) Comparison of mucosal rates of CD4 and CD8 T cells expressing CD103 between controls and patients from the ELYP cohort at week 0. (C) Evolution of mucosal rate of CD8 T cells expressing CD103 rates in IBD patients from the ELYP cohort without or with endoscopic response to biotherapy. (D) Evolution of mucosal rate of CD4 T cells expressing CD103 rates in IBD patients from the ELYP cohort without or with endoscopic response to biotherapy. CTR: ileal mucosal samples) CD= Crohn’s Disease, CTR= Control, IBD= Inflammatory Bowel Disease, NR= Non Responders, R= Responders. *p < 0.05 Mann Whitney Test; +: p < 0.05 Wilcoxon Paired Test.
Figure 6
Figure 6
NKG2D expression on mucosal T cells is associated with IBD disease activity. (A) Gating strategy for CD45RO and NKG2D stainings in flow cytometry. (B) Comparison of mucosal rates of CD4 and CD8 T cells expressing NKG2D between controls and patients from the ELYP cohort at week 0. (C) Evolution of mucosal rate of CD8 T cells expressing NKG2D rates in IBD patients from the ELYP cohort without or with endoscopic response to biotherapy. (D) Evolution of mucosal rate of CD4 T cells expressing NKG2D rates in IBD patients from the ELYP cohort without or with endoscopic response to biotherapy. CD= Crohn’s Disease, CTR= Control, IBD= Inflammatory Bowel Disease, NR= Non Responders, R= Responders. *p < 0.05 Mann Whitney Test; +: p < 0.05 Wilcoxon Paired Test.

References

    1. Giuffrida P, Corazza GR, di Sabatino A. Old and new lymphocyte players in inflammatory bowel disease. Digestive Dis Sci (2018) 63:277–88. doi: 10.1007/s10620-017-4892-4 - DOI - PubMed
    1. Mackay L, Kallies A. Transcriptional regulation of tissue-resident lymphocytes. Trends Immunol (2017) 38:94–103. doi: 10.1016/j.it.2016.11.004 - DOI - PubMed
    1. Kumar B, Ma W, Miron M, Granot T, Guyer RS, Carpenter DJ, et al. . Human tissue-resident memory T cells are defined by core transcriptional and functional signatures in lymphoid and mucosal sites. Cell Rep (2017) 20:2921–34. doi: 10.1016/j.celrep.2017.08.078 - DOI - PMC - PubMed
    1. Schenkel J, Masopust D. Tissue-resident memory T cells. Immunity (2014) 41:886–97. doi: 10.1016/j.immuni.2014.12.007 - DOI - PMC - PubMed
    1. Mayer L, Eisenhardt D. Lack of induction of suppressor T cells by intestinal epithelial cells from patients with inflammatory bowel disease. J Clin Invest (1990) 86:1255–60. doi: 10.1172/JCI114832 - DOI - PMC - PubMed

Publication types