

Integrating RNA-seq and scRNA-seq to explore the biological significance of NAD + metabolism-related genes in the initial diagnosis and relapse of childhood B-cell acute lymphoblastic leukemia
- PMID: 36439178
- PMCID: PMC9691973
- DOI: 10.3389/fimmu.2022.1043111
Integrating RNA-seq and scRNA-seq to explore the biological significance of NAD + metabolism-related genes in the initial diagnosis and relapse of childhood B-cell acute lymphoblastic leukemia
Abstract
Background: Nicotinamide Adenine Dinucleotide (NAD) depletion is reported to be a potential treatment for B-cell Acute Lymphoblastic Leukemia (B-ALL), but the mechanism of NAD metabolism-related genes (NMRGs) in B-ALL relapse remains unclear.
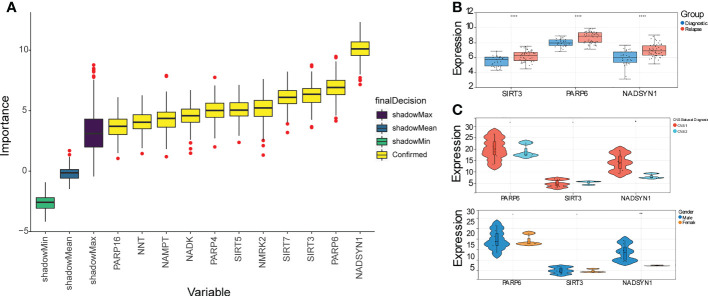
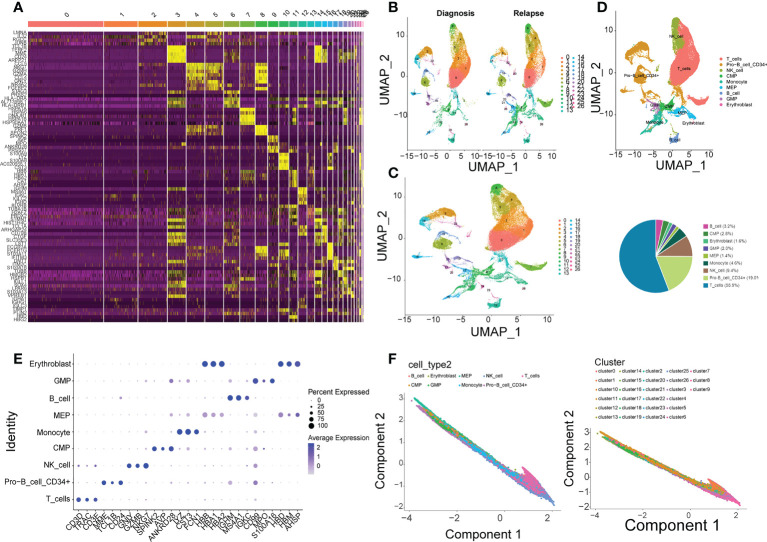
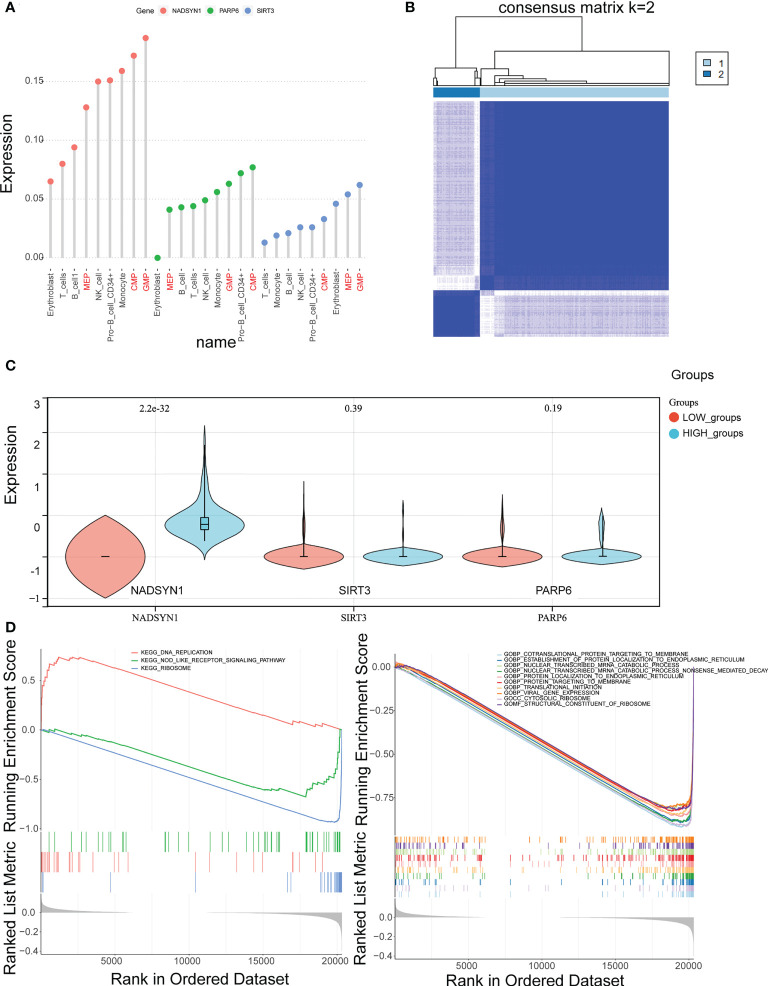
Methods: Transcriptome data (GSE3912), and single-cell sequencing data (GSE130116) of B-ALL patients were downloaded from Gene Expression Omnibus (GEO) database. NMRGs were sourced from Kyoto Encyclopedia of Genes and Genomes (KEGG) and Reactome databases. Further, the differentially expressed NMRGs (DE-NMRGs) were selected from the analysis between initial diagnosis and relapse B-ALL samples, which further performed functional enrichment analyses. The biomarkers were obtained through random forest (RF) algorithm and repeated cross validation. Additionally, cell type identification by estimating relative subsets of RNA transcripts (CIBERSORT) algorithm was used to evaluate the immune cell differences between the initial diagnosis and relapse samples, and the correlations between biomarkers and gene markers of differential immune cells were analyzed. Furthermore, single cell RNA sequencing was conducted in the GSE130116 dataset to find key cell clusters. In addition, according to biomarkers expressions, cell clusters were categorized into high and low biomarker expression groups, and Gene Set Enrichment Analysis (GSEA) analysis was performed on them. Finally, the cell clusters with the highest expression of biomarkers were selected to explore the roles of biomarkers in different cell clusters and identify transcription factors (TFs) influencing biological markers.
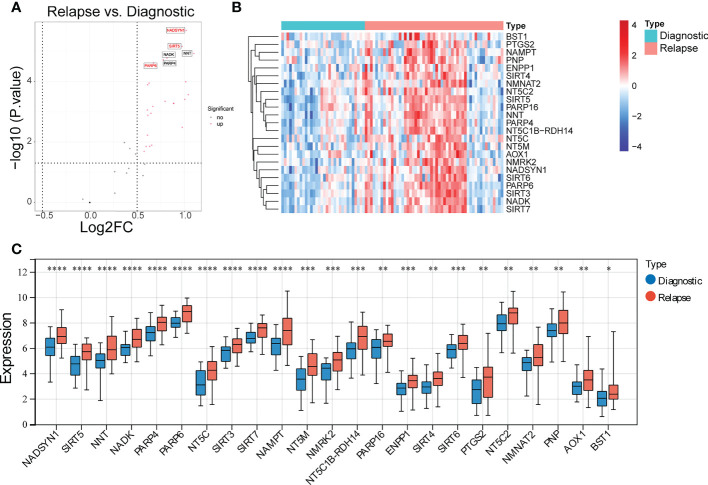
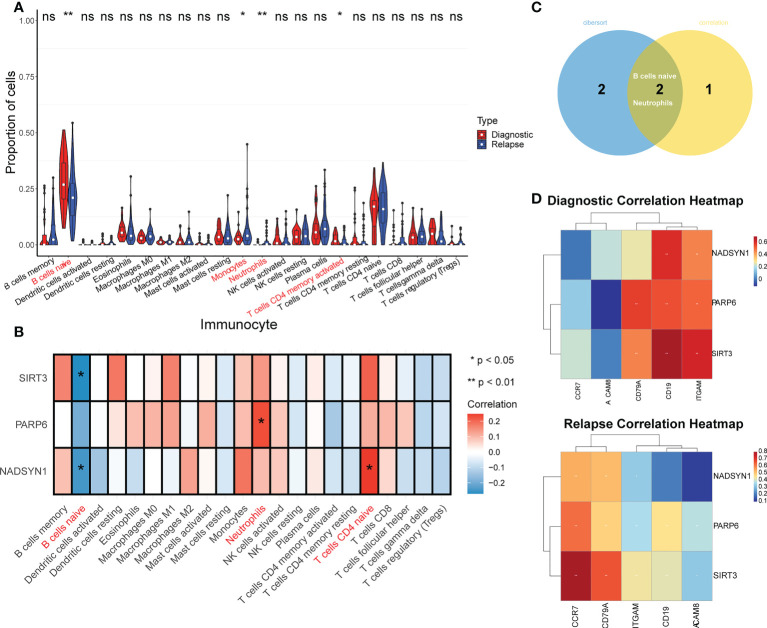
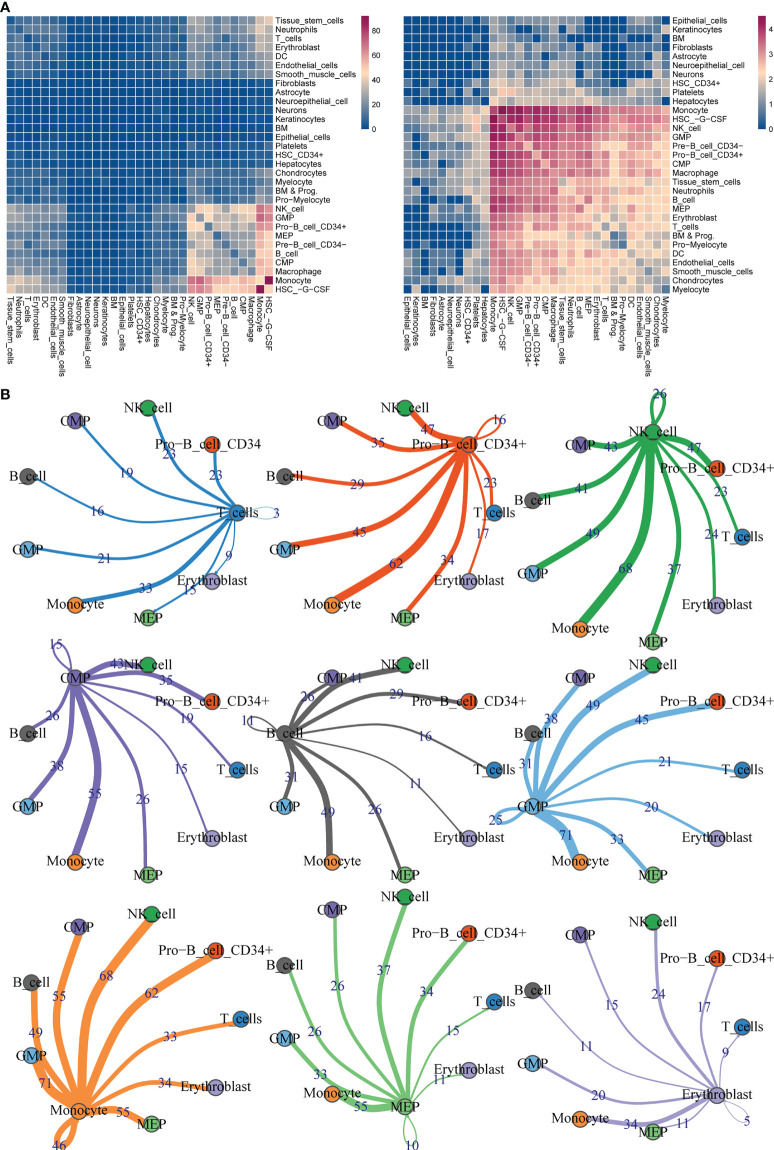
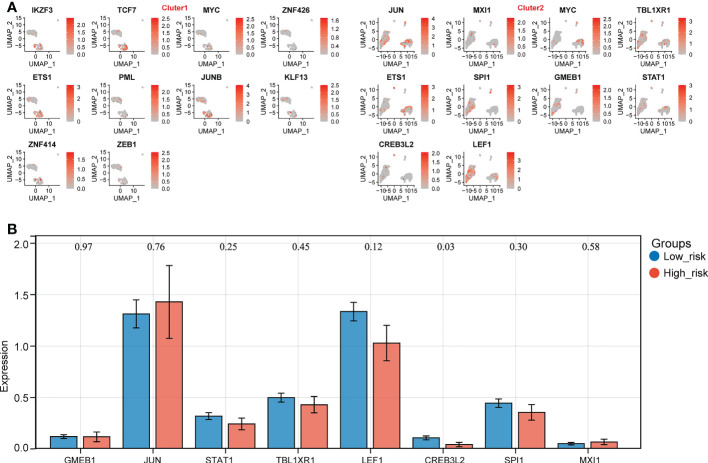
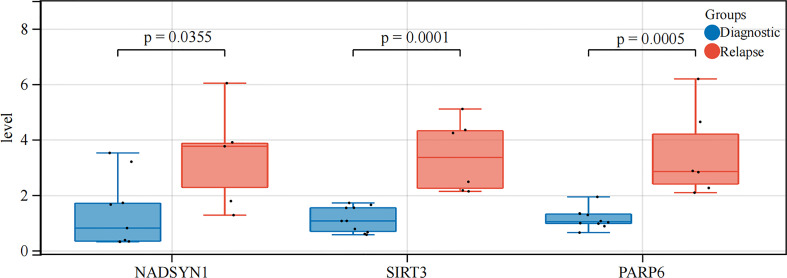
Results: 23 DE-NMRGs were screened out, which were mainly enriched in nucleoside phosphate metabolic process, nucleotide metabolic process, and Nicotinate and nicotinamide metabolism. Moreover, 3 biomarkers (NADSYN1, SIRT3, and PARP6) were identified from the machine learning. CIBERSORT results demonstrated that four types of immune cells (B Cells naive, Monocyte, Neutrophils, and T cells CD4 memory Activated) were significantly different between the initial diagnosis and the relapse B-ALL samples, and there were strong correlations between biomarkers and differential immune cells such as positive correlation between NADSYN1 and B Cells naive. The single cell analyses showed that the biomarkers were highly expressed in common myeloid progenitors (CMP), granulocyte-macrophage progenitor (GMP), and megakaryocyte-erythroid progenitor (MEP) cell clusters. Gene set enrichment analysis (GSEA) results indicated that 55 GO terms and 3 KEGG pathways were enriched by the genes in high and low biomarker expression groups. It was found that TF CREB3L2(+) was significantly reduced in the high expression group, which may be the TF affecting biomarkers in the high expression group.
Conclusion: This study identified NADSYN1, SIRT3, and PARP6 as the biomarkers of B-ALL, explored biological significance of NMRGs in the initial diagnosis and relapse of B-ALL, and revealed mechanism of biomarkers at the level of the single cell.
Keywords: B-cell acute lymphoblastic leukemia; NAD metabolism-related genes; biomarkers; cell cluster; single cell RNA sequencing.
Copyright © 2022 Lin, Xu, Zhong, Chen, Xue, Yang and Chen.
Conflict of interest statement
The authors declare that the research was conducted in the absence of any commercial or financial relationships that could be construed as a potential conflict of interest.
Figures
References
Publication types
MeSH terms
Substances
LinkOut - more resources
Full Text Sources
Research Materials
Miscellaneous