. 2022 Nov 11:13:1042449.
doi: 10.3389/fphys.2022.1042449. eCollection 2022.

Imbalance hepatic metabolism homeostasis in the F1 generation of endometrial DNMT3B conditional knockout female mice

Affiliations

Imbalance hepatic metabolism homeostasis in the F1 generation of endometrial DNMT3B conditional knockout female mice

Weike Li et al. Front Physiol. .

Abstract

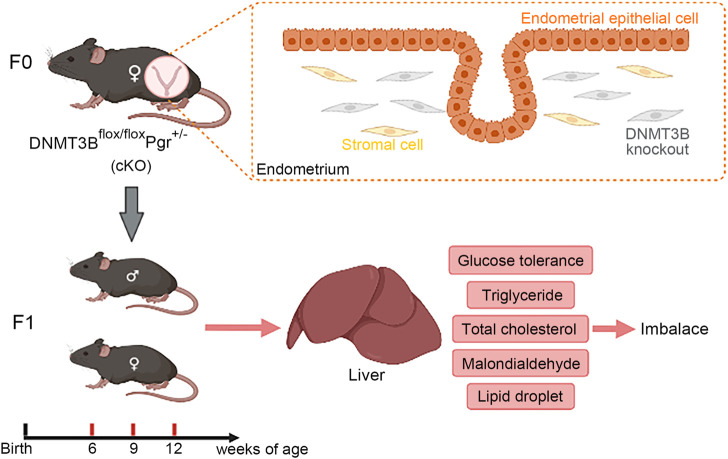
Numerous studies have suggested the possibility of explaining the etiology of metabolic syndrome through DNA methylation. DNA methyltransferase 3B (DNMT3B) plays an important role in de novo DNA methylation. There was an alteration in maternal (F0) endometrial function, which might lead to growth and developmental disorder in offspring (F1). In this study, we investigated the effect of maternal endometrial DNMT3B deficiency on the metabolism in offspring. We constructed endometrial DNMT3B conditional knockout female mice (cKO) which were mated with normal C57BL/6 male mice to obtain the F1 generation. Further, to study the development of these offspring, we observed them at three different life stages which included the 6-week-old juvenile, 9-week-old sub-adult and 12-week-old adult. Follow the detection of a range of metabolism-related indicators, we found that in the cKO F1 generation, liver triglyceride level was significantly elevated in 9-week-old female mice, lipid droplet deposition was significantly increased in 9-week-old and 12-week-old mice, and the expression of lipid metabolism key factors in the liver was markedly decreased except of 6-week-old male mice. These results indicate that maternal endometrial DNMT3B conditional knockout leads to imbalance in hepatic metabolism in F1 generation, the mechanism of which requires further discussion.

Keywords: DNMT3B; F1 generation; glucose; lipid metabolism; liver.


Conflict of interest statement

The authors declare that the research was conducted in the absence of any commercial or financial relationships that could be construed as a potential conflict of interest.

Figures

FIGURE 1
FIGURE 1
The construction and verification of endometrial DNMT3B conditional knockout female mice (A) DNMT3B flox/flox female mice were mated with Pgr Cre/+ male mice to acquire DNMT3B flox/+ Pgr Cre/+ male mice. Then, DNMT3B flox/+ Pgr Cre/+ male mice were mated with DNMT3B flox/flox female mice to acquire DNMT3B flox/flox (control) and DNMT3B flox/flox Pgr Cre/+ (cKO) female mice. Control or cKO female mice (7–10 weeks old) were mated with normal pubescent C57BL/6 male mice (wild type). Thus, the F1 generation was acquired and divided into three different life stages: 6-week-old (juvenile), 9-week-old (sub-adult) and 12-week-old (adult). (B) The expression of uterine endometrial DNMT3B was detected on day 4 using immunohistochemistry. D4: day 4 of pregnancy. Black rectangular box represented magnified area. Scale bar: the larger image is 100μm, and the smaller image is 200 μm.
FIGURE 2
FIGURE 2
Glucose homeostasis was impaired in the F1 generation of endometrial DNMT3B conditional knockout female mice (A) The body weight of the F1 generation was recorded continuously at 6-weeks, 9-weeks and 12-weeks of age (n = 7). (B) Fasting blood glucose level of the F1 generation at 6-weeks, 9-weeks and 12-weeks of age (n = 7–9). (C–E) Glucose tolerance in the F1 generation at 6-weeks, 9-weeks and 12-weeks of age was measured continuously (n = 7–10). (F) The area under the curve of glucose tolerance in control and cKO F1 mice at 6-weeks, 9-weeks and 12-weeks of age. Results are presented as mean ± SEM. *p < 0.05, **p < 0.01, *** and #p < 0.001. GTT, glucose tolerance test. AUC, the area under the curve.
FIGURE 3
FIGURE 3
Glucose tolerance was measured by GTT in the male and female F1 generation of control and cKO female mice (A–C) Glucose tolerance in control and cKO F1 male mice was measured at 6-weeks, 9-weeks and 12-weeks of age (n = 3–4). (D–F) Glucose tolerance in control and cKO F1 female mice was measured at 6-weeks, 9-weeks and 12-weeks of age (n = 3–7). (G–I) The area under the curve of glucose tolerance in control and cKO F1 male and female mice at 6-weeks, 9-weeks and 12-weeks of age. Results are presented as mean ± SEM. *p < 0.05, **p < 0.01, *** and #p < 0.001. GTT, glucose tolerance test. AUC, the area under the curve.
FIGURE 4
FIGURE 4
Liver morphology of the F1 generation of endometrial DNMT3B conditional knockout female mice (A) Liver morphology of control and cKO F1 male and female mice at 6-weeks, 9-weeks and 12-weeks of age. (B–D) Viscera index of liver was calculated in control and cKO F1 male and female mice at 6-weeks, 9-weeks and 12-weeks of age (n = 9–11). Results are presented as mean ± SEM. Scale bar: 1.5 cm *p < 0.05.
FIGURE 5
FIGURE 5
The concentration of serum lipid was measured in F1 generation of endometrial DNMT3B conditional knockout female mice (A–C) Serum triglyceride levels were measured in control and cKO F1 male (n = 8–11) and female (n = 4–15) mice at 6-weeks, 9-weeks and 12-weeks of age. (D–F) Serum total cholesterol levels were measured in control and cKO F1 male (n = 8–11) and female (n = 4–15) mice at 6-weeks, 9-weeks and 12-weeks of age. Results are presented as mean ± SEM. *p < 0.05, **p < 0.01, ***p < 0.001.
FIGURE 6
FIGURE 6
The concentration of liver lipid was measured in F1 generation of endometrial DNMT3B conditional knockout female mice (A–C) The concentration of liver triglyceride was measured in control and cKO F1 male (n = 8–17) and female (n = 6–10) mice at 6-weeks, 9-weeks and 12-weeks of age. (D–F) The concentration of liver malondialdehyde was measured in control and cKO F1 male (n = 8–12) and female (n = 5–11) mice at 6-weeks, 9-weeks and 12-weeks of age. Results are presented as mean ± SEM. MDA, malondialdehyde. *p < 0.05, ***p < 0.001.
FIGURE 7
FIGURE 7
Compromised liver structure and enhanced lipid droplet deposition were observed in F1 generation of endometrial DNMT3B conditional knockout female mice. (A) Upper three lines: the micromorphology of liver in control and cKO F1 mice at 6-weeks, 9-weeks and 12-weeks of age was detected using H&E staining. Lower three lines: lipid droplets around the central vein of the liver in control and cKO F1 mice at 6-weeks, 9-weeks and 12-weeks of age were detected using oil red O staining. (B–D) The statistical results of lipid droplets distribution area (n = 3). Results are presented as mean ± SEM. **p < 0.01, ***p < 0.001. Black arrow: expansion of hepatic cord space. Scale bar: red bar and black bar are 20 μm.
FIGURE 8
FIGURE 8
The expression of key lipid metabolism factors in the liver was down-regulated in the F1 generation of endometrial DNMT3B conditional knockout female mice (A) The expression of CPT1A and PPARα in the liver of control and cKO F1 mice was measured using western blotting at 6-weeks, 9-weeks and 12-weeks of age (n = 4–5). (B) Relative expression of CPT1A and PPARα. β-actin was used as the standard to calibrate the gray value of each sample. (C) The expression of CPT1A was measured using immunohistochemistry. Results are presented as mean ± SEM. *p < 0.05, **p < 0.01, ***p < 0.001. Scale bar: 20 μm.
FIGURE 9
FIGURE 9
In this study, de novo methylation gene DNMT3B was conditionally knocked out from the endometrial stromal cells of maternal mice, which might cause changes in uterine environment and influence health status of the next generation. Our results indicated that hepatic glucose and lipid metabolism was abnormal in cKO F1 mice, mainly manifested as impaired glucose tolerance, abnormal serum and liver lipid levels, and increased lipid droplets deposition in the liver, suggesting that cKO F1 mice were at a greater risk of metabolic syndrome than control F1 mice.

References

    1. Anagnostis P., Christou K., Artzouchaltzi A. M., Gkekas N. K., Kosmidou N., Siolos P., et al. (2019). Early menopause and premature ovarian insufficiency are associated with increased risk of type 2 diabetes: A systematic review and meta-analysis. Eur. J. Endocrinol. 180, 41–50. 10.1530/EJE-18-0602 - DOI - PubMed
    1. Baubec T., Colombo D. F., Wirbelauer C., Schmidt J., Burger L., Krebs A. R., et al. (2015). Genomic profiling of DNA methyltransferases reveals a role for DNMT3B in genic methylation. Nature 520, 243–247. 10.1038/nature14176 - DOI - PubMed
    1. Bechmann L. P., Hannivoort R. A., Gerken G., Hotamisligil G. S., Trauner M., Canbay A. (2012). The interaction of hepatic lipid and glucose metabolism in liver diseases. J. Hepatol. 56, 952–964. 10.1016/j.jhep.2011.08.025 - DOI - PubMed
    1. Bommarito P. A., Martin E., Fry R. C. (2017). Effects of prenatal exposure to endocrine disruptors and toxic metals on the fetal epigenome. Epigenomics 9, 333–350. 10.2217/epi-2016-0112 - DOI - PMC - PubMed
    1. Castellano-Castillo D., Moreno-Indias I., Sanchez-Alcoholado L., Ramos-Molina B., Alcaide-Torres J., Morcillo S., et al. (2019). Altered adipose tissue DNA methylation status in metabolic syndrome: Relationships between global DNA methylation and specific methylation at adipogenic, lipid metabolism and inflammatory candidate genes and metabolic variables. J. Clin. Med. 8, 87. 10.3390/jcm8010087 - DOI - PMC - PubMed

LinkOut - more resources