. 2022 Nov 10:12:1029995.
doi: 10.3389/fonc.2022.1029995. eCollection 2022.

Mutational patterns along different evolution paths of follicular lymphoma

Affiliations

Mutational patterns along different evolution paths of follicular lymphoma

Miri Michaeli et al. Front Oncol. .

Abstract

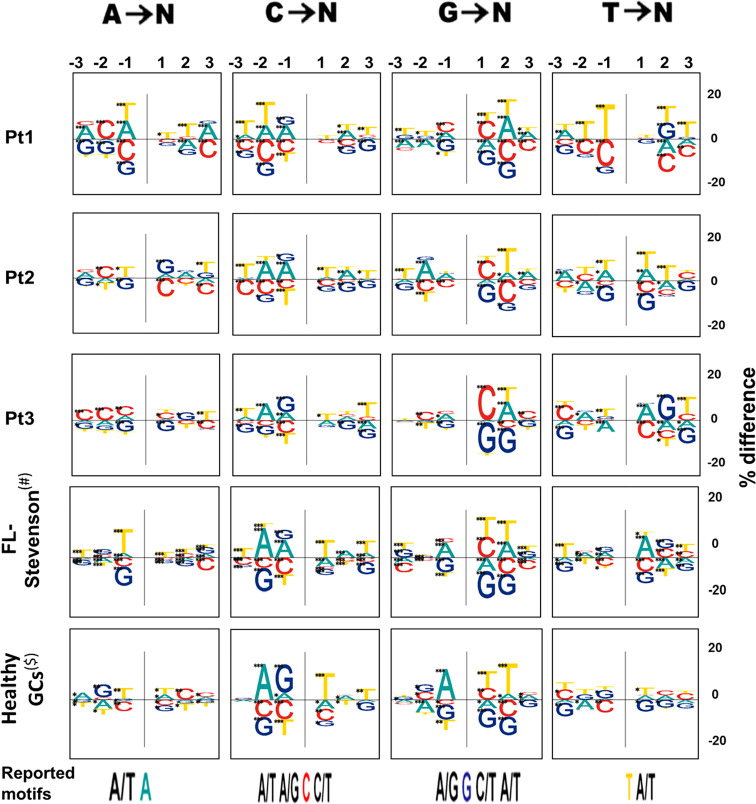
Follicular lymphoma (FL) is an indolent disease, characterized by a median life expectancy of 18-20 years and by intermittent periods of relapse and remission. FL frequently transforms into the more aggressive diffuse large B cell lymphoma (t-FL). In previous studies, the analysis of immunoglobulin heavy chain variable region (IgHV) genes in sequential biopsies from the same patient revealed two different patterns of tumor clonal evolution: direct evolution, through acquisition of additional IgHV mutations over time, or divergent evolution, in which lymphoma clones from serial biopsies independently develop from a less-mutated common progenitor cell (CPC). Our goal in this study was to characterize the somatic hypermutation (SHM) patterns of IgHV genes in sequential FL samples from the same patients, and address the question of whether the mutation mechanisms (SHM targeting, DNA repair or both), or selection forces acting on the tumor clones, were different in FL samples compared to healthy control samples, or in late relapsed/transformed FL samples compared to earlier ones. Our analysis revealed differences in the distribution of mutations from each of the nucleotides when tumor and non-tumor clones were compared, while FL and transformed FL (t-FL) tumor clones displayed similar mutation distributions. Lineage tree measurements suggested that either initial clone affinity or selection thresholds were lower in FL samples compared to controls, but similar between FL and t-FL samples. Finally, we observed that both FL and t-FL tumor clones tend to accumulate larger numbers of potential N-glycosylation sites due to the introduction of new SHM. Taken together, these results suggest that transformation into t-FL, in contrast to initial FL development, is not associated with any major changes in DNA targeting or repair, or the selection threshold of the tumor clone.

Keywords: B lymphocytes; clonal evolution; follicular lymphoma; high-throughput sequencing; somatic hypermutation.


Conflict of interest statement

The authors declare that the research was conducted in the absence of any commercial or financial relationships that could be construed as a potential conflict of interest.

Figures

Figure 1
Figure 1
Mutation spectra (distribution among nucleotides). The number of mutations from each nucleotide, presented as a fraction out of the total number of mutations, for (A) tumor and non-tumor clones in each patient analyzed (also including the reference FL samples from a previous study and control GC samples) and (B) for tumor and non-tumor clones in each sample analyzed. Significant differences are indicated with lines between pie-charts (*p-value < 0.05; **p-value < 0.0005). Data regarding the numbers of mutations from each nucleotide and p-values of the comparisons between the different groups are shown in Tables S3, S4 and Tables S5, S6 , respectively.
Figure 2
Figure 2
Transition-transversion mutation ratios. (A) In tumor and non-tumor clones per patient analyzed and (B) In tumor and non-tumor clones per sample. Additional information regarding the numbers of transition and transversion mutations in tumor and non-tumor clones of FL patients, and in healthy GCs are provided in the Tables S7 and S8 . According to the χ² test, no significant differences were observed between tumor and non-tumor clones across different patients. Significant differences were found when tumor and non-tumor clones from sample 2 from patient 1 and sample 1 from patient 2 (*p-value < 0.005) were compared. (See also Tables S7 and S8 ).
Figure 3
Figure 3
Mutation targeting motifs. On the top we show the 3 nucleotides examined upstream and downstream, for each mutated nucleotide, denoted as -1, -2, and -3, for the 3 positions flanking the mutation upstream and 1, 2, and 3 for those flanking the mutation downstream. The positive and negative sides of the Y axis denote excess or paucity of the indicated nucleotide in that position, respectively. The size of each letter is given by the “% difference”, calculated as percentage of each base at each position flanking a particular mutation, minus the percentage composition of the GL sequence at that position. Asterisks represent levels of significance (*p-value < 0.05; **p-value < 0.005; ***p-value < 0.0005). Previously reported motifs are shown at the bottom of the figure; the mutated nucleotide is colored and the flanking nucleotides are shown for reported positions.
Figure 4
Figure 4
Analysis of PGS and AGS in FL samples. (A) Average numbers of existing potential PGS (0) and number of motifs that are only one mutation away from becoming an AGS (1) in clonal GL sequences, in tumor and non-tumor clones in each patient, and (B) in each sample in each patient. In case there was only one clonal GL sequence, the average number is the actual number. (C) Percentages of clones with AGS out of all clones in each patient. (D) Average numbers of AGS in tumor and non-tumor clones from each patient, and (E) from each sample in each patient. **p-value < 0.005.
Figure 5
Figure 5
Lineage tree topologies. (A) Outgoing degree (OD-avg) of tumor and non-tumor clones of the three FL-HTS patients, FL-S and healthy GC samples. (B) OD-avg of tumor and non-tumor clones in each sample from all three FL-HTS patients. (C) The average distance from a leaf to the first split node/fork (DLFSN-avg) of tumor and non-tumor clones of the three FL-HTS patients, FL-S and healthy GC samples. (D) DLFSN-avg of tumor and non-tumor clones in each sample in each of the three FL-HTS patients. *p-value < 0.05; **p-value < 0.005.

References

    1. Gribben JG. How I treat indolent lymphoma. Blood (2007) 109:4617–26. doi: 10.1182/blood-2006-10-041863 - DOI - PubMed
    1. Montoto S, Davies AJ, Matthews J, Calaminici M, Norton AJ, Amess J, et al. . Risk and clinical implications of transformation of follicular lymphoma to diffuse large b-cell lymphoma. J Clin Oncol (2007) 25:2426–33. doi: 10.1200/JCO.2006.09.3260 - DOI - PubMed
    1. Lossos IS, Gascoyne RD. Transformation of follicular lymphoma. Best Pr Res Clin Haematol (2011) 24:147–63. doi: 10.1016/j.beha.2011.02.006 - DOI - PMC - PubMed
    1. Pasqualucci L, Khiabanian H, Fangazio M, Vasishtha M, Messina M, Holmes AB, et al. . Genetics of follicular lymphoma transformation. Cell Rep (2014) 6:130–40. doi: 10.1016/j.celrep.2013.12.027 - DOI - PMC - PubMed
    1. Carlotti E, Wrench D, Matthews J, Iqbal S, Davies A, Norton A, et al. . Transformation of follicular lymphoma to diffuse large b-cell lymphoma may occur by divergent evolution from a common progenitor cell or by direct evolution from the follicular lymphoma clone. Blood (2009) 113:3553–7. doi: 10.1182/blood-2008-08-174839 - DOI - PubMed

LinkOut - more resources