

Developing and validating a prognostic nomogram for ovarian clear cell carcinoma patients: A retrospective comparison of lymph node staging schemes with competing risk analysis
- PMID: 36439411
- PMCID: PMC9682100
- DOI: 10.3389/fonc.2022.940601
Developing and validating a prognostic nomogram for ovarian clear cell carcinoma patients: A retrospective comparison of lymph node staging schemes with competing risk analysis
Abstract
Purpose: Lymph node (LN) involvement is a key factor in ovarian clear cell carcinoma (OCCC) although, there several indicators can be used to define prognosis. This study examines the prognostic performances of each indicator for OCCC patients by comparing the number of lymph nodes examined (TNLE), the number of positive lymph nodes (PLN), lymph node ratio (LNR), and log odds of metastatic lymph nodes (LODDS).
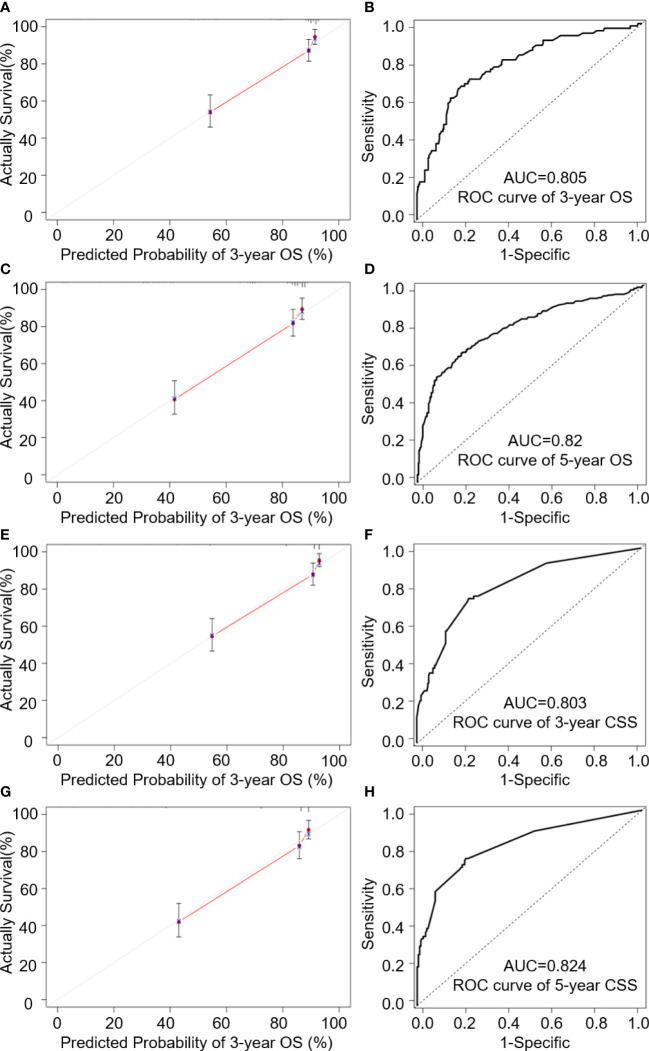
Methods: 1,300 OCCC patients who underwent lymphadenectomy between 2004 and 2015 were extracted from the Surveillance Epidemiology and End Results (SEER) database. Primary outcomes were Overall Survival (OS) and the cumulative incidence of Cancer-Specific Survival (CSS). Kaplan-Meier's and Fine-Gray's tests were implemented to assess OS and CSS rates. After conducting multivariate analysis, nomograms using OS and CSS were constructed based upon an improved LN system. Each nomograms' performance was assessed using Receiver Operating Characteristics (ROC) curves, calibration curves, and the C-index which were compared to traditional cancer staging systems.
Results: Multivariate Cox's regression analysis was used to assess prognostic factors for OS, including age, T stage, M stage, SEER stage, and LODDS. To account for the CSS endpoint, a proportional subdistribution hazard model was implemented which suggested that the T stage, M stage, SEER stage, and LNR are all significant. This enabled us to develop a LODDS-based nomogram for OS and a LNR-based nomogram for CSS. C-indexes for both the OS and CSS nomograms were higher than the traditional American Joint Committee on Cancer (AJCC), 8th edition, staging system. Area Under the Curve (AUC) values for predicting 3- and 5-year OS and CSS between nomograms also highlighted an improvement upon the AJCC staging system. Calibration curves also performed with consistency, which was verified using a validation cohort.
Conclusions: LODDS and LNR may be better predictors than N stage, TNLE, and PLNs. For OCCC patients, both the LODDS-based and LNR-based nomograms performed better than the AJCC staging system at predicting OS and CSS. However, further large sample, real-world studies are necessary to validate the assertion.
Keywords: competing risk model; lymph node staging; nomogram; ovarian clear cell carcinoma; prognosis.
Copyright © 2022 Li, Xiu, Ma, Seery, Lou, Li, Wu, Liang, Wu and Cui.
Conflict of interest statement
The authors declare that the research was conducted in the absence of any commercial or financial relationships that could be construed as a potential conflict of interest.
Figures


Similar articles
-
Construction and validation of log odds of positive lymph nodes (LODDS)-based nomograms for predicting overall survival and cancer-specific survival in ovarian clear cell carcinoma patients.Front Oncol. 2024 Mar 21;14:1370272. doi: 10.3389/fonc.2024.1370272. eCollection 2024. Front Oncol. 2024. PMID: 38577328 Free PMC article.
-
Prognostic nomogram based on the lymph node metastasis indicators for patients with bladder cancer: A SEER population-based study and external validation.Cancer Med. 2023 Mar;12(6):6853-6866. doi: 10.1002/cam4.5475. Epub 2022 Dec 7. Cancer Med. 2023. PMID: 36479835 Free PMC article. Clinical Trial.
-
Establishment of a nomogram model for predicting distant metastasis in pancreatic ductal adenocarcinoma: a comparative analysis of different lymph node staging systems based on the SEER database.Sci Rep. 2024 Aug 5;14(1):18136. doi: 10.1038/s41598-024-69126-8. Sci Rep. 2024. PMID: 39103506 Free PMC article.
-
Construction and Validation of a Nomogram Based on the Log Odds of Positive Lymph Nodes to Predict the Prognosis of Medullary Thyroid Carcinoma After Surgery.Ann Surg Oncol. 2021 Aug;28(8):4360-4370. doi: 10.1245/s10434-020-09567-3. Epub 2021 Jan 19. Ann Surg Oncol. 2021. PMID: 33469797
-
Dynamic nomograms combining N classification with ratio-based nodal classifications to predict long-term survival for patients with lung adenocarcinoma after surgery: a SEER population-based study.BMC Cancer. 2021 Aug 4;21(1):653. doi: 10.1186/s12885-021-08410-6. BMC Cancer. 2021. PMID: 34344326 Free PMC article.
Cited by
-
Exploration and prognostic analysis of two types of high-risk ovarian cancers: clear cell vs. serous carcinoma: a population-based study.J Ovarian Res. 2024 Jun 1;17(1):119. doi: 10.1186/s13048-024-01435-y. J Ovarian Res. 2024. PMID: 38824600 Free PMC article.
-
Log odds of positive lymph nodes (LODDS)-based novel nomogram for survival estimation in patients with invasive micropapillary carcinoma of the breast.BMC Med Res Methodol. 2024 Apr 18;24(1):90. doi: 10.1186/s12874-024-02218-1. BMC Med Res Methodol. 2024. PMID: 38637725 Free PMC article.
References
LinkOut - more resources
Full Text Sources