

Disrupted gut microbiota aggravates working memory dysfunction induced by high-altitude exposure in mice
- PMID: 36439863
- PMCID: PMC9684180
- DOI: 10.3389/fmicb.2022.1054504
Disrupted gut microbiota aggravates working memory dysfunction induced by high-altitude exposure in mice
Abstract
Background: The widely accepted microbiome-gut-brain axis (MGBA) hypothesis may be essential for explaining the impact of high-altitude exposure on the human body, especially brain function. However, studies on this topic are limited, and the underlying mechanism remains unclear. Therefore, this study aimed to determine whether high-altitude-induced working memory dysfunction could be exacerbated with gut microbiota disruption.
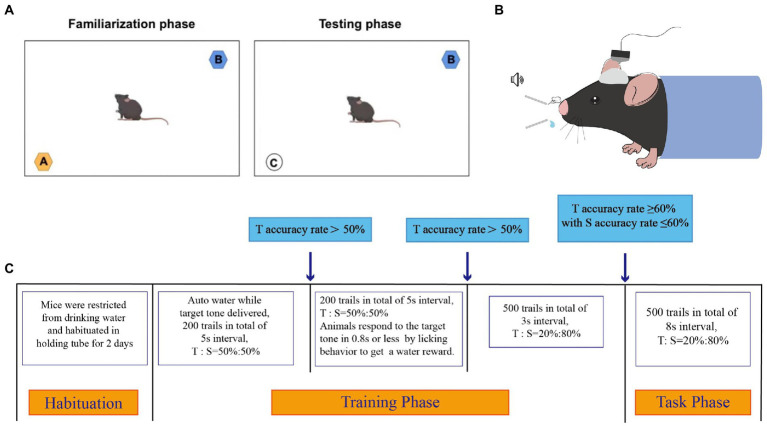
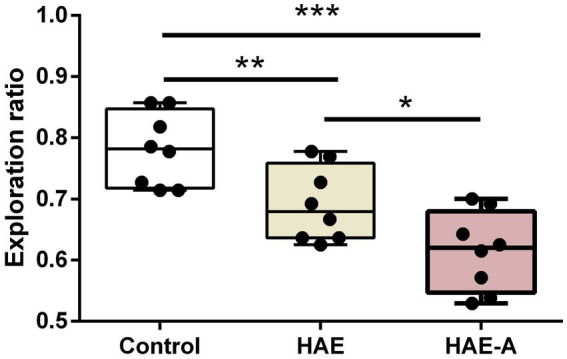
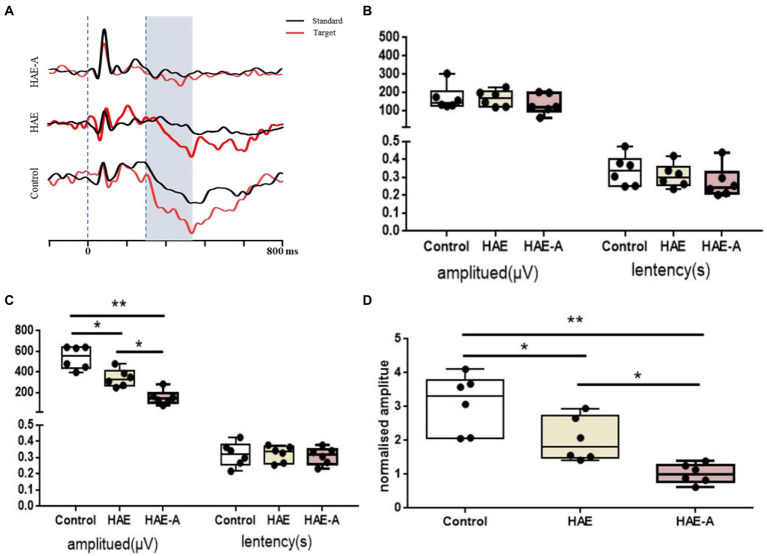
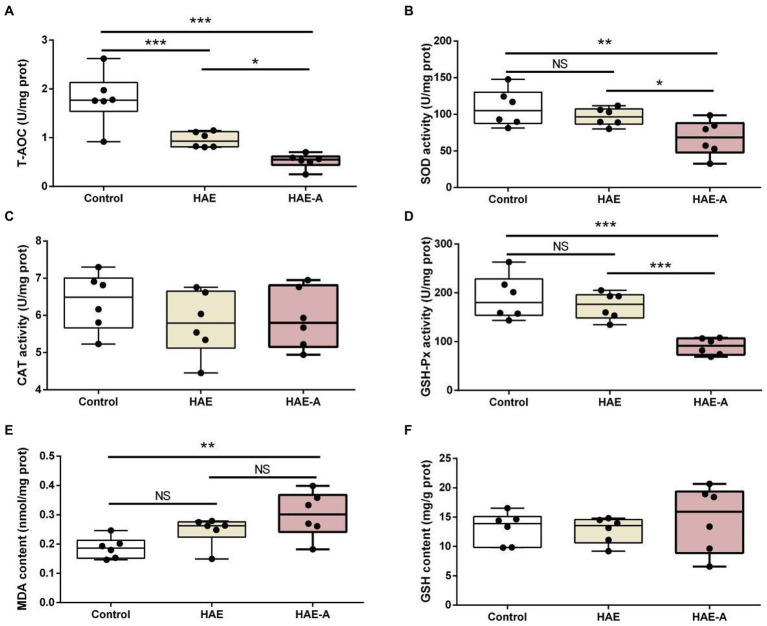
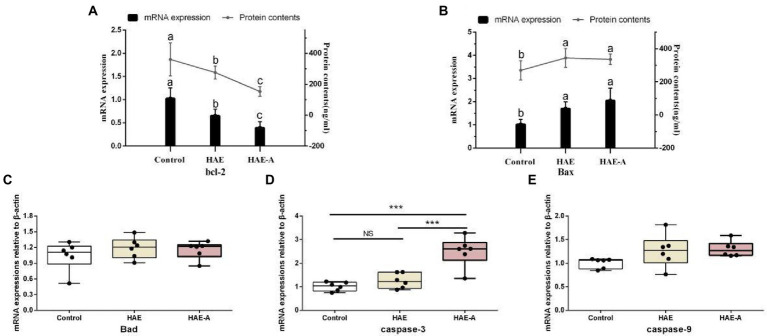
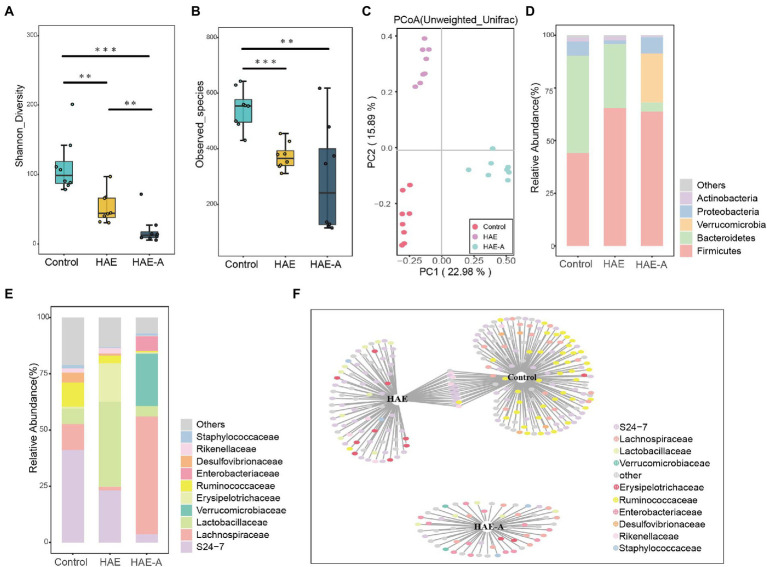
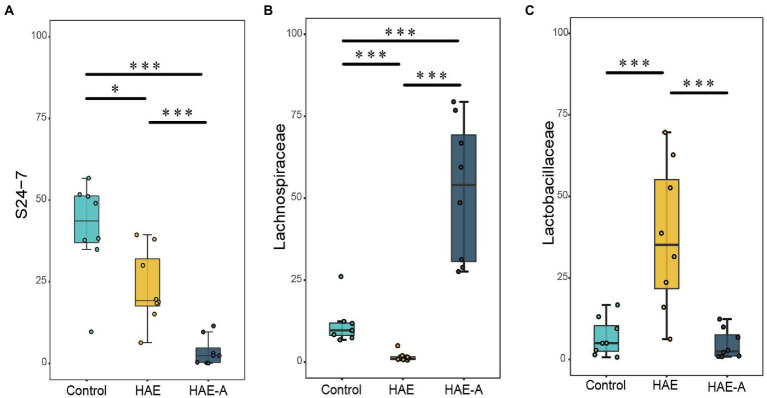
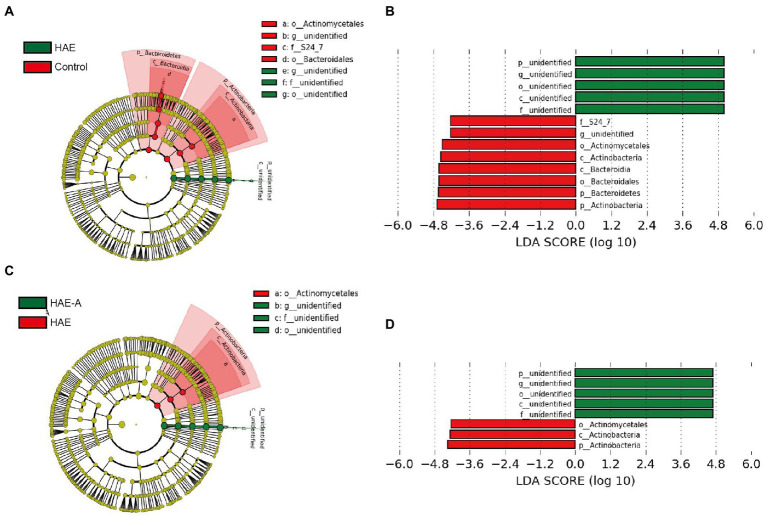
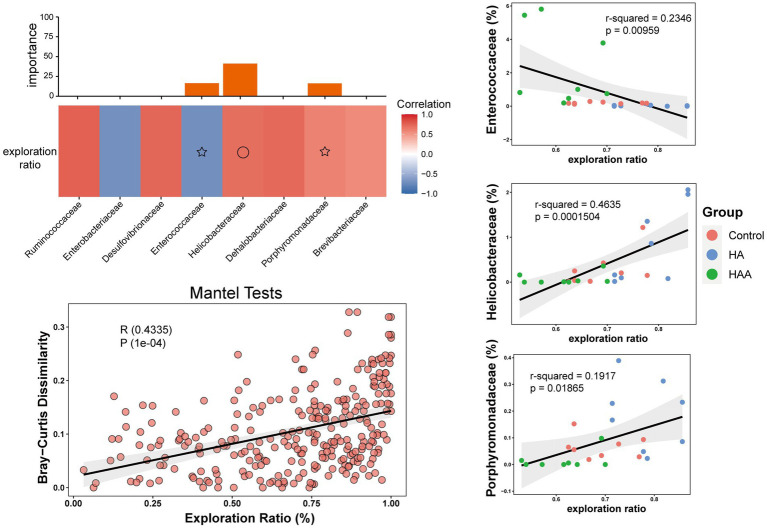
Methods and results: C57BL/6 mice were randomly divided into three groups: control, high-altitude exposed (HAE), and high-altitude exposed with antibiotic treatment (HAE-A). The HAE and HAE-A groups were exposed to a low-pressure oxygen chamber (60-65 kPa) simulating the altitude of 3,500-4,000 m for 14 days, The air pressure level for the control group was maintained at 94.5 kPa. Antibiotic water (mixed with 0.2 g/L of ciprofloxacin and 1 g/L of metronidazole) was provided to the HAE-A group. Based on the results of the novel object test and P300 in the oddball behavioral paradigm training test, working memory dysfunction was aggravated by antibiotic treatment. We determined the antioxidant capacity in the prefrontal cortex and found a significant negative influence (p < 0.05) of disturbed gut microbiota on the total antioxidant capacity (T-AOC) and malondialdehyde (MDA) content, as well as the activities of superoxide dismutase (SOD) and glutathione peroxidase (GSH-Px). The same trend was also observed in the apoptosis-related functional protein content and mRNA expression levels in the prefrontal cortex, especially the levels of bcl-2, Bax, and caspase-3. The high-altitude environment and antibiotic treatment substantially affected the richness and diversity of the colonic microbiota and reorganized the composition and structure of the microbial community. S24-7, Lachnospiraceae, and Lactobacillaceae were the three microbial taxa with the most pronounced differences under the stimulation by external factors in this study. In addition, correlation analysis between colonic microbiota and cognitive function in mice demonstrated that Helicobacteraceae may be closely related to behavioral results.
Conclusion: Disrupted gut microbiota could aggravate working memory dysfunction induced by high-altitude exposure in mice, indicating the existence of a link between high-altitude exposure and MGBA.
Keywords: antibiotics; gut microbe; gut-brain axis; high altitude; probiotic.
Copyright © 2022 Zhao, Cui, Wu, Ren, Zhu, Xie, Zhang, Yang, Peng, Lai, Huang and Li.
Conflict of interest statement
The authors declare that the research was conducted in the absence of any commercial or financial relationships that could be construed as a potential conflict of interest.
Figures
Similar articles
-
Disrupted gut microbiota aggravates spatial memory dysfunction induced by high altitude exposure: A link between plateau environment and microbiome-gut-brain axis.Ecotoxicol Environ Saf. 2023 Jul 1;259:115035. doi: 10.1016/j.ecoenv.2023.115035. Epub 2023 May 23. Ecotoxicol Environ Saf. 2023. PMID: 37224779
-
Lactobacillus johnsonii HL79 modulates the microbiota-gut-brain axis to protect cognitive function in mice chronically exposed to high altitude.Front Microbiol. 2025 Mar 7;16:1561400. doi: 10.3389/fmicb.2025.1561400. eCollection 2025. Front Microbiol. 2025. PMID: 40124891 Free PMC article.
-
Gut microbiota imbalance mediates intestinal barrier damage in high-altitude exposed mice.FEBS J. 2022 Aug;289(16):4850-4868. doi: 10.1111/febs.16409. Epub 2022 Mar 21. FEBS J. 2022. PMID: 35188712
-
Exposed to Mercury-Induced Oxidative Stress, Changes of Intestinal Microflora, and Association between them in Mice.Biol Trace Elem Res. 2021 May;199(5):1900-1907. doi: 10.1007/s12011-020-02300-x. Epub 2020 Jul 30. Biol Trace Elem Res. 2021. PMID: 32734533 Review.
-
Dietary glycation compounds - implications for human health.Crit Rev Toxicol. 2024 Sep;54(8):485-617. doi: 10.1080/10408444.2024.2362985. Epub 2024 Aug 16. Crit Rev Toxicol. 2024. PMID: 39150724
Cited by
-
Research on the correlation between gut microbiota and brain cognitive function under chronic hypoxia at high altitude.Front Neurosci. 2025 Jun 19;19:1600069. doi: 10.3389/fnins.2025.1600069. eCollection 2025. Front Neurosci. 2025. PMID: 40613089 Free PMC article.
-
Neuroprotective Effects of Moderate Hypoxia: A Systematic Review.Brain Sci. 2023 Nov 27;13(12):1648. doi: 10.3390/brainsci13121648. Brain Sci. 2023. PMID: 38137096 Free PMC article. Review.
-
Muscone Ameliorates High-Altitude Hypoxia Gastrointestinal Stress via Modulation of Lactobacillus Murinus and Mitochondrial Metabolism.J Inflamm Res. 2025 May 26;18:6683-6701. doi: 10.2147/JIR.S521991. eCollection 2025. J Inflamm Res. 2025. PMID: 40453964 Free PMC article.
-
Lactobacillus johnsonii HL79 mitigate plateau environment-induced hippocampal dysfunction in mice.AMB Express. 2025 Jun 19;15(1):96. doi: 10.1186/s13568-025-01898-2. AMB Express. 2025. PMID: 40536601 Free PMC article.
-
Gut microbiota's role in high-altitude cognitive impairment: the therapeutic potential of Clostridium sp. supplementation.Sci China Life Sci. 2025 Apr;68(4):1132-1148. doi: 10.1007/s11427-024-2779-9. Epub 2024 Dec 18. Sci China Life Sci. 2025. PMID: 39704932
References
-
- Bravo J. A., Forsythe P., Chew M. V., Escaravage E., Savignac H. M., Dinan T. G., et al. . (2011). Ingestion of lactobacillus strain regulates emotional behavior and central GABA receptor expression in a mouse via the vagus nerve. Proc. Natl. Acad. Sci. U. S. A. 108, 16050–16055. doi: 10.1073/pnas.1102999108, PMID: - DOI - PMC - PubMed
LinkOut - more resources
Full Text Sources
Research Materials
Miscellaneous