

First Trimester Plasma MicroRNA Levels Predict Risk of Developing Gestational Diabetes Mellitus
- PMID: 36440215
- PMCID: PMC9693764
- DOI: 10.3389/fendo.2022.928508
First Trimester Plasma MicroRNA Levels Predict Risk of Developing Gestational Diabetes Mellitus
Abstract
Aims: Our objective is to identify first-trimester plasmatic miRNAs associated with and predictive of GDM.
Methods: We quantified miRNA using next-generation sequencing in discovery (Gen3G: n = 443/GDM = 56) and replication (3D: n = 139/GDM = 76) cohorts. We have diagnosed GDM using a 75-g oral glucose tolerance test and the IADPSG criteria. We applied stepwise logistic regression analysis among replicated miRNAs to build prediction models.
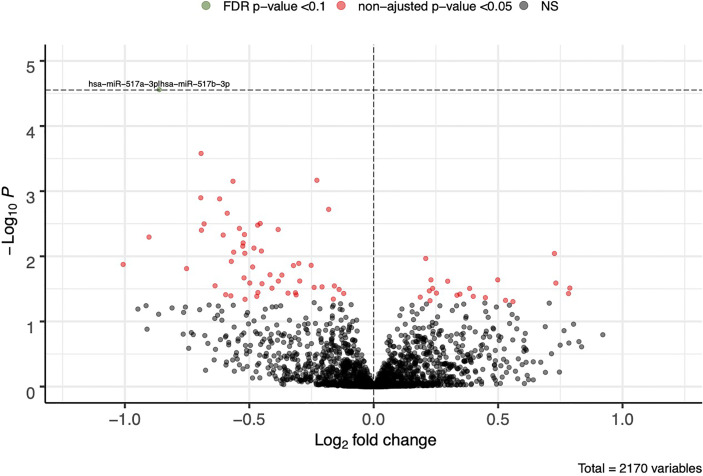
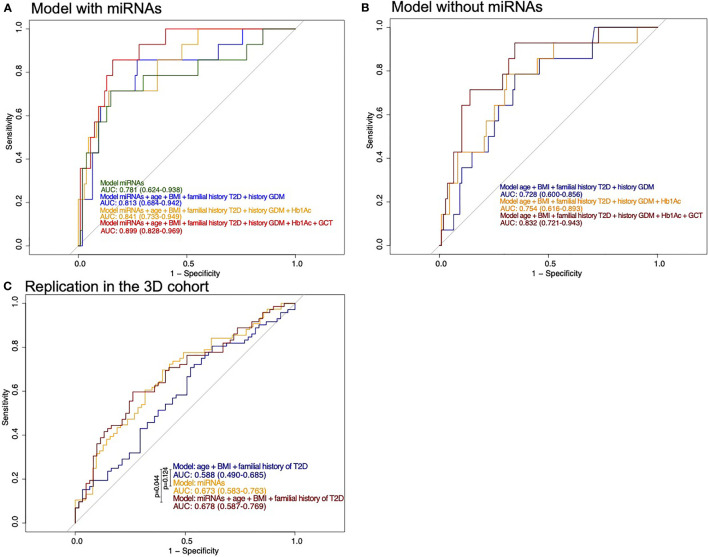
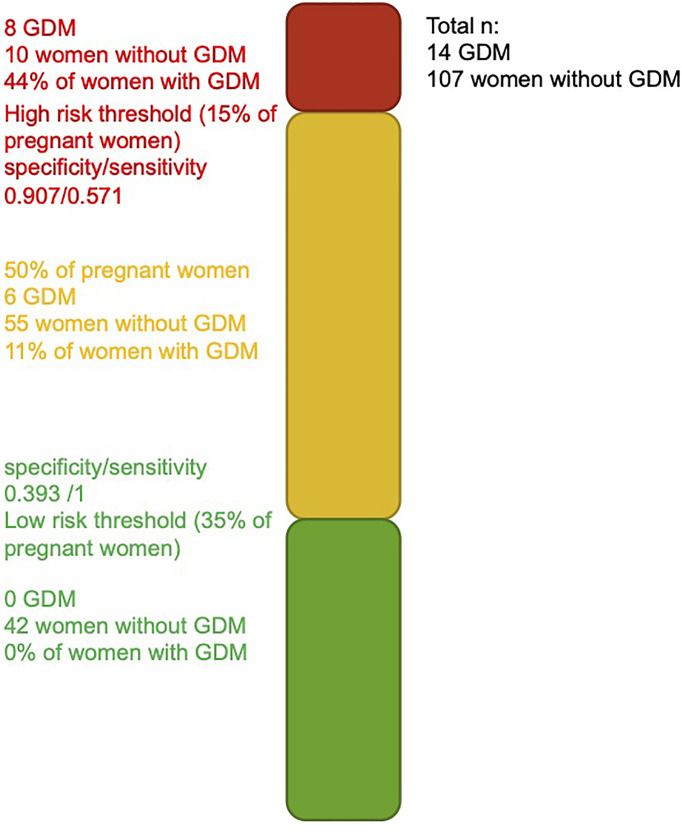
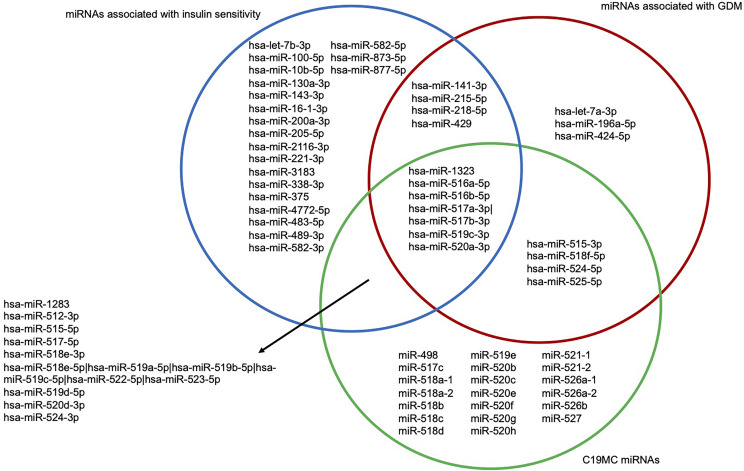
Results: We identified 17 miRNAs associated with GDM development in both cohorts. The prediction performance of hsa-miR-517a-3p|hsa-miR-517b-3p, hsa-miR-218-5p, and hsa-let7a-3p was slightly better than GDM classic risk factors (age, BMI, familial history of type 2 diabetes, history of GDM or macrosomia, and HbA1c) (AUC 0.78 vs. 0.75). MiRNAs and GDM classic risk factors together further improved the prediction values [AUC 0.84 (95% CI 0.73-0.94)]. These results were replicated in 3D, although weaker predictive values were obtained. We suggest very low and higher risk GDM thresholds, which could be used to identify women who could do without a diagnostic test for GDM and women most likely to benefit from an early GDM prevention program.
Conclusions: In summary, three miRNAs combined with classic GDM risk factors provide excellent prediction values, potentially strong enough to improve early detection and prevention of GDM.
Keywords: biomarkers; epigenetics; next-generation sequencing; pregnancy; ribo-hormones; risk factors.
Copyright © 2022 Légaré, Desgagné, Thibeault, White, Clément, Poirier, Luo, Scott, Jacques, Perron, Guérin, Hivert and Bouchard.
Conflict of interest statement
The authors declare that the research was conducted in the absence of any commercial or financial relationships that could be construed as a potential conflict of interest.
Figures
Similar articles
-
First trimester circulating miR-208b-3p and miR-26a-1-3p are relevant to the prediction of gestational hypertension.BMC Pregnancy Childbirth. 2025 Mar 8;25(1):255. doi: 10.1186/s12884-025-07349-x. BMC Pregnancy Childbirth. 2025. PMID: 40057749 Free PMC article.
-
Cardiovascular Disease-Associated MicroRNAs as Novel Biomarkers of First-Trimester Screening for Gestational Diabetes Mellitus in the Absence of Other Pregnancy-Related Complications.Int J Mol Sci. 2022 Sep 13;23(18):10635. doi: 10.3390/ijms231810635. Int J Mol Sci. 2022. PMID: 36142536 Free PMC article.
-
miRNAs as Predictive Factors in Early Diagnosis of Gestational Diabetes Mellitus.Front Endocrinol (Lausanne). 2022 Mar 7;13:839344. doi: 10.3389/fendo.2022.839344. eCollection 2022. Front Endocrinol (Lausanne). 2022. PMID: 35340328 Free PMC article.
-
Circulating microRNAs associated with gestational diabetes mellitus: useful biomarkers?J Endocrinol. 2022 Dec 13;256(1):e220170. doi: 10.1530/JOE-22-0170. Print 2023 Jan 1. J Endocrinol. 2022. PMID: 36346274 Review.
-
Screening and diagnosing gestational diabetes mellitus.Evid Rep Technol Assess (Full Rep). 2012 Oct;(210):1-327. Evid Rep Technol Assess (Full Rep). 2012. PMID: 24423035 Free PMC article. Review.
Cited by
-
Cohort profile: the Genetics of Glucose regulation in Gestation and Growth (Gen3G) - a prospective prebirth cohort of mother-child pairs in Sherbrooke, Canada, 3-year and 5-year follow-up visits.BMJ Open. 2025 Mar 22;15(3):e093434. doi: 10.1136/bmjopen-2024-093434. BMJ Open. 2025. PMID: 40122564 Free PMC article.
-
First trimester circulating miR-208b-3p and miR-26a-1-3p are relevant to the prediction of gestational hypertension.BMC Pregnancy Childbirth. 2025 Mar 8;25(1):255. doi: 10.1186/s12884-025-07349-x. BMC Pregnancy Childbirth. 2025. PMID: 40057749 Free PMC article.
-
Genetics and Epigenetics: Implications for the Life Course of Gestational Diabetes.Int J Mol Sci. 2023 Mar 23;24(7):6047. doi: 10.3390/ijms24076047. Int J Mol Sci. 2023. PMID: 37047019 Free PMC article. Review.
-
Maternal Body Mass Index Is Associated with Profile Variation in Circulating MicroRNAs at First Trimester of Pregnancy.Biomedicines. 2022 Jul 18;10(7):1726. doi: 10.3390/biomedicines10071726. Biomedicines. 2022. PMID: 35885031 Free PMC article.
-
Circulating MicroRNAs Associated with Changes in the Placenta and Their Possible Role in the Fetus During Gestational Diabetes Mellitus: A Review.Metabolites. 2025 Jun 3;15(6):367. doi: 10.3390/metabo15060367. Metabolites. 2025. PMID: 40559391 Free PMC article. Review.
References
Publication types
MeSH terms
Substances
LinkOut - more resources
Full Text Sources
Medical
Molecular Biology Databases