Construction and validation of an immune-related genes prognostic index (IRGPI) model in colon cancer
- PMID: 36440228
- PMCID: PMC9682206
- DOI: 10.3389/fendo.2022.963382
Construction and validation of an immune-related genes prognostic index (IRGPI) model in colon cancer
Abstract
Background: Though immunotherapy has become one of the standard therapies for colon cancer, the overall effective rate of immunotherapy is very low. Constructing an immune-related genes prognostic index (IRGPI) model may help to predict the response to immunotherapy and clinical outcomes.
Methods: Differentially expressed immune-related genes (DEIRGs) between normal tissues and colon cancer tissues were identified and used to construct the co-expression network. Genes in the module with the most significant differences were further analyzed. Independent prognostic immune-related genes (IRGs) were identified by univariate and multivariate cox regression analysis. Independent prognostic IRGs were used to construct the IRGPI model using the multivariate cox proportional hazards regression model, and the IRGPI model was validated by independent dataset. ROC curves were plotted and AUCs were calculated to estimate the predictive power of the IRGPI model to prognosis. Gene set enrichment analysis (GSEA) was performed to screen the enriched KEGG pathways in the high-risk and low-risk phenotype. Correlations between IRGPI and clinical characteristic, immune checkpoint expression, TMB, immune cell infiltration, immune function, immune dysfunction, immune exclusion, immune subtype were analyzed.
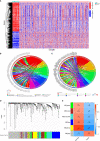
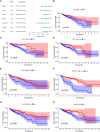
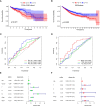
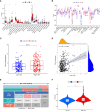
Results: Totally 680 DEIRGs were identified. Three independent IRGs,NR5A2, PPARGC1A and LGALS4, were independently related to survival. NR5A2, PPARGC1A and LGALS4 were used to establish the IRGPI model. Survival analysis showed that patients with high-risk showed worse survival than patients in the low-risk group. The AUC of the IRGPI model for 1-year, 3-year and 5-year were 0.584, 0.608 and 0.697, respectively. Univariate analysis and multivariate cox regression analysis indicated that IRGPI were independent prognostic factors for survival. Stratified survival analysis showed that patients with IRGPI low-risk and low TMB had the best survival, which suggested that combination of TMB and IRGPI can better predict clinical outcome. Immune cell infiltration, immune function, immune checkpoint expression and immune exclusion were different between IRGPI high-risk and low-risk patients.
Conclusion: An immune-related genes prognostic index (IRGPI) was constructed and validated in the current study and the IRGPI maybe a potential biomarker for evaluating response to immunotherapy and clinical outcome for colon cancer patients.
Keywords: biomarker; colon cancer; immune cells; prognostic model; tumor microenvironment (TME).
Copyright © 2022 Jin, Deng, Luo, Zhong and Yu.
Conflict of interest statement
The authors declare that the research was conducted in the absence of any commercial or financial relationships that could be construed as a potential conflict of interest.
Figures

Similar articles
-
A bioinformatics-based immune-related prognostic index for lung adenocarcinoma that predicts patient response to immunotherapy and common treatments.J Thorac Dis. 2022 Jun;14(6):2131-2146. doi: 10.21037/jtd-22-494. J Thorac Dis. 2022. PMID: 35813746 Free PMC article.
-
Immune-related gene-based prognostic index for predicting survival and immunotherapy outcomes in colorectal carcinoma.Front Immunol. 2022 Dec 13;13:944286. doi: 10.3389/fimmu.2022.944286. eCollection 2022. Front Immunol. 2022. PMID: 36591255 Free PMC article.
-
Identification of a Novel Immune Landscape Signature for Predicting Prognosis and Response of Colon Cancer to Immunotherapy.Front Immunol. 2022 Apr 28;13:802665. doi: 10.3389/fimmu.2022.802665. eCollection 2022. Front Immunol. 2022. PMID: 35572595 Free PMC article.
-
Development and validation of an immune-related gene prognostic index for lung adenocarcinoma.J Thorac Dis. 2023 Nov 30;15(11):6205-6227. doi: 10.21037/jtd-23-1374. Epub 2023 Nov 24. J Thorac Dis. 2023. PMID: 38090291 Free PMC article.
-
Constructing and validating a risk model based on neutrophil-related genes for evaluating prognosis and guiding immunotherapy in colon cancer.J Gene Med. 2024 Apr;26(4):e3684. doi: 10.1002/jgm.3684. J Gene Med. 2024. PMID: 38618694 Review.
Cited by
-
Role of Protein Regulators of Cholesterol Homeostasis in Immune Modulation and Cancer Pathophysiology.Endocrinology. 2025 Feb 27;166(4):bqaf031. doi: 10.1210/endocr/bqaf031. Endocrinology. 2025. PMID: 39951497 Review.
References
MeSH terms
Substances
LinkOut - more resources
Full Text Sources

