. 2022 Nov 22;12(11):e9526.
doi: 10.1002/ece3.9526. eCollection 2022 Nov.

Variety in responses of wintering oystercatchers Haematopus ostralegus to near-collapse of their prey in the Exe Estuary, UK

Affiliations

Variety in responses of wintering oystercatchers Haematopus ostralegus to near-collapse of their prey in the Exe Estuary, UK

Joanne M Morten et al. Ecol Evol. .

Abstract

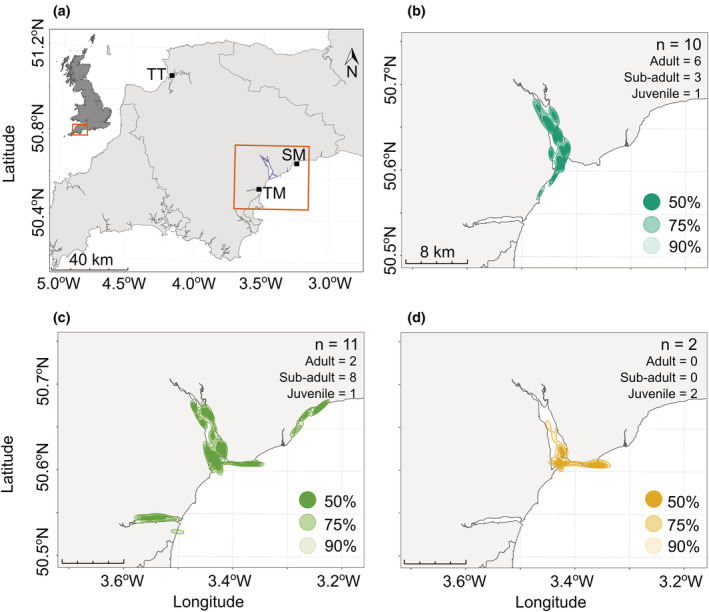
Globally, habitat loss or degradation is a major threat to many species, and those with specific habitat requirements are particularly vulnerable. Many species of wading birds (Charadrii) are dependent upon intertidal sites to feed, but, as a result of anthropogenic pressures, the prey landscape has changed at many estuaries. Behavioral adaptations may be able to buffer these changes. In this study over multiple seasons, we aimed to investigate the foraging behaviors of wintering Eurasian oystercatchers in the Exe Estuary where mussel beds, the preferred prey at this site, have almost disappeared in the last decade. From 2018 to 2021, GPS tracking devices were deployed on 24 oystercatchers, and the foraging locations of adults, sub-adults, and juveniles were determined. Of the 12 birds tracked over multiple winter periods, 10 used the same foraging home ranges but a juvenile and sub-adult changed locations interannually. The dominant prey species at key foraging sites were assessed, and we found that younger birds were more likely to visit sites with lower quality prey, likely due to being at a competitive disadvantage, and also to explore sites further away. Individuals were generally consistent in the areas of the estuary used in early and late winter, and over 90% of locations were recorded in the protected area boundary, which covers the sand and mudflats of the Exe. These findings suggest high specificity of the current protected area for oystercatchers in the Exe Estuary, although, if the prey landscape continues to decline, younger individuals may provide the potential for adaptation by finding and foraging at additional sites. Continued monitoring of individual behavior within populations that are facing dramatic changes to their prey is essential to understand how they may adapt and to develop suitable management plans to conserve threatened species.

Keywords: Eurasian oystercatcher; Haematopus ostralegus; biologging; foraging behavior; home range; shorebirds.


Figures

FIGURE 1
FIGURE 1
The study site location (a) and autocorrelated kernel density estimations (AKDEs) of oystercatchers tracked (b–d) during three overwinter periods (winter 1: November 2018 – March 2019, winter 2: August 2019 – March 2020, winter 3: August 2020 – March 2021). (a) The Exe Estuary Special Protection Area (SPA) is outlined within the orange box, and the locations of two neighboring sites (Teignmouth (TM) and Sidmouth (SM)), which were visited by the tracked oystercatchers, are labeled. A third site, the Taw Torridge (TT), where future oystercatcher tracking studies could include, is also labeled. The 50%, 75% and 90% AKDEs of the birds tracked during winter one (b), two (c), and three (d) are shown, with only the first winter of tracking data analyzed in cases where multiple years of data were collected for the same individual. The sample sizes indicate the total number of oystercatchers from which location data were used to estimate kernel size, and the distribution of age class is also shown.
FIGURE 2
FIGURE 2
The daily activity of oystercatchers tracked during three winter periods (2018–2021) in the Exe Estuary, UK. The distances traveled per day, per 2‐h time period, and throughout the tidal cycle are shown for all tracked individuals (n = 23; a–c), and also for adults, sub‐adults, and juveniles only (n = 8, d–f; n = 11, g–I; n = 4, j–l, respectively). (a, d, g, j) histograms show the mean total distance traveled per day. (b, e, h, k) circular bar plots of the mean distances traveled during two‐hourly time windows. The pale grey polygons indicate the period between sunset and sunrise, and dark grey polygons indicate when tracking devices were switched off to conserve battery power. (c, f, I, l) The mean distances traveled 1–3 h before high (“H ‐“) and low (“L ‐“) tides and after high (“H +”) and low (“L +”) tides.
FIGURE 3
FIGURE 3
Density plots of the (a) mass, (b) head and bill length, and (c) wing length of all oystercatchers captured between February 2018 and October 2020. The different age classes are shown by the different colors (adult = orange, sub‐adult = grey, and juvenile = pink). Dashed lines show the mean biometric value of captured oystercatchers in these age classes. A subset of 24 oystercatchers were GPS tracked and the relationship between the (d) mass, (e) head and bill length, and (f) wing length and the mean distance traveled over a 2‐h period during the winter months (14th August until 1st March) are plotted. The three different bill types (B = blunt, C = chiseled, R = rounded) are represented by different shapes.
FIGURE 4
FIGURE 4
The 75% autocorrelated kernel density estimations (AKDE) for eight (of twelve) oystercatchers with location data collected for two or more winters.
FIGURE 5
FIGURE 5
Oystercatcher foraging behavior and the composition and distribution of their prey in the Exe Estuary, UK. Foraging behaviors were observed at field (a, n = 3) and estuarine (b, n = 5) sites. Pies show the proportion of each prey type consumed at each site, and the total number of foraging observations per site is shown at the centre of each pie. Prey samples were collected at key field and estuarine sites (pink, n = 9, (a) and green, n = 18, (b) circles, respectively), which were selected by field observations and tracking locations. (c) The mean wet mass of prey species per 0.5 m2 quadrat sampled at each site with standard error bars. (d) Boxplots compare the number of prey consumed (N) and the approximated calorie content (kcal) in the field and estuary habitats during 5‐min foraging observations.

References

    1. Agostinelli, C. , & Lund, U. (2017). R package 'circular': Circular statistics (version version 0.4‐93) . https://r‐forge.r‐project.org/projects/circular/
    1. Baker, A. J. (1974). Criteria for aging and sexing New Zealand oystercatchers. New Zealand Journal of Marine and Freshwater Research, 8(1), 211–221. 10.1080/00288330.1974.9515497 - DOI
    1. Bakker, W. , Ens, B. J. , Dokter, A. , van der Kolk, H.‐J. , Rappoldt, K. , van de Pol, M. , Troostf, K. , van der Veer AI Bijleveld, H. W. , der Meer, J. , Oosterbeek, K. , Jongejans, E. , & Allen, A. M. (2021). Connecting foraging and roosting areas reveals how food stocks explain shorebird numbers. Estuarine, Coastal and Shelf Science, 259, 107458. 10.1016/j.ecss.2021.107458 - DOI
    1. Beukema, J. J. , Dekker, R. , & Jansen, J. M. (2009). Some like it cold: Populations of the tellinid bivalve Macoma balthica (L.) suffer in various ways from a warming climate. Marine Ecology Progress Series, 384, 135–145.
    1. BirdLife International . (2019). Haematopus ostralegus. The IUCN Red List of Threatened Species 2019: e.T22693613A154998347.

LinkOut - more resources