

Community phylogeny and spatial scale affect phylogenetic diversity metrics in a species-rich rainforest in Borneo
- PMID: 36440315
- PMCID: PMC9682210
- DOI: 10.1002/ece3.9536
Community phylogeny and spatial scale affect phylogenetic diversity metrics in a species-rich rainforest in Borneo
Abstract
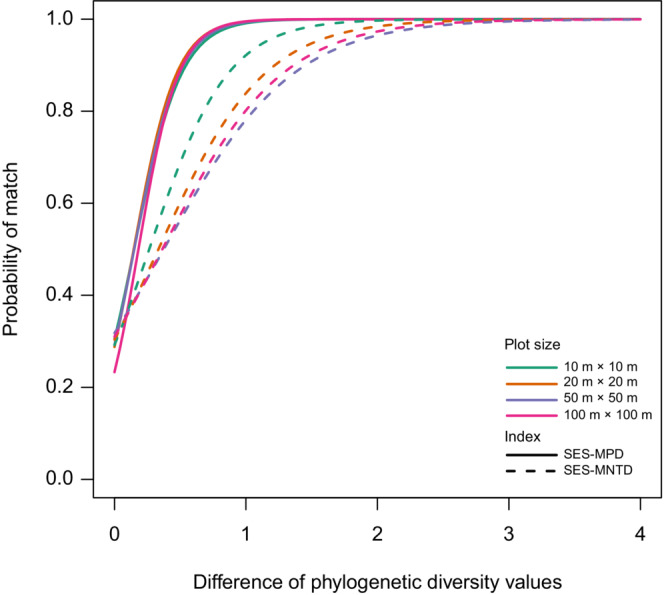
Community phylogenetic analysis is an effective approach to understanding the process of community formation. The phylogenetic tree of the species pool is reconstructed in the first step, and the phylogenetic tree obtained in the second step is used to analyze phylogenetic diversity. Sythetic trees have often been used in the construction of phylogenentic trees; however, in tropical rainforests with many closely related species, synthetic trees contain many unresolved nodes, which may affect the results of phylogenetic structure analysis. Here, we constructed a phylogenetic tree using DNA barcode sequences (rbcL, matK, trnH-psbA) for 737 tree species from the rainforests of Borneo, which have a high-species diversity and many closely related species. The phylogenetic tree had fewer polytomies and more branch length variations than the Phylocom synthetic trees. Comparison of community phylogenetic analyses indicated that values of the standardized effect size of mean pairwise distance (SES-MPD) were highly correlated between Phylocom and DNA barcode trees, but less so for the standardized effect size of mean nearest taxon distance (SES-MNTD), suggesting that caution is needed when using synthetic trees for communities containing many congeneric species, especially when using SES-MNTD. Simulation analysis suggested that spatial dependence on phylogenetic diversity is related to the phylogenetic signal of the species' habitat niche and the spatial structure of habitat, indicating the importance of detailed phylogeny in understanding community assembly processes.
Keywords: DNA barcoding; South‐East Asia; community phylogeny; tropical rainforest.
© 2022 The Authors. Ecology and Evolution published by John Wiley & Sons Ltd.
Conflict of interest statement
The authors declare no conflicts of interest.
Figures


Similar articles
-
Comparative evolutionary diversity and phylogenetic structure across multiple forest dynamics plots: a mega-phylogeny approach.Front Genet. 2014 Nov 5;5:358. doi: 10.3389/fgene.2014.00358. eCollection 2014. Front Genet. 2014. PMID: 25414723 Free PMC article.
-
Plastome-based phylogeny improves community phylogenetics of subtropical forests in China.Mol Ecol Resour. 2022 Jan;22(1):319-333. doi: 10.1111/1755-0998.13462. Epub 2021 Jul 18. Mol Ecol Resour. 2022. PMID: 34233085
-
Plant DNA barcodes and assessment of phylogenetic community structure of a tropical mixed dipterocarp forest in Brunei Darussalam (Borneo).PLoS One. 2017 Oct 19;12(10):e0185861. doi: 10.1371/journal.pone.0185861. eCollection 2017. PLoS One. 2017. PMID: 29049301 Free PMC article.
-
Distribution and Community Assembly of Trees Along an Andean Elevational Gradient.Plants (Basel). 2019 Sep 5;8(9):326. doi: 10.3390/plants8090326. Plants (Basel). 2019. PMID: 31491875 Free PMC article.
-
[Functional diversity characteristics of canopy tree species of Jianfengling tropical montane rainforest on Hainan Island, China.].Ying Yong Sheng Tai Xue Bao. 2016 Nov 18;27(11):3444-3454. doi: 10.13287/j.1001-9332.201611.037. Ying Yong Sheng Tai Xue Bao. 2016. PMID: 29696840 Chinese.
References
-
- Angiosperm Phylogeny Group , Chase, M. W. , Christenhusz, M. J. , Fay, M. F. , Byng, J. W. , Judd, W. S. , Soltis, D. E. , Mabberley, D. J. , Sennikov, A. N. , Soltis, P. S. , & Stevens, P. F. (2016). An update of the angiosperm phylogeny group classification for the orders and families of flowering plants: APG IV. Botanical Journal of the Linnean Society, 181(1), 1–20.
-
- Baldeck, C. A. , Kembel, S. W. , Harms, K. E. , Yavitt, J. B. , John, R. , Turner, B. L. , Chuyong, G. B. , Kenfack, D. , Thomas, D. W. , Madawala, S. , Gunatilleke, N. , Gunatilleke, S. , Bunyavejchewin, S. , Kiratiprayoon, S. , Yaacob, A. , Nur Supardi, M. N. , Valencia, R. , Navarrete, H. , Davies, S. J. , … Dalling, J. W. (2013). A taxonomic comparison of local habitat niches of tropical trees. Oecologia, 173(4), 1491–1498. 10.1007/s00442-013-2709-5 - DOI - PubMed
-
- Baraloto, C. , Hardy, O. J. , Paine, C. E. T. , Dexter, K. G. , Cruaud, C. , Dunning, L. T. , Gonzalez, M. A. , Molino, J. F. , Sabatier, D. , Savolainen, V. , & Chave, J. (2012). Using functional traits and phylogenetic trees to examine the assembly of tropical tree communities. Journal of Ecology, 100(3), 690–701. 10.1111/j.1365-2745.2012.01966.x - DOI
-
- Becker, R. A. , & Wilks, A. R. (1993). Maps in S. AT&T Bell Laboratories Statistics Research Report [93.2].
-
- Becker, R. A. , & Wilks, A. R. (1995). Constructing a geographical database. AT&T Bell Laboratories Statistics Research Report [95.2].
LinkOut - more resources
Full Text Sources
Miscellaneous
