

Inhibition of dopamine receptor D1 signaling promotes human bile duct cancer progression via WNT signaling
- PMID: 36441110
- PMCID: PMC10067401
- DOI: 10.1111/cas.15676
Inhibition of dopamine receptor D1 signaling promotes human bile duct cancer progression via WNT signaling
Abstract
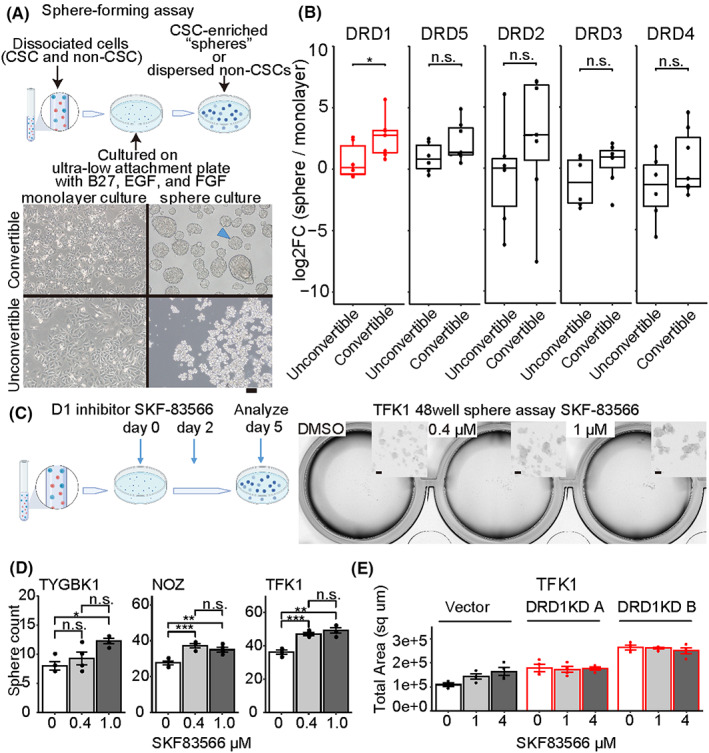
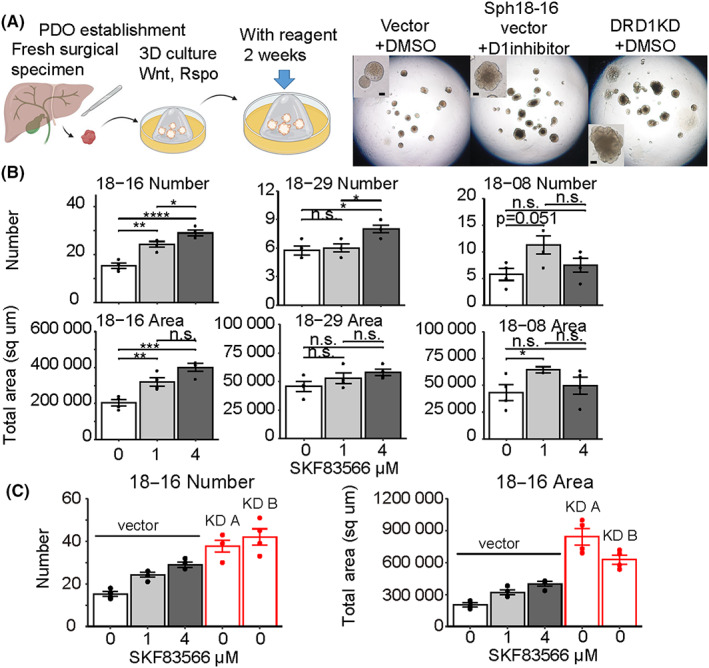
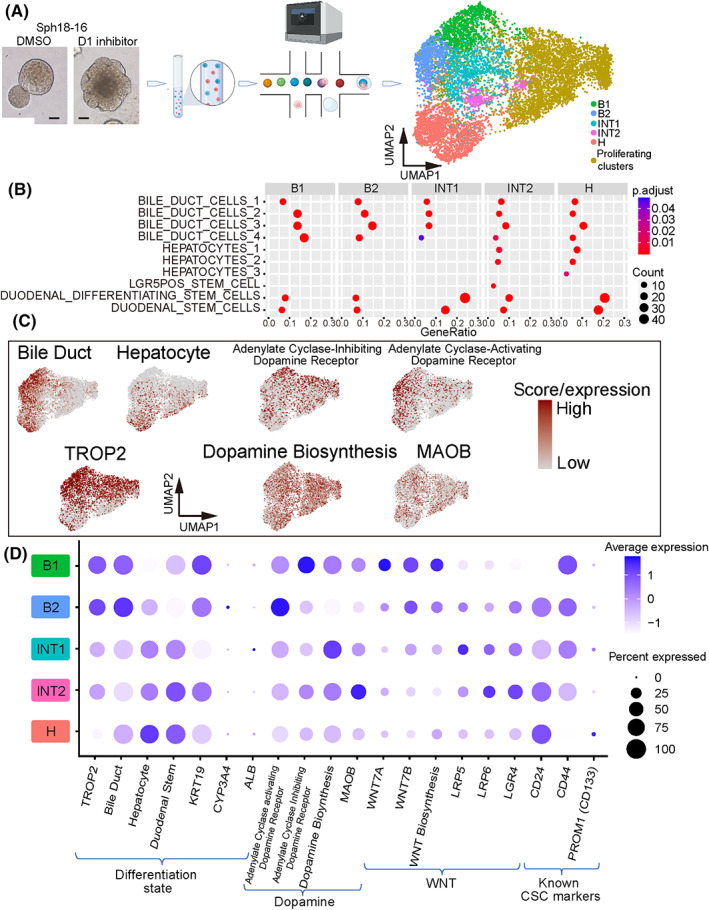
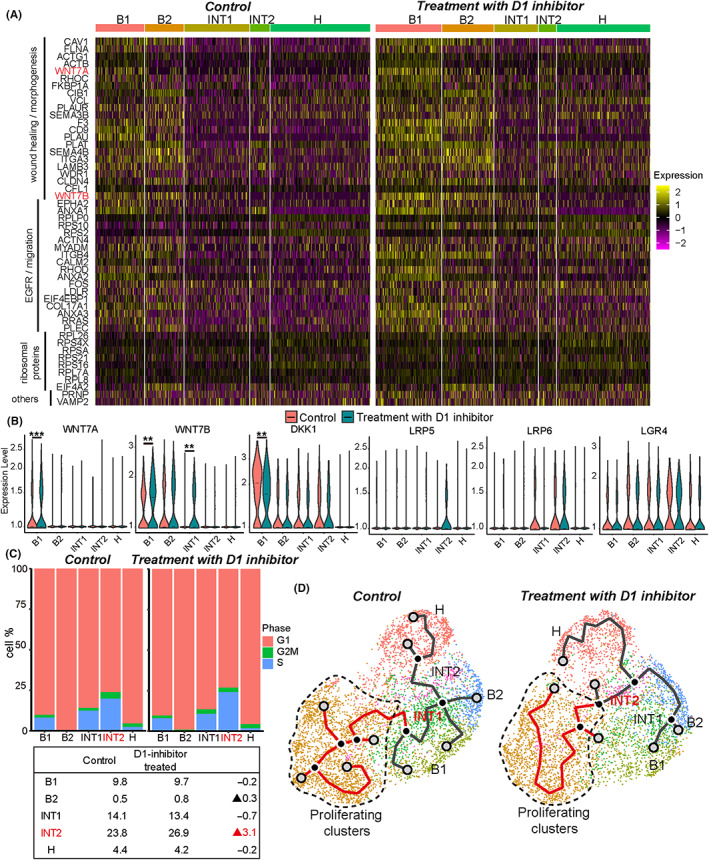
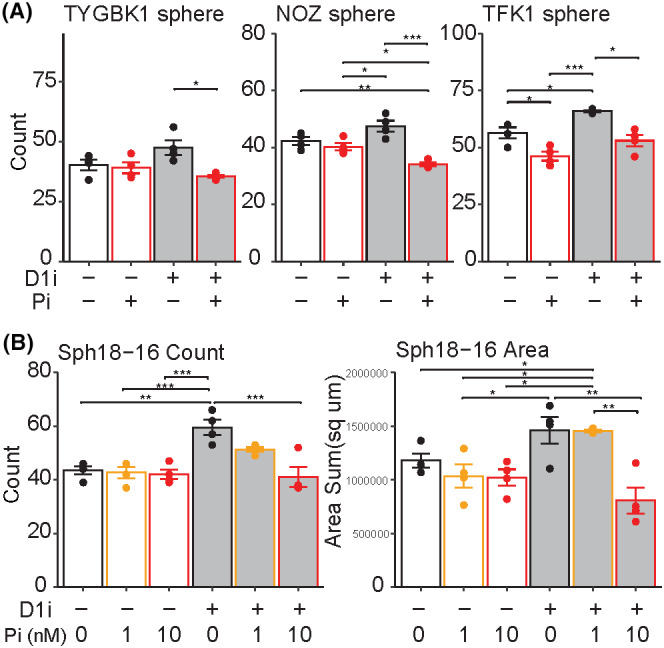
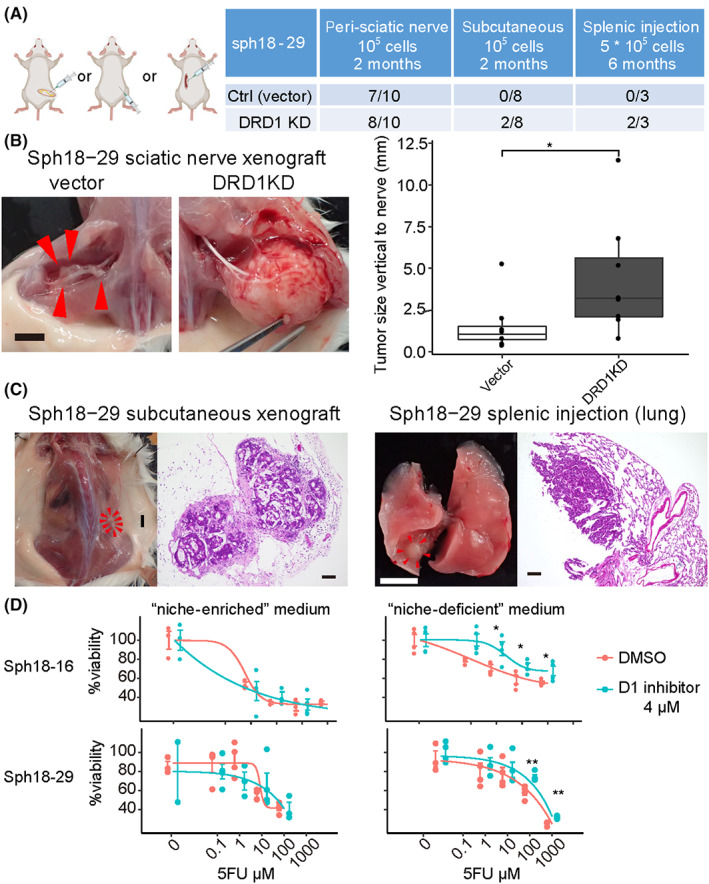
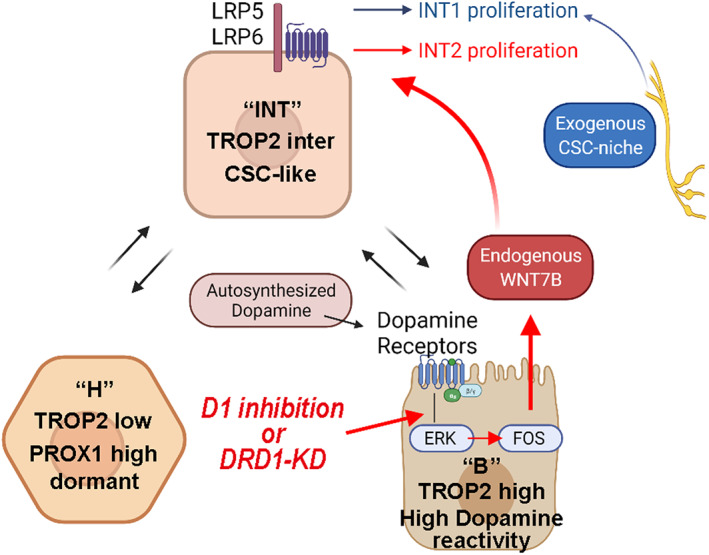
Bile duct cancer (BDC) frequently invades the nerve fibers, making complete surgical resection difficult. A single tumor mass contains cells of variable malignancy and cell-differentiation states, with cancer stem cells (CSCs) considered responsible for poor clinical outcomes. This study aimed to investigate the contribution of autosynthesized dopamine to CSC-related properties in BDC. Sphere formation assays using 13 commercially available BDC cell lines demonstrated that blocking dopamine receptor D1 (DRD1) signaling promoted CSC-related anchorage-independent growth. Additionally, we newly established four new BDC patient-derived organoids (PDOs) and found that blocking DRD1 increased resistance to chemotherapy and enabled xenotransplantation in vivo. Single-cell analysis revealed that the BDC PDO cells varied in their cell-differentiation states and responses to dopamine signaling. Further, DRD1 inhibition increased WNT7B expression in cells with bile duct-like phenotype, and it induced proliferation of other cell types expressing Wnt receptors and stem cell-like signatures. Reagents that inhibited Wnt function canceled the effect of DRD1 inhibition and reduced cell proliferation in BDC PDOs. In summary, in BDCs, DRD1 is a crucial protein involved in autonomous CSC proliferation through the regulation of endogenous WNT7B. As such, inhibition of the DRD1 feedback signaling may be a potential treatment strategy for BDC.
Keywords: bile duct cancer; cancer stem cells; dopamine D1 receptors; organoids; single-cell analysis.
© 2022 The Authors. Cancer Science published by John Wiley & Sons Australia, Ltd on behalf of Japanese Cancer Association.
Conflict of interest statement
TM and ST received partial support from Sumitomo Pharma. SW and RI are employees of Sumitomo Pharma. SO and HS are editorial board members of
Figures
Similar articles
-
Increased dopamine and its receptor dopamine receptor D1 promote tumor growth in human hepatocellular carcinoma.Cancer Commun (Lond). 2020 Dec;40(12):694-710. doi: 10.1002/cac2.12103. Epub 2020 Oct 5. Cancer Commun (Lond). 2020. PMID: 33017522 Free PMC article.
-
β-Arrestin 2 and Epac2 Cooperatively Mediate DRD1-Stimulated Proliferation of Human Neural Stem Cells and Growth of Human Cerebral Organoids.Stem Cells. 2022 Sep 26;40(9):857-869. doi: 10.1093/stmcls/sxac046. Stem Cells. 2022. PMID: 35772103
-
Constitutive activity of a G protein-coupled receptor, DRD1, contributes to human cerebral organoid formation.Stem Cells. 2020 May;38(5):653-665. doi: 10.1002/stem.3156. Epub 2020 Feb 18. Stem Cells. 2020. PMID: 32052915 Free PMC article.
-
Bile duct cyst as precursor to biliary tract cancer.Ann Surg Oncol. 2007 Mar;14(3):1200-11. doi: 10.1245/s10434-006-9294-3. Epub 2006 Dec 23. Ann Surg Oncol. 2007. PMID: 17187167 Review.
-
Roles of Wnt Target Genes in the Journey of Cancer Stem Cells.Int J Mol Sci. 2017 Jul 25;18(8):1604. doi: 10.3390/ijms18081604. Int J Mol Sci. 2017. PMID: 28757546 Free PMC article. Review.
Cited by
-
DRD1 suppresses cell proliferation and reduces EGFR activation and PD-L1 expression in NSCLC.Mol Oncol. 2024 Jun;18(6):1631-1648. doi: 10.1002/1878-0261.13608. Epub 2024 Apr 4. Mol Oncol. 2024. PMID: 38572507 Free PMC article.
-
Periampullary cancer and neurological interactions: current understanding and future research directions.Front Oncol. 2024 Mar 19;14:1370111. doi: 10.3389/fonc.2024.1370111. eCollection 2024. Front Oncol. 2024. PMID: 38567163 Free PMC article. Review.
-
Research progress on the roles of dopamine and dopamine receptors in digestive system diseases.J Cell Mol Med. 2024 Apr;28(7):e18154. doi: 10.1111/jcmm.18154. J Cell Mol Med. 2024. PMID: 38494840 Free PMC article. Review.
-
Exploring Key Biomarkers and Common Pathogenesis of Seven Digestive System Cancers and Their Correlation with COVID-19.Curr Issues Mol Biol. 2023 Jun 30;45(7):5515-5533. doi: 10.3390/cimb45070349. Curr Issues Mol Biol. 2023. PMID: 37504265 Free PMC article.
References
MeSH terms
Substances
Grants and funding
LinkOut - more resources
Full Text Sources
Medical
Research Materials
