. 2023 Mar;60(3):1281-1296.
doi: 10.1007/s12035-022-03112-x. Epub 2022 Nov 28.

A Push-Pull Mechanism Between PRRT2 and β4-subunit Differentially Regulates Membrane Exposure and Biophysical Properties of NaV1.2 Sodium Channels

Affiliations

A Push-Pull Mechanism Between PRRT2 and β4-subunit Differentially Regulates Membrane Exposure and Biophysical Properties of NaV1.2 Sodium Channels

Pierluigi Valente et al. Mol Neurobiol. 2023 Mar.

Abstract

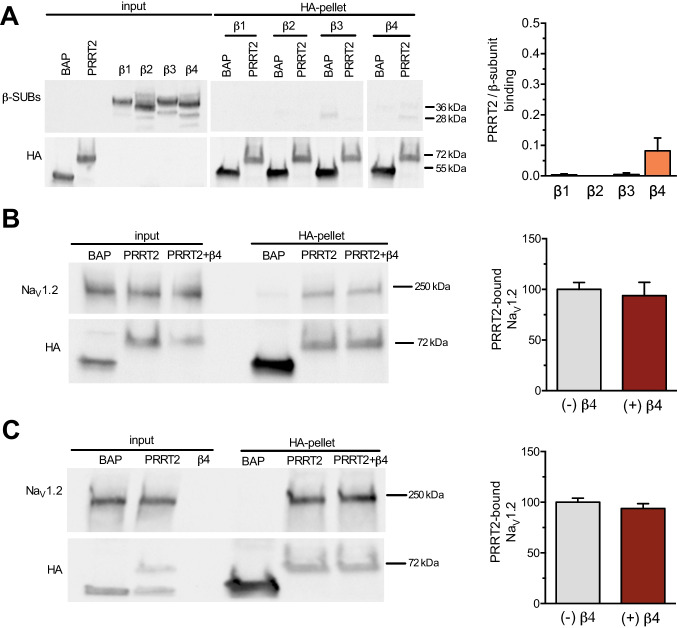
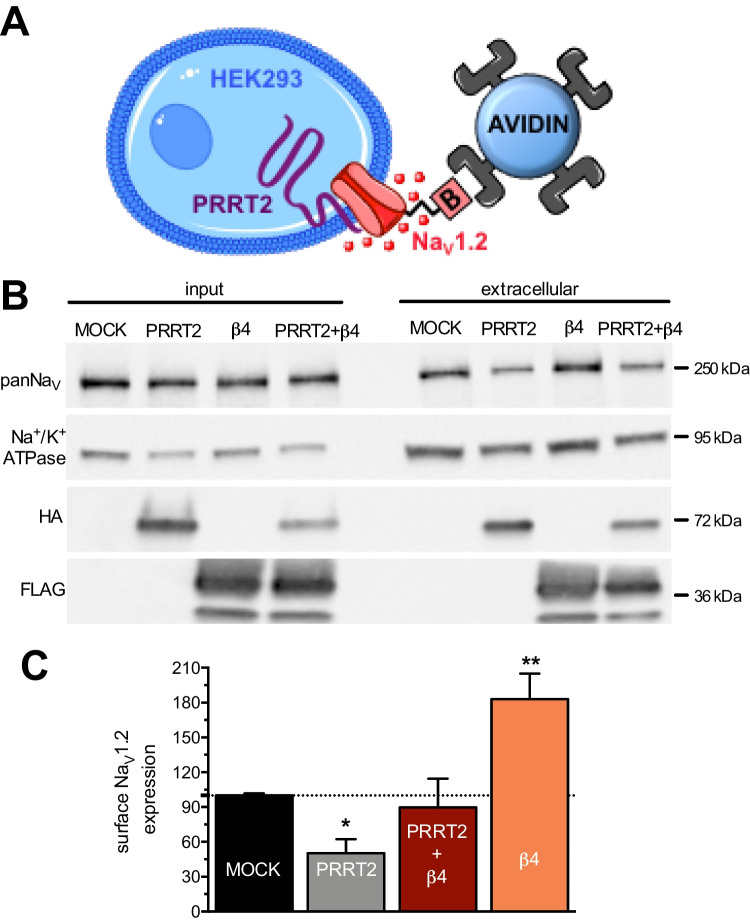
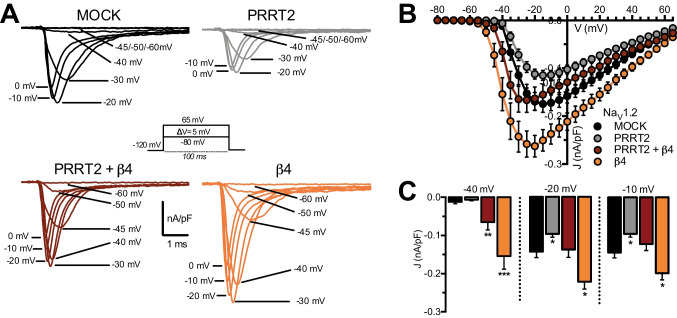
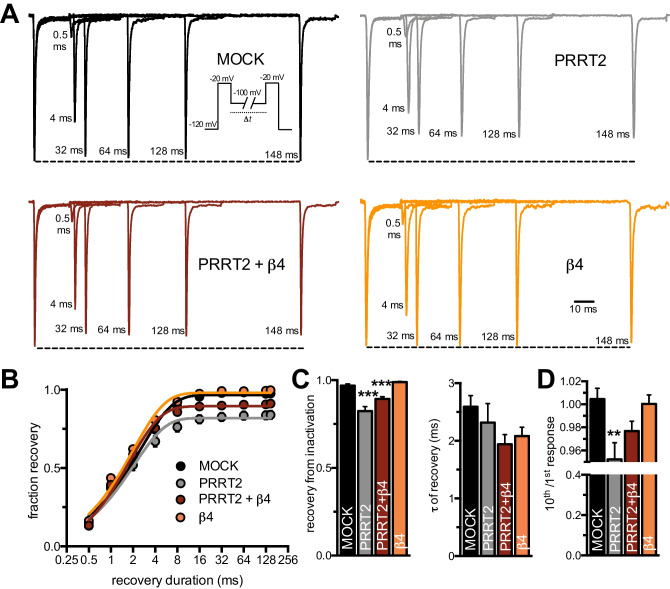
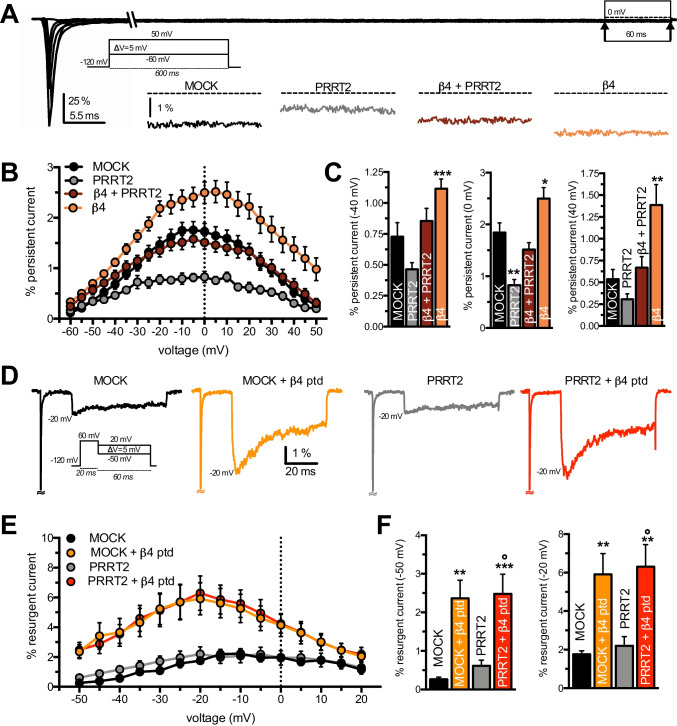
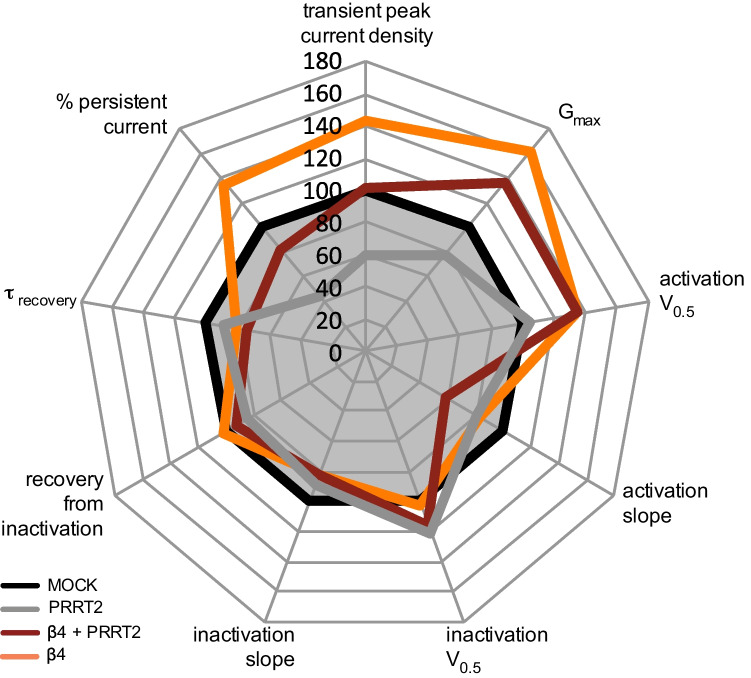
Proline-rich transmembrane protein 2 (PRRT2) is a neuron-specific protein implicated in the control of neurotransmitter release and neural network stability. Accordingly, PRRT2 loss-of-function mutations associate with pleiotropic paroxysmal neurological disorders, including paroxysmal kinesigenic dyskinesia, episodic ataxia, benign familial infantile seizures, and hemiplegic migraine. PRRT2 is a negative modulator of the membrane exposure and biophysical properties of Na+ channels NaV1.2/NaV1.6 predominantly expressed in brain glutamatergic neurons. NaV channels form complexes with β-subunits that facilitate the membrane targeting and the activation of the α-subunits. The opposite effects of PRRT2 and β-subunits on NaV channels raises the question of whether PRRT2 and β-subunits interact or compete for common binding sites on the α-subunit, generating Na+ channel complexes with distinct functional properties. Using a heterologous expression system, we have observed that β-subunits and PRRT2 do not interact with each other and act as independent non-competitive modulators of NaV1.2 channel trafficking and biophysical properties. PRRT2 antagonizes the β4-induced increase in expression and functional activation of the transient and persistent NaV1.2 currents, without affecting resurgent current. The data indicate that β4-subunit and PRRT2 form a push-pull system that finely tunes the membrane expression and function of NaV channels and the intrinsic neuronal excitability.

Keywords: Intrinsic excitability; Persistent Na+ current; Proline-rich transmembrane protein 2; Resurgent Na+ current; Transient Na+ current.


Conflict of interest statement

The authors declare no competing interests.

Figures

Fig. 1
Fig. 1
PRRT2 and the NaV β4-subunit do not interact or compete for binding to NaV1.2. A Left: representative immunoblot of co-immunoprecipitation of β1/β4-subunits by PRRT2. HA-tagged PRRT2 (PRRT2), bacterial alkaline phosphatase (BAP), and FLAG-tagged β1/β4-subunits were expressed in wild-type HEK293 cells. Cell lysates (INPUT, 10 µg protein) and samples immunoprecipitated by anti-HA beads (HA-pellet) were analyzed by western blotting with anti-FLAG and anti-HA antibodies. The representative blots were cut from the same gel. Right: quantification of the FLAG immunoreactive signal in PRRT2 immunoprecipitates normalized to the control BAP values. Means ± sem of n = 3 independent experiments. B Left: representative immunoblot of co-immunoprecipitation of PRRT2 and NaV1.2 from extracts of NaV1.2-expressing stable HEK293 clones transiently transfected with either HA-tagged PRRT2 alone or with HA-PRRT2 + β4 subunit. BAP was used as a control. Cell lysates (INPUT, 10 µg protein) and samples immunoprecipitated by anti-HA beads (HA-pellet) were analyzed by western blotting with anti-panNaV and anti-HA antibodies. Right: quantification of the NaV immunoreactivity in PRRT2 immunoprecipitates expressed as ratios between normalized NaV1.2 and PRRT2 immunoreactivities. Means ± sem of n = 3 independent experiments. C Left: representative immunoblot of co-immunoprecipitation of NaV1.2 by PRRT2 in the presence or absence of an excess of β4-subunit. HA-tagged PRRT2 or BAP was transfected in NaV1.2-expressing HEK293 cells, whereas the β4-subunit (β4) was overexpressed in wild-type HEK293 cells. The extract from the β4-subunit expressing cells was added to the HA-immunoprecipitated PRRT2/Nav 1.2 complex. Cell lysates (INPUT, 10 µg protein) and samples immunoprecipitated by anti-HA beads (HA-pellet) were analyzed by western blotting with anti-panNaV and anti-HA antibodies. Right: quantification of the NaV immunoreactivity in PRRT2 immunoprecipitates normalized to the BAP values. Means ± sem of n = 3 independent experiments.
Fig. 2
Fig. 2
PRRT2 and the NaV β4-subunit have opposite effects on membrane targeting and exposure of NaV1.2 channels. A Schematics of the biotinylation experiment. B Representative immunoblots of cell surface biotinylation performed in HEK293 cells expressing NaV1.2 and transfected with empty vector (MOCK), PRRT2-HA, β4-FLAG, or both. Total lysates (input; left) and biotinylated (cell surface; right) fractions were analyzed by western blotting. Membranes were probed with antibodies to panNaV, HA, FLAG, and Na/K-ATPase (Na/K), with the latter used as marker of cell surface fractions. C The cell surface NaV immunoreactivity is expressed in percent of the control MOCK value after normalization to Na/K-ATPase immunoreactivity. Means ± sem of n = 4 independent experiments. Two-way ANOVA revealed no significant interaction between PRRT2 and β4-subunit (F1,12 = 3.238; p = 0.1). *p < 0.05, **p < 0.01; one-way ANOVA/Fisher’s least significant difference tests versus MOCK
Fig. 3
Fig. 3
PRRT2 and the β4-subunit have opposite effects on the expression of the NaV1.2 transient current. A Representative whole-cell transient Na+ currents recorded in HEK293 cells stably expressing NaV1.2 and transiently transfected with empty vector (MOCK, black), PRRT2 (gray), β4-subunit (orange), or PRRT2 + β4 subunit (dark red). Currents were elicited by a protocol (inset) consisting of 5-mV depolarization steps from − 80 to 65 mV from a holding potential of − 120 mV. For clarity, the first 6 ms of the 100-ms steps for eight representative traces per condition are plotted. BC Current density (J) versus voltage (V) relationship (B) for all the studied experimental conditions. The statistical analysis of J values at three representative voltages (− 40/− 20/− 10 mV) is reported (C). Data are expressed as means ± sem (MOCK, n = 36; PRRT2, n = 22; β4, n = 18; PRRT2 + β4, n = 17). Two-way ANOVA revealed no significant interaction between PRRT2 and β4-subunit on the amplitude of the macroscopic Na+ current (− 40 mV: F1,88 = 0.021; p = 0.88; − 20 mV: F1,90 = 1.2; p = 0.276; − 10 mV: F1,89 = 0,804; p = 0.37). *p < 0.05, **p < 0.01, ***p < 0.001 versus MOCK, Kruskal–Wallis/Dunn’s tests
Fig. 4
Fig. 4
PRRT2 and β4-subunit differentially affect the kinetics of activation and inactivation of NaV1.2 channels. AB Voltage dependence of activation (A) and steady-state inactivation (B) curves fit with a Boltzmann function for all conditions tested. Activation was studied using recordings obtained with the protocol depicted in Fig. 3A. Steady-state inactivation was obtained with a protocol in which the cell under study was held at a series of voltages ranging from − 130 mV to 30 mV for 500 ms followed by a 20-ms step pulse to − 10 mV to measure channel availability using a holding potential of − 120 mV. CD Mean parameters of activation (C) and steady-state inactivation (D) curves fit to data obtained from all condition tested. All data are expressed as means ± sem. Activation: MOCK, n = 36; PRRT2, n = 22; β4, n = 18; PRRT2 + β4, n = 17. Steady-state inactivation: MOCK, n = 44; PRRT2, n = 16; β4, n = 28; PRRT2 + β4, n = 24. No significant differences were found in the activation kinetics between β4-subunit alone and PRRT2 + β4-subunit groups, as well as in the inactivation kinetics between PRRT2 alone and PRRT2 + β4-subunit groups. Two-way ANOVA revealed no significant interaction between PRRT2 and β4-subunit on the analyzed biophysical parameters (activation V0.5: F1,89 = 0.744, p = 0.39; Gmax: F1,89 = 0.645 p = 0.424; inactivation V0.5: F1,108 = 3.57, p = 0.061; inactivation slope: F1,108 = 1.510, p = 0.221). *p < 0.05, **p < 0.01, ***p < 0.001 versus MOCK; one-way ANOVA/Bonferroni’s tests or Kruskal–Wallis/Dunn’s tests
Fig. 5
Fig. 5
PRRT2, but not the β4-subunit, modulates the NaV1.2 recovery kinetics from fast inactivation. A Representative channel recovery from inactivation current traces recorded for all the experimental conditions. Recordings were obtained pre-pulsing cells to − 20 mV for 20 ms to inactivate Na+ currents and then coming back to a recovery potential of − 100 mV for increasing durations before the repetition of test pulse to − 20 mV. For clarity, 6 of the nine time intervals are shown. The dotted line represents the first pulse peak amplitude. B Time courses of the recovery from inactivation of peak currents at − 100 mV for all condition studied are plotted on a semi-logarithmic scale. C Mean (± sem) values of plateau and τ of recovery estimated from one-phase decay fit to the data. D Relationship between the 10th and the 1st test pulse evoked by protocol displayed in A. All data are expressed as means ± sem (MOCK, n = 46; PRRT2, n = 25; PRRT2 + β4, n = 28; β4, n = 29). Two-way ANOVA revealed no significant differences were found between PRRT2 alone and PRRT2 + β4-subunit groups (plateau of recovery: F1,124 = 3.286, p = 0.072; τ of recovery: F1,124 = 0.09, p = 0.764; 10th/1st response: F1,124 = 1.86, p = 0.174). **p < 0.01, ***p < 0.001 versus MOCK; Kruskal–Wallis/Dunn’s tests
Fig. 6
Fig. 6
PRRT2 and β4-subunit independently modulate the NaV1.2 persistent and resurgent currents. A Representative MOCK persistent NaV1.2 currents evoked by depolarizing steps from − 60 to 50 mV with 5-mV increments, lasting 600 ms (inset) in MOCK-transfected NaV1.2-expressing HEK293. For clarity, only currents evoked at − 60, − 40, − 20, 0, 20, and 40 mV are reported. The highlighted box at the end of stimulation indicates the region of the trace in which the persistent current was measured. The insets show zoomed views of the maximal persistent current for all conditions tested. B Persistent current, measured as the mean current in the last 60 ms of each 600 ms step and normalized to the transient current peak, is plotted versus voltage in each cell. C Bar plots of the mean (± sem) values of the normalized persistent current amplitude recorded at three distinct voltages (− 40, 0, and 40 mV) for all tested conditions. Data are expressed as means ± sem (MOCK, n = 24; PRRT2, n = 10; PRRT2 + β4, n = 20; β4, n = 21). D Representative peak resurgent current traces generated by NaV1.2-expressing HEK293 cells either mock-transfected or transfected with PRRT2 recorded in the presence (yellow/red) or absence (black/gray) of the β4 COOH-terminal peptide (β4 ptd) in the intracellular recording solution. Currents were evoked with a family of steps depolarizations from − 120 mV to 30 mV for 20 ms to open the channels, allow them to undergo open-channel block, and subsequently repolarize to a different potential ranging from − 50 mV to 20 mV for 60 ms to allow the blocker to unbind. For clarity, only the peak resurgent current trace for all condition is plotted. E Resurgent currents evoked during repolarization were normalized to peak transient current at each voltage for all experimental conditions. Peak resurgent current was measured for each voltage after 2.5 ms into the repolarization step to bypass fast tail currents. F Bar plots of the mean (± sem) values of the normalized resurgent current amplitude recorded at three distinct voltages at − 20 and − 50 mV for all conditions tested. All data are expressed as means ± sem (MOCK, n = 6; MOCK + β4 ptd, n = 12; PRRT2, n = 6; PRRT2 + β4 ptd, n = 14). Two-way ANOVA revealed no significant interaction between PRRT2 and β4-subunit on the amplitude of both the persistent and the resurgent Na+ currents (persistent at: − 40 mV, F1,71 = 0.002, p = 0.988; 0 mV: F1,71 = 0.00519, p = 0.942; 40 mV, F1,71 = 1.94, p = 0.167; resurgent at: − 50 mV, F1,34 = 0.047, p = 0.828; − 20 mV: F1,34 = 0.00043, p = 0.983). *p < 0.05, **p < 0.01, ***p < 0.001, versus MOCK; one-way ANOVA/Bonferroni or Kruskal–Wallis/Dunn tests
Fig. 7
Fig. 7
Summary of the differential modulation of NaV1.2 channels by PRRT2 and the β4-subunit. Radar plot showing the effects of the single or combined expression of PRRT2 and NaV β4-subunit on NaV1.2 properties. The plot was built with each spoke arranged in such a way that points lying outside the control condition (MOCK plot; black) are indicative of a gain-of-function, while points lying within the MOCK plot indicate a loss-of-function. All parameters are expressed in percent of the MOCK group. Values of transient peak current density were recorded at − 20 mV. The percentage values of persistent current were obtained from recordings performed at 0 mV

References

    1. Ebrahimi-Fakhari D, Saffari A, Westenberger A, Klein C. The evolving spectrum of PRRT2-associated paroxysmal diseases. Brain. 2015;138:3476–3495. doi: 10.1093/brain/awv317. - DOI - PubMed
    1. Heron SE, Dibbens LM. Role of PRRT2 in common paroxysmal neurological disorders: a gene with remarkable pleiotropy. J Med Genet. 2013;50:133–139. doi: 10.1136/jmedgenet-2012-101406. - DOI - PubMed
    1. Valtorta F, Benfenati F, Zara F, Meldolesi J. PRRT2: from paroxysmal disorders to regulation of synaptic function. Trends Neurosci. 2016;39:668–679. doi: 10.1016/j.tins.2016.08.005. - DOI - PubMed
    1. Chen WJ, Lin Y, Xiong ZQ, Wei W, Ni W, Tan GH, Guo SL, He J, et al. Exome sequencing identifies truncating mutations in PRRT2 that cause paroxysmal kinesigenic dyskinesia. Nat Genet. 2011;43:1252–1255. doi: 10.1038/ng.1008. - DOI - PubMed
    1. Lee HY, Huang Y, Bruneau N, Roll P, Roberson ED, Hermann M, Quinn E, Maas J, et al. Mutations in the gene PRRT2 cause paroxysmal kinesigenic dyskinesia with infantile convulsions. Cell Rep. 2012;1:2–12. doi: 10.1016/j.celrep.2011.11.001. - DOI - PMC - PubMed

LinkOut - more resources