

Rotenone causes mitochondrial dysfunction and prevents maturation in porcine oocytes
- PMID: 36441709
- PMCID: PMC9704683
- DOI: 10.1371/journal.pone.0277477
Rotenone causes mitochondrial dysfunction and prevents maturation in porcine oocytes
Abstract
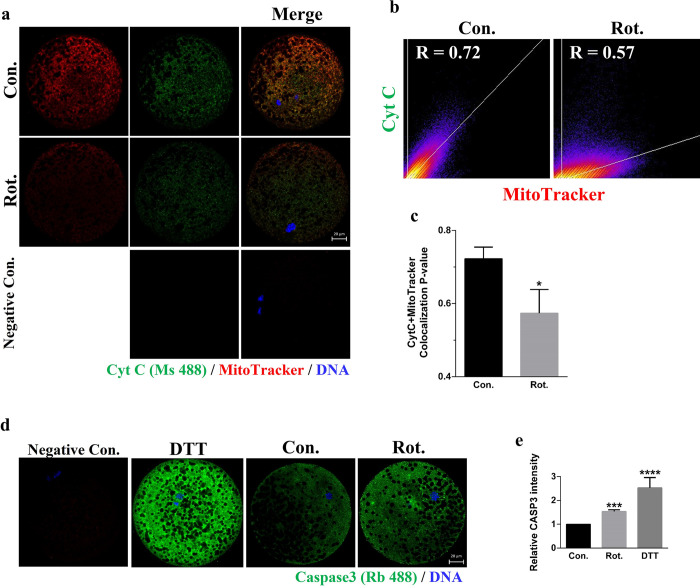
Rotenone is a commonly used insecticidal chemical in agriculture and it is an inhibitor of mitochondrial complex Ⅰ. Previous studies have found that rotenone induces the production of reactive oxygen species (ROS) by inhibiting electron transport in the mitochondria of somatic and germ cells. However, there is little precise information on the effects of rotenone exposure in porcine oocytes during in vitro maturation, and the mechanisms underlying these effects have not been determined. The Cumulus-oocyte complexes were supplemented with different concentrations of rotenone to elucidate the effects of rotenone exposure on the meiotic maturation of porcine oocytes during in vitro maturation for about 48 hours. First, we found that the maturation rate and expansion of cumulus cells were significantly reduced in the 3 and 5 μM rotenone-treated groups. Subsequently, the concentration of rotenone was determined to be 3 μM. Also, immunofluorescence, western blotting, and image quantification analyses were performed to test the rotenone exposure on the meiotic maturation, total and mitochondrial ROS, mitochondrial function and biogenesis, mitophagy and apoptosis in porcine oocytes. Further experiments showed that rotenone treatment induced mitochondrial dysfunction and failure of mitochondrial biogenesis by repressing the level of SIRT1 during in vitro maturation of porcine oocytes. In addition, rotenone treatment reduced the ratio of active mitochondria to total mitochondria, increased ROS production, and decreased ATP production. The levels of LC3 and active-caspase 3 were significantly increased by rotenone treatment, indicating that mitochondrial dysfunction induced by rotenone increased mitophagy but eventually led to apoptosis. Collectively, these results suggest that rotenone interferes with porcine oocyte maturation by inhibiting mitochondrial function.
Copyright: © 2022 Heo et al. This is an open access article distributed under the terms of the Creative Commons Attribution License, which permits unrestricted use, distribution, and reproduction in any medium, provided the original author and source are credited.
Conflict of interest statement
The authors have declared that no competing interests exist.
Figures


Similar articles
-
Exposure of Triclosan in Porcine Oocyte Leads to Superoxide Production and Mitochondrial-Mediated Apoptosis During In Vitro Maturation.Int J Mol Sci. 2020 Apr 26;21(9):3050. doi: 10.3390/ijms21093050. Int J Mol Sci. 2020. PMID: 32357484 Free PMC article.
-
Arsenic exposure during porcine oocyte maturation negatively affects embryonic development by triggering oxidative stress-induced mitochondrial dysfunction and apoptosis.Toxicology. 2022 Oct;480:153314. doi: 10.1016/j.tox.2022.153314. Epub 2022 Sep 7. Toxicology. 2022. PMID: 36084880
-
Melatonin enhances mitochondrial biogenesis and protects against rotenone-induced mitochondrial deficiency in early porcine embryos.J Pineal Res. 2020 Mar;68(2):e12627. doi: 10.1111/jpi.12627. Epub 2019 Dec 18. J Pineal Res. 2020. PMID: 31773776
-
The Molecular Quality and Mitochondrial Activity of Porcine Cumulus-Oocyte Complexes Are Affected by Their Exposure to Three Endocrine-Active Compounds under 3D In Vitro Maturation Conditions.Int J Mol Sci. 2022 Apr 20;23(9):4572. doi: 10.3390/ijms23094572. Int J Mol Sci. 2022. PMID: 35562963 Free PMC article.
-
Regulation of cumulus expansion and hyaluronan synthesis in porcine oocyte-cumulus complexes during in vitro maturation.Endocr Regul. 2012 Oct;46(4):225-35. doi: 10.4149/endo_2012_04_225. Endocr Regul. 2012. PMID: 23127506 Review.
Cited by
-
Monoterpenoid Epoxidiol Ameliorates the Pathological Phenotypes of the Rotenone-Induced Parkinson's Disease Model by Alleviating Mitochondrial Dysfunction.Int J Mol Sci. 2023 Mar 19;24(6):5842. doi: 10.3390/ijms24065842. Int J Mol Sci. 2023. PMID: 36982914 Free PMC article.
-
Box C/D snoRNPs and MDT-15/MED15 regulate mitochondrial surveillance via fatty acid metabolism.bioRxiv [Preprint]. 2025 May 28:2025.05.26.656193. doi: 10.1101/2025.05.26.656193. bioRxiv. 2025. PMID: 40501983 Free PMC article. Preprint.
-
Glucose Starvation Inhibits Ferroptosis by Activating the LKB1/AMPK Signaling Pathway and Promotes the High Speed Linear Motility of Dairy Goat Sperm.Animals (Basel). 2023 Apr 23;13(9):1442. doi: 10.3390/ani13091442. Animals (Basel). 2023. PMID: 37174479 Free PMC article.
-
Impaired mitochondria-initiated crosstalk with lysosomes reciprocally aggravates mitochondrial defect through LManVI.Nat Commun. 2025 Aug 7;16(1):7304. doi: 10.1038/s41467-025-62147-5. Nat Commun. 2025. PMID: 40774949 Free PMC article.
-
Effects of calcium lactate on in vitro fertilization and embryonic development in cattle.Anim Biosci. 2025 Jun;38(6):1150-1159. doi: 10.5713/ab.24.0636. Epub 2024 Nov 6. Anim Biosci. 2025. PMID: 39543994 Free PMC article.
References
-
- Ferreira EM, Vireque AA, Adona PR, Meirelles FV, Ferriani RA, Navarro PA. Cytoplasmic maturation of bovine oocytes: structural and biochemical modifications and acquisition of developmental competence. Theriogenology. 2009;71(5):836–48. Epub 20090103. doi: 10.1016/j.theriogenology.2008.10.023 . - DOI - PubMed
-
- Park HJ, Park SY, Kim JW, Yang SG, Kim MJ, Jegal HG, et al.. Melatonin Improves Oocyte Maturation and Mitochondrial Functions by Reducing Bisphenol A-Derived Superoxide in Porcine Oocytes In Vitro. Int J Mol Sci. 2018;19(11). Epub 20181031. doi: 10.3390/ijms19113422 ; PubMed Central PMCID: PMC6274783. - DOI - PMC - PubMed
Publication types
MeSH terms
Substances
LinkOut - more resources
Full Text Sources
Research Materials
