. 2022 Nov 28;17(11):e0277861.
doi: 10.1371/journal.pone.0277861. eCollection 2022.

Spatial and seasonal variation in macrozoobenthic density, biomass and community composition in a major tropical intertidal area, the Bijagós Archipelago, West-Africa

Affiliations

Spatial and seasonal variation in macrozoobenthic density, biomass and community composition in a major tropical intertidal area, the Bijagós Archipelago, West-Africa

Ana Pinto Coelho et al. PLoS One. .

Abstract

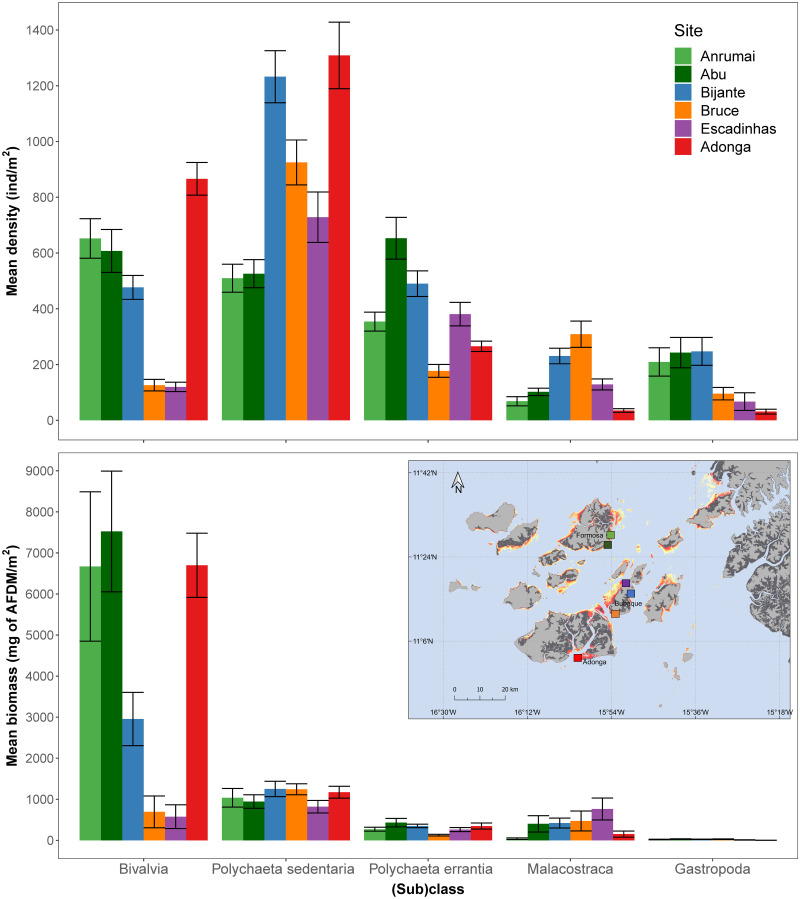
The coastal intertidal ecosystem of the Bijagós Archipelago, Guinea-Bissau, one of the largest and most important in West Africa, sustains a considerable proportion of the migratory shorebird populations of the East Atlantic Flyway and operates as a nursery area for benthic fish in the region. The macrozoobenthos in these mudflats constitute the main food source for both groups so that spatial and temporal variation in their abundance and community composition is likely to influence the abundance and distribution of fish and birds. In this study we described the spatial and temporal dynamics in the density, biomass, and community composition of macrozoobenthos across six intertidal flats in three islands of the Bijagós Archipelago. Overall, the Bijagós Archipelago was characterised by a highly species-rich macrozoobenthic community, with ca. 88 taxa identified across all sites, reaching a mean density of 1871 ± 58.3 ind.m-2 (mean ± SE) and mean biomass of 5.65 ± 0.41 g of AFDM.m-2 (ash-free dry mass per m2), values much lower than what was described for nearby intertidal areas, namely the Band d'Arguin, Mauritania. Density and biomass of major macrozoobenthos classes (Bivalvia, Polychaeta, Malacostraca and Gastropoda) differed across sites and months, displaying an overall increase in density towards the final months of the dry season (March and April). Similarly, community composition also differed significantly between sites and throughout the season. The site with most distinct community composition (Adonga) supported low diversity and high abundance of a few bivalve species, whilst other two sites that hosted the most diverse communities, were also the most similar between them (Anrumai and Abu). These spatial and temporal patterns constitute an important baseline to improve knowledge of this intertidal ecosystem and will contribute towards a better understanding of the spatial and temporal distribution patterns of their consumers.


Conflict of interest statement

The authors have declared that no competing interests exist.

Figures

Fig 1
Fig 1. Study area, with the location of all the sampled sites (coloured squares with white numbers representing each of the sites throughout the paper).
Black circles in each intertidal site (insets) represent the locations where sediment cores were taken. Note the differences in size between each intertidal site when considering the extent and distribution of sampling. Grey areas represent land, dark grey areas represent mangroves, and digital elevation model is represented for the intertidal area (ranging from yellow–orange–red showing lower, mid, and higher elevation areas).
Fig 2
Fig 2. Variation in the mean density (ind.m-2) and biomass (mg AFDM.m-2), with standard error bars, of major macrozoobenthos (sub)classes sampled in each site.
Map of the Bijagós archipelago (inset) is shown, with indication of the spatial distribution of the study sites, represented by coloured squares with matching colour scheme.
Fig 3
Fig 3. Temporal (monthly) variation in the density (individuals per m2) of major macrozoobenthic invertebrate (sub)classes (rows; note varying scales on y axis) in each site (columns) throughout months.
Black circles and vertical lines represent mean with associated standard errors. Black lines represent Generalized linear models (family negative binomial, with log link) fitted to data points, with grey areas showing 95% confidence intervals. Significant relationships are represented by solid lines, and non-significant by dashed lines. Estimates for the variation of density for each unit of month and p-values are shown in each panel. Bivalves are the only (sub)class for which no significant interaction was found between site and month (Table 3), and therefore has only one estimate of month and p-value for all sites. Regressions lines for Adonga were not computed due to only having 3 sampled months.
Fig 4
Fig 4. Temporal (monthly) variation in the biomass (mg of AFDM.m-2) of major macrozoobenthic invertebrate (sub)classes (rows; note varying scales on y axis) in each site (columns) throughout months.
Black circles and vertical lines represent mean and standard errors, respectively. Black lines represent Generalized linear models (family negative binomial, with log link) fitted to data points, with grey areas showing 95% confidence intervals. Significant relationships are represented by solid lines, and non-significant by dashed lines. Estimates for the variation of density for each unit of month and p-values are shown in each panel. Bivalves and Gastropods are the only (sub)classes for which no significant interaction was found between site and month (Table 3), and therefore has only one estimate of month and p-value for all sites. Regressions lines for Adonga were not computed due to only having 3 sampled months.
Fig 5
Fig 5. Canonical analysis of Principal Components based on discriminant analysis, grouping the data points (cores) per site (A) and period (B) in a dual-axis linear discriminant space.
Ellipses represent 60% of the data for each group. Arrows show species with the most influence in the distribution of data points, and the size of the arrows are scaled according to the R2 of each regression between the densities of each species and the axis of the CAP ordination (i.e., longer arrows represent more influent species). Species with significant fits but with an R2 smaller than 0.15 are omitted.
Fig 6
Fig 6. Canonical analysis of Principal Components based on discriminant analysis (made with 3 axis), grouping the data points (cores) per site, in the end of wet season (A: October–November); early dry season (B: December, January and February); and end late dry season (C: March and April,) in a dual-axis linear discriminant space.
Ellipses represent 60% of the data for each group. Arrows show species with the most influence in the distribution of data points, and the size of the arrows is scaled according to the R2 of each regression (i.e., longer arrows represent more influential species). Species with a significant fit but with an R2 smaller than 0.15 are omitted. A map of the Bijagós Archipelago is shown, with indications of the study site locations represented as squares with a matching colour scheme.

References

    1. Finlayson C, Milton G, Prentice R, Davidson N. The wetland book. II. Distribution, description and conservation. Dordrecht: Springer; 2017.
    1. Beninger PG. Mudflat Ecology. Aquatic Ec. Beninger PG, editor. Cham: Springer International Publishing; 2018. doi: 10.1007/978-3-319-99194-8 - DOI
    1. Murray NJ, Phinn SR, DeWitt M, Ferrari R, Johnston R, Lyons MB, et al.. The global distribution and trajectory of tidal flats. Nature. 2019;565: 222–225. doi: 10.1038/s41586-018-0805-8 - DOI - PubMed
    1. Arkema KK, Guannel G, Verutes G, Wood SA, Guerry A, Ruckelshaus M, et al.. Coastal habitats shield people and property from sea-level rise and storms. 2013;3. doi: 10.1038/NCLIMATE1944 - DOI
    1. Bernhardt JR, Leslie HM. Resilience to climate change in coastal marine ecosystems. doi: 10.1146/annurev-marine-121211-172411 - DOI - PubMed

Publication types