. 2023 Feb;37(1):57-71.
doi: 10.1037/adb0000889. Epub 2022 Nov 28.

Notes on demand: Conceptual and empirical benefits of applying Rachlin's discounting equation to demand data

Affiliations

Notes on demand: Conceptual and empirical benefits of applying Rachlin's discounting equation to demand data

Mark J Rzeszutek et al. Psychol Addict Behav. 2023 Feb.

Abstract

Objective: Howard Rachlin wrote extensively on how value diminishes in a hyperbolic form, and he contributed to understanding choice processes between different commodities as a molar pattern of behavior. The field of behavioral economic demand has been dominated by exponential decay functions, indicating that decreases in consumption of a commodity are best fit by exponential functions. Because of the success of Rachlin's equation at describing how hyperbolic decay affects the value of a commodity across various factors (e.g., delay, probability, social distance), we attempted to extend his equation to behavioral economic demand data for alcohol and opioids.

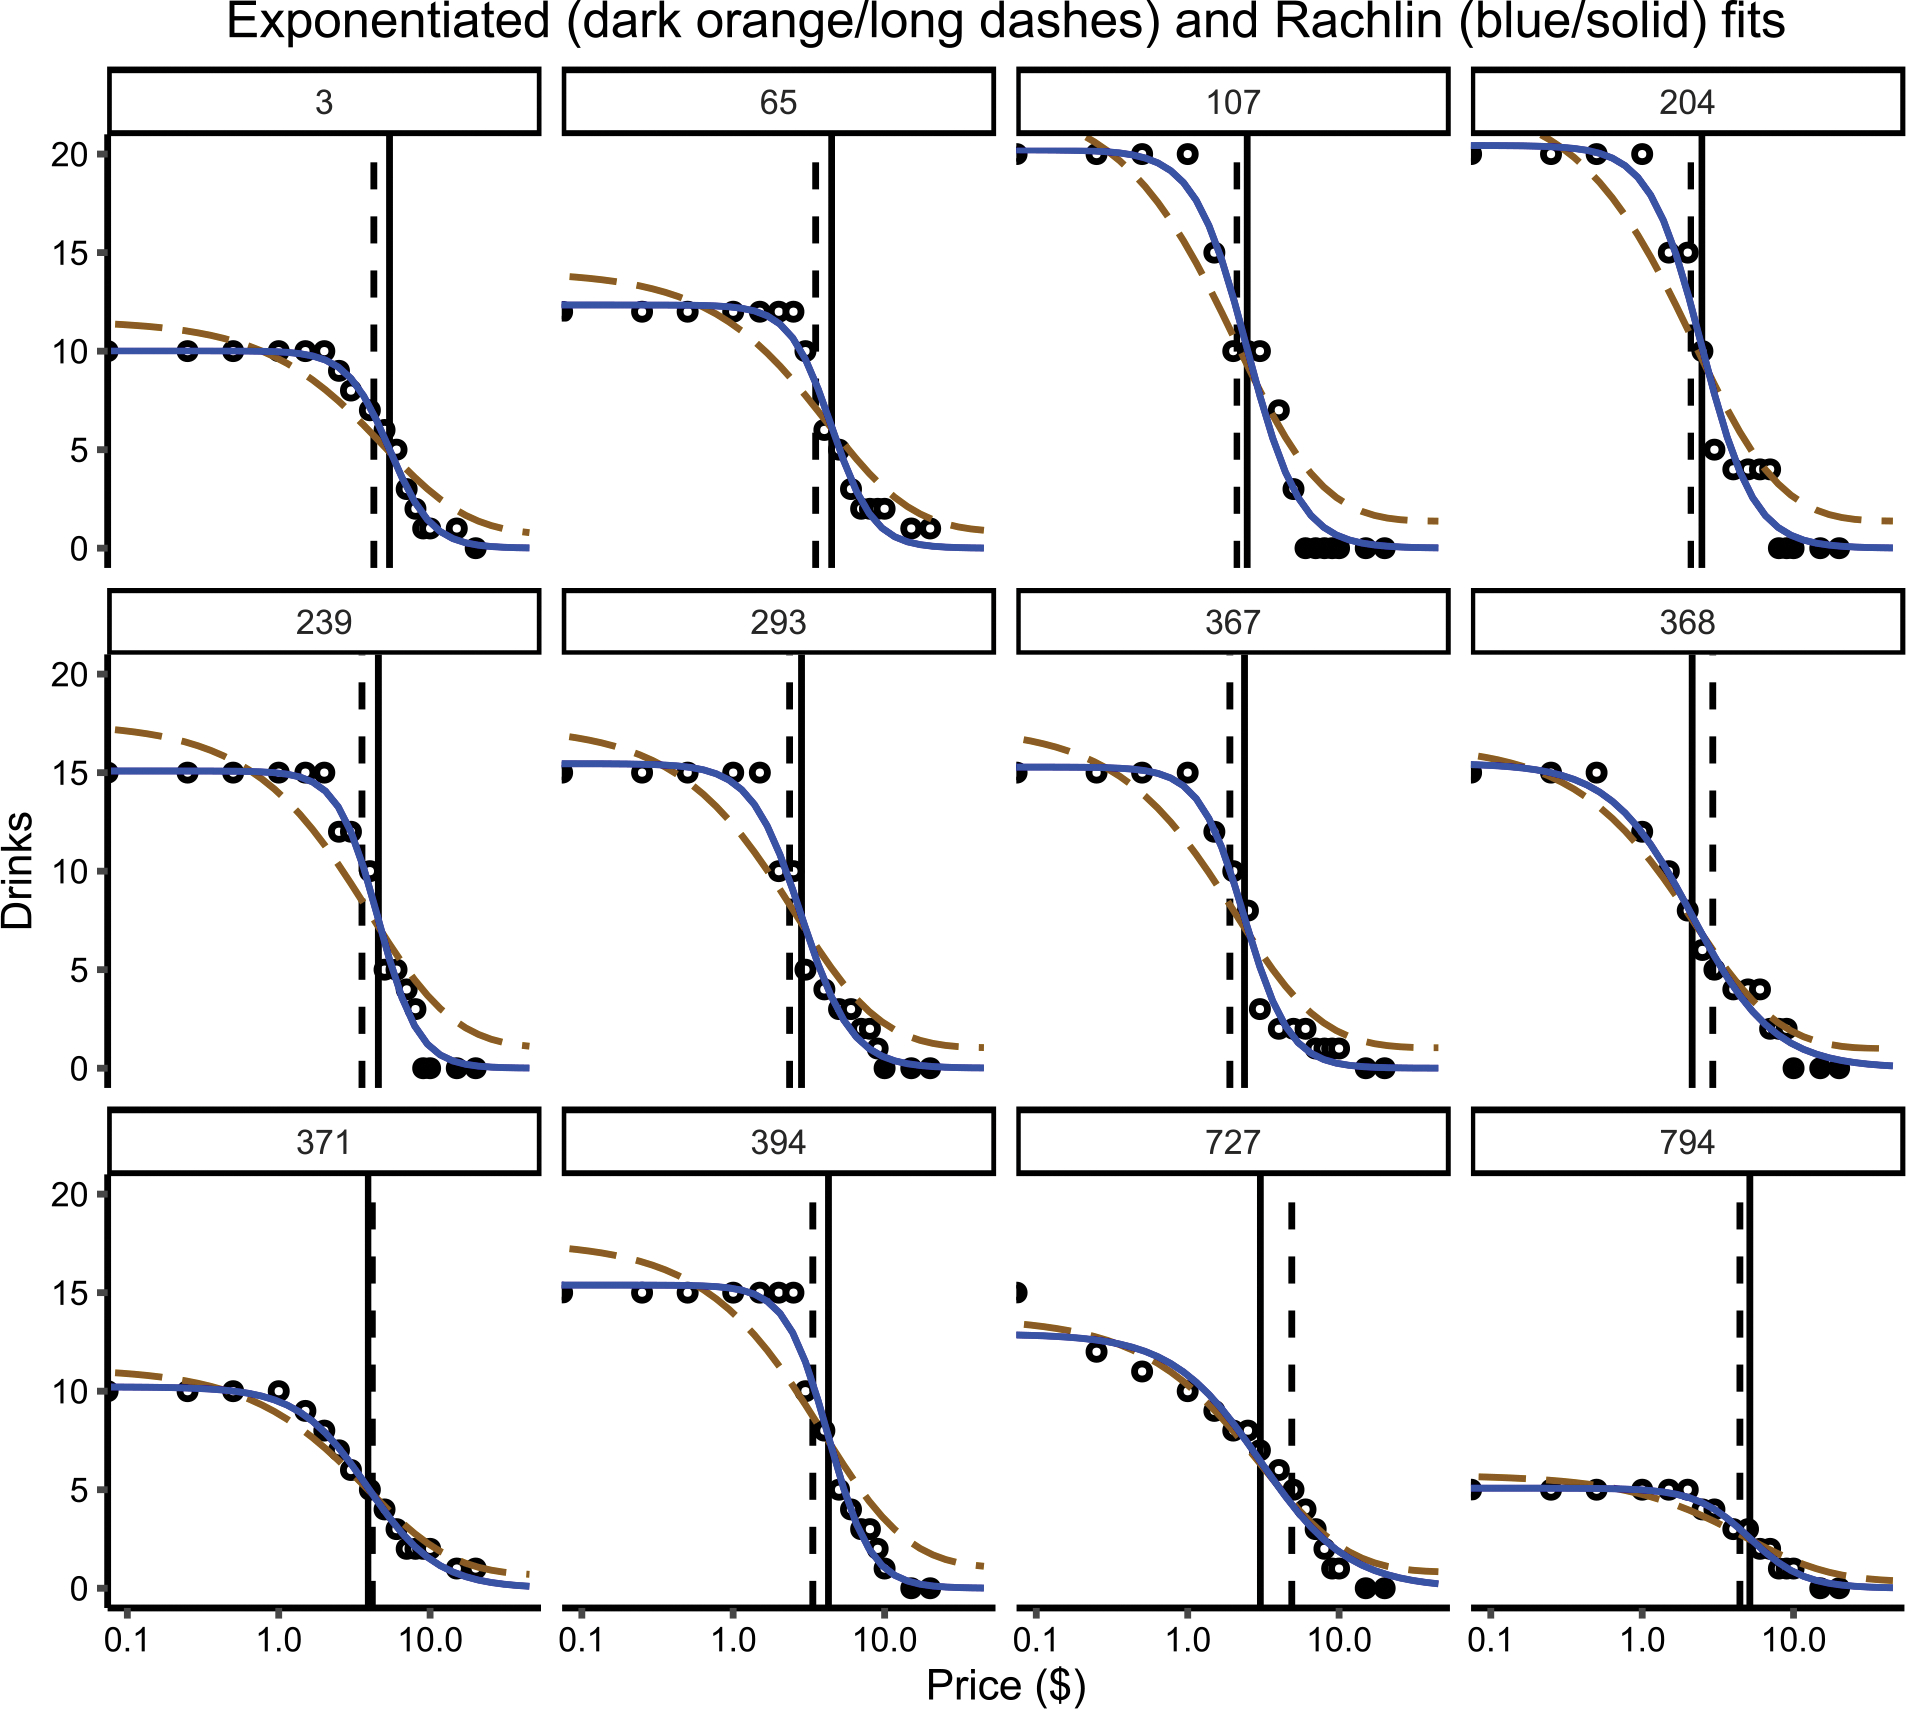
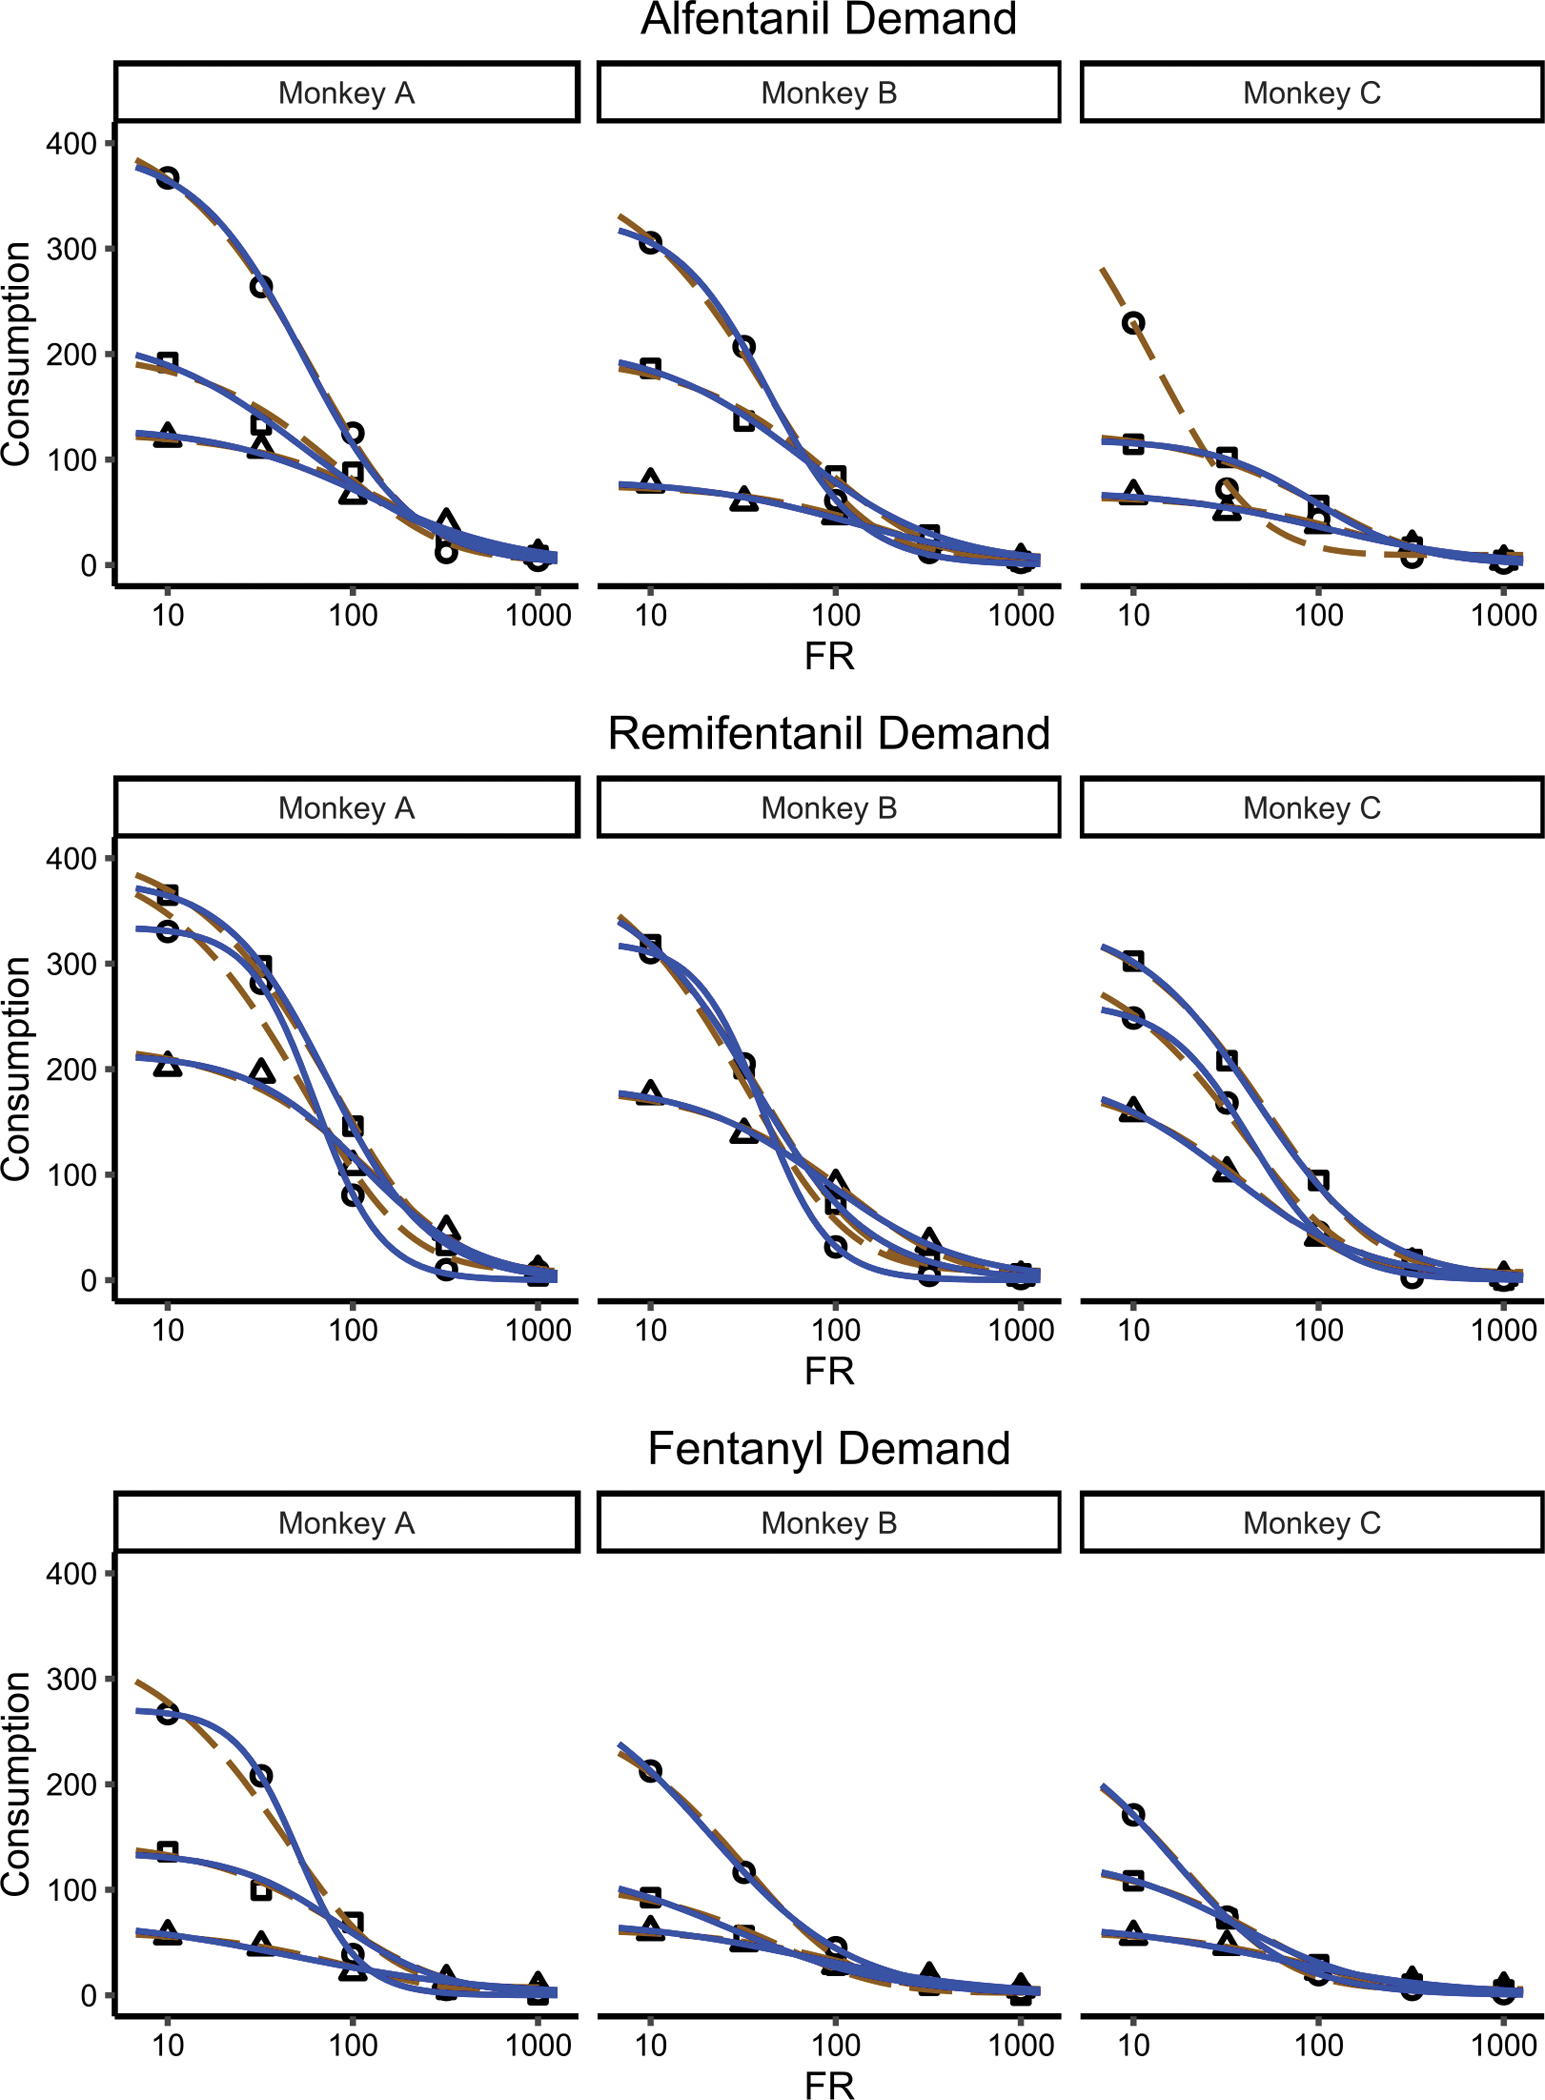
Method: Rachlin's discounting equation was applied to estimate consumption on alcohol purchase task data and nonhuman drug demand data. We compared results of his equation to the exponentiated demand equation using both a mixed-effects modeling approach and a two-stage approach.

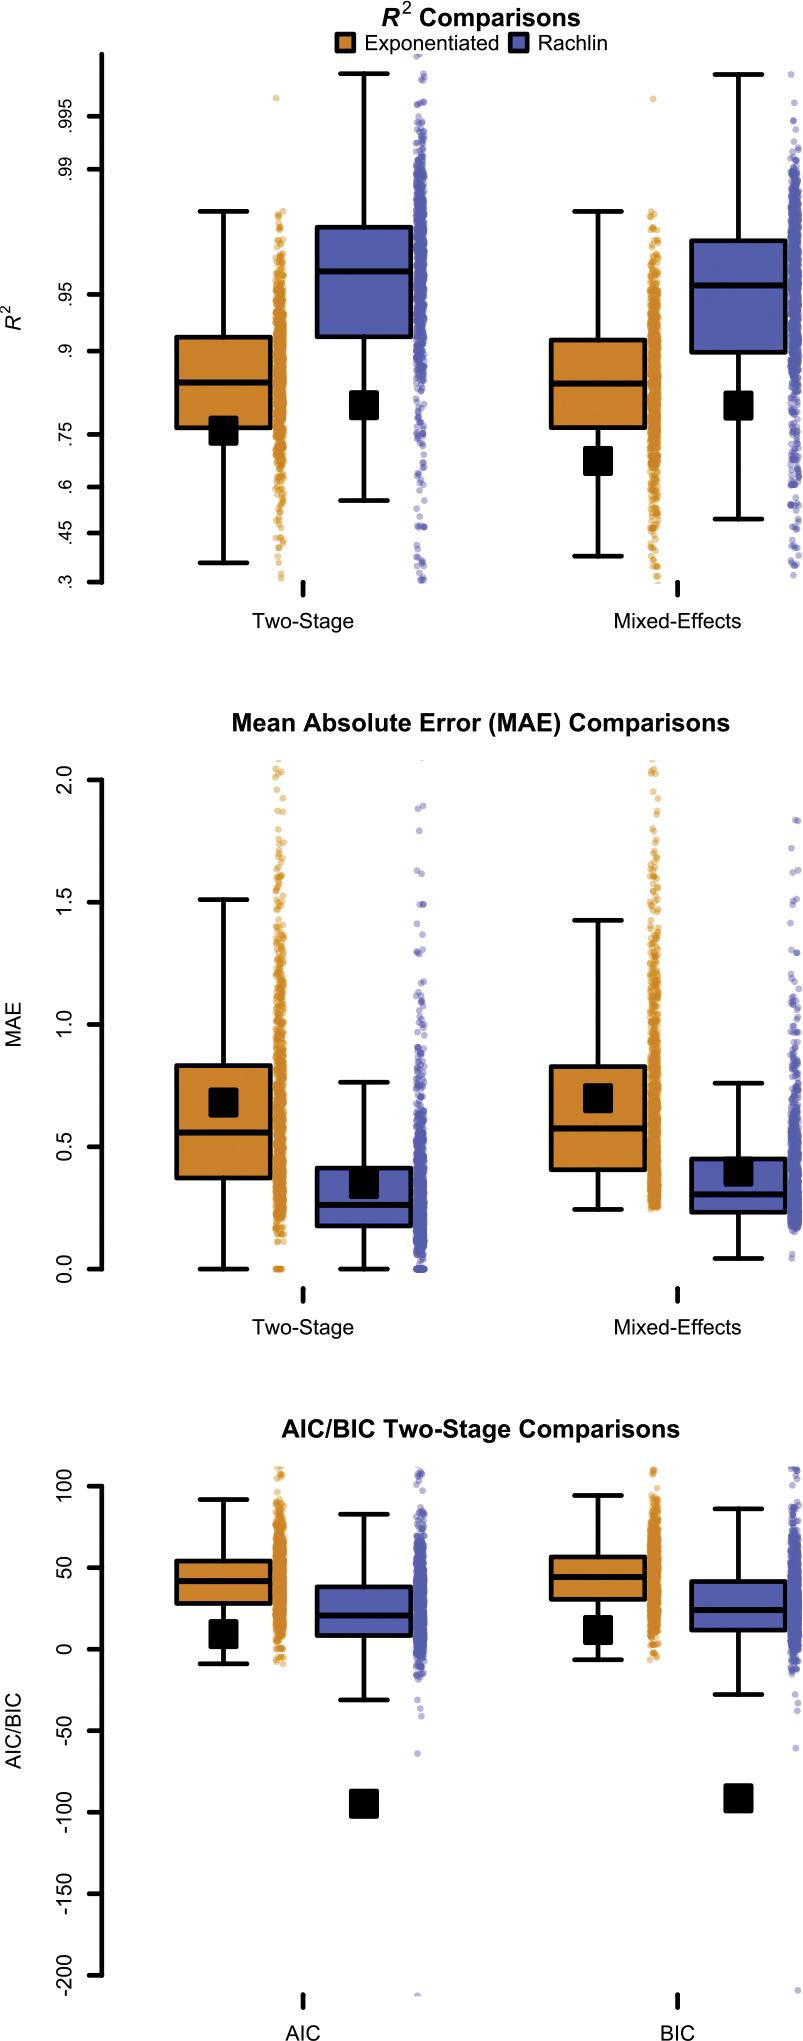
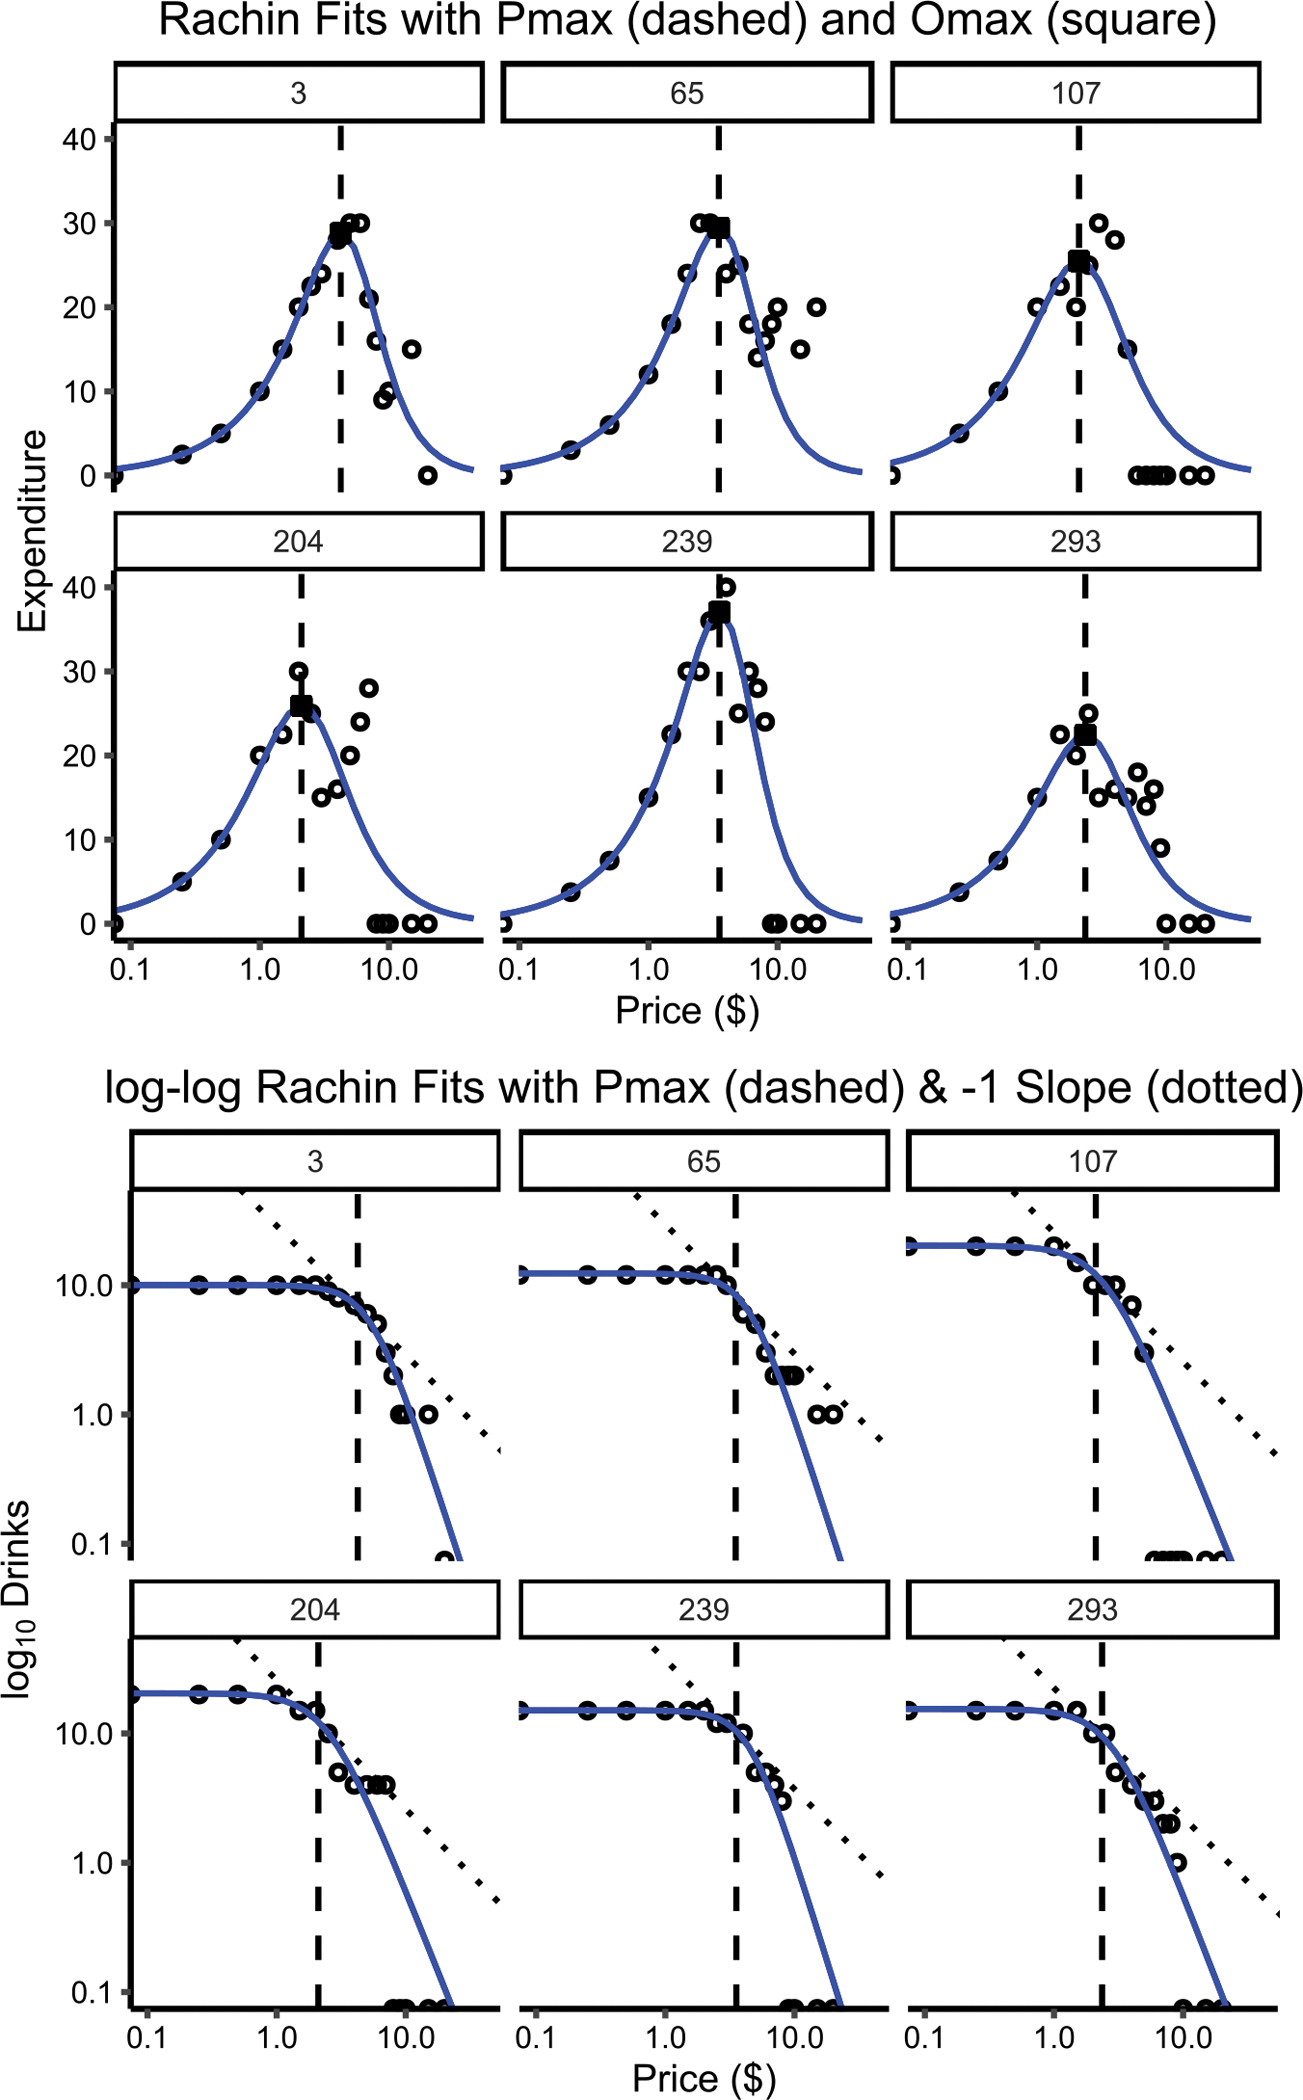
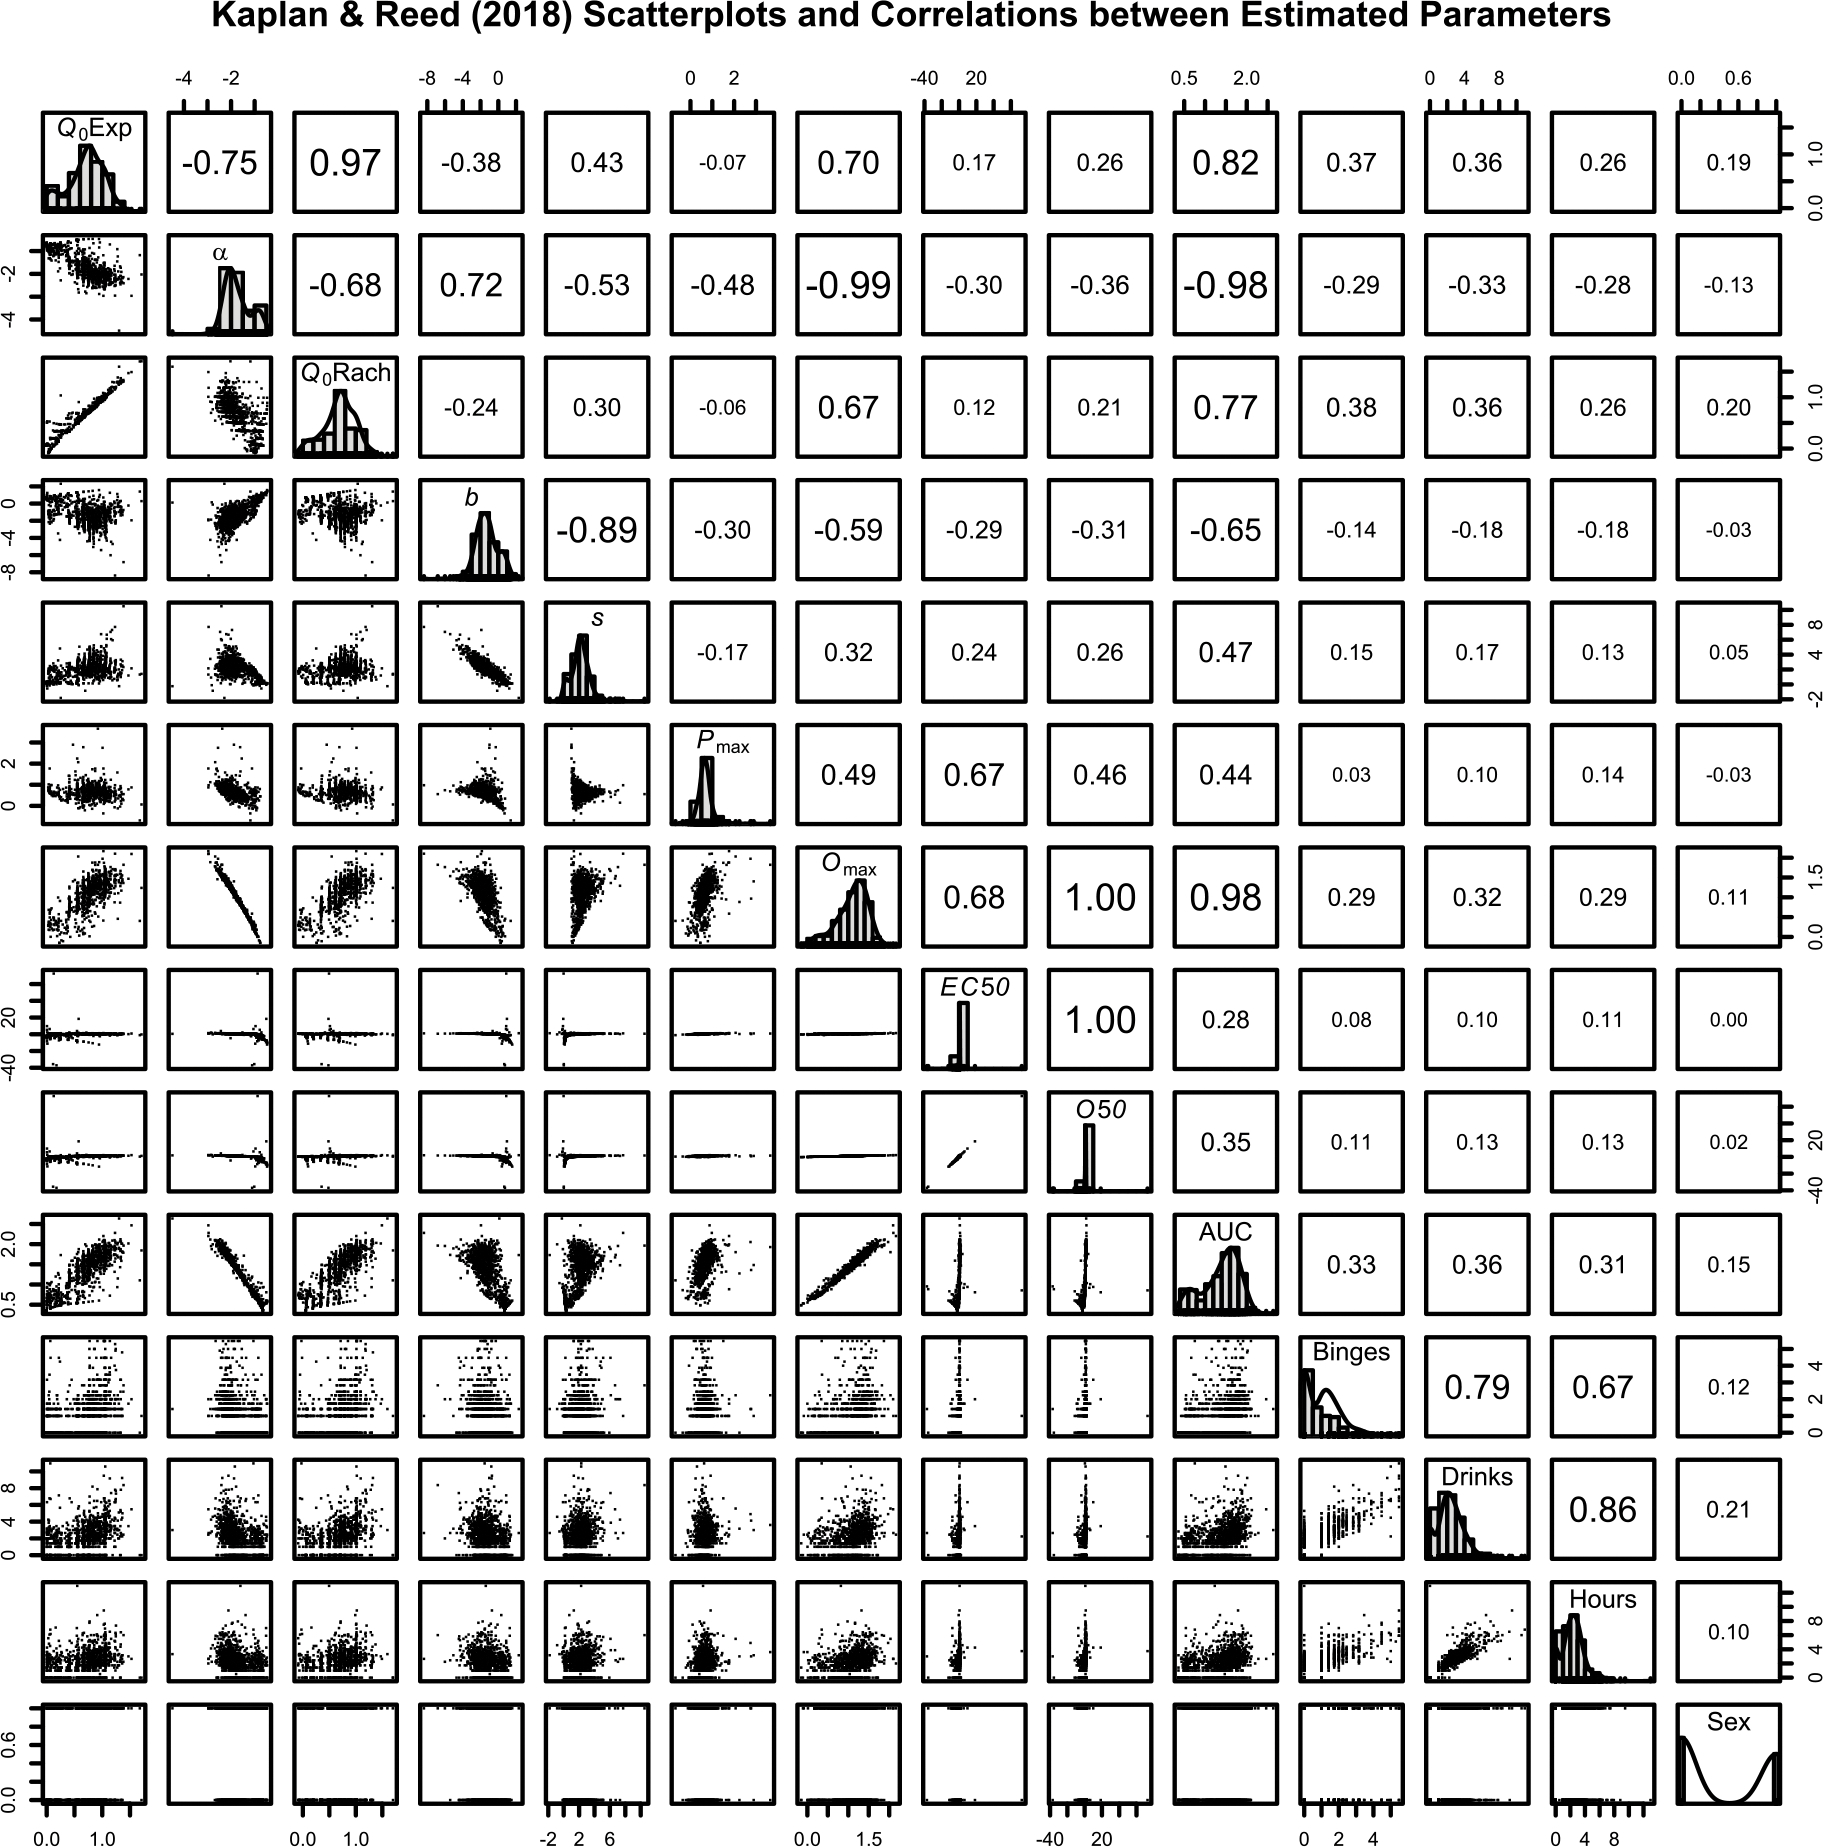
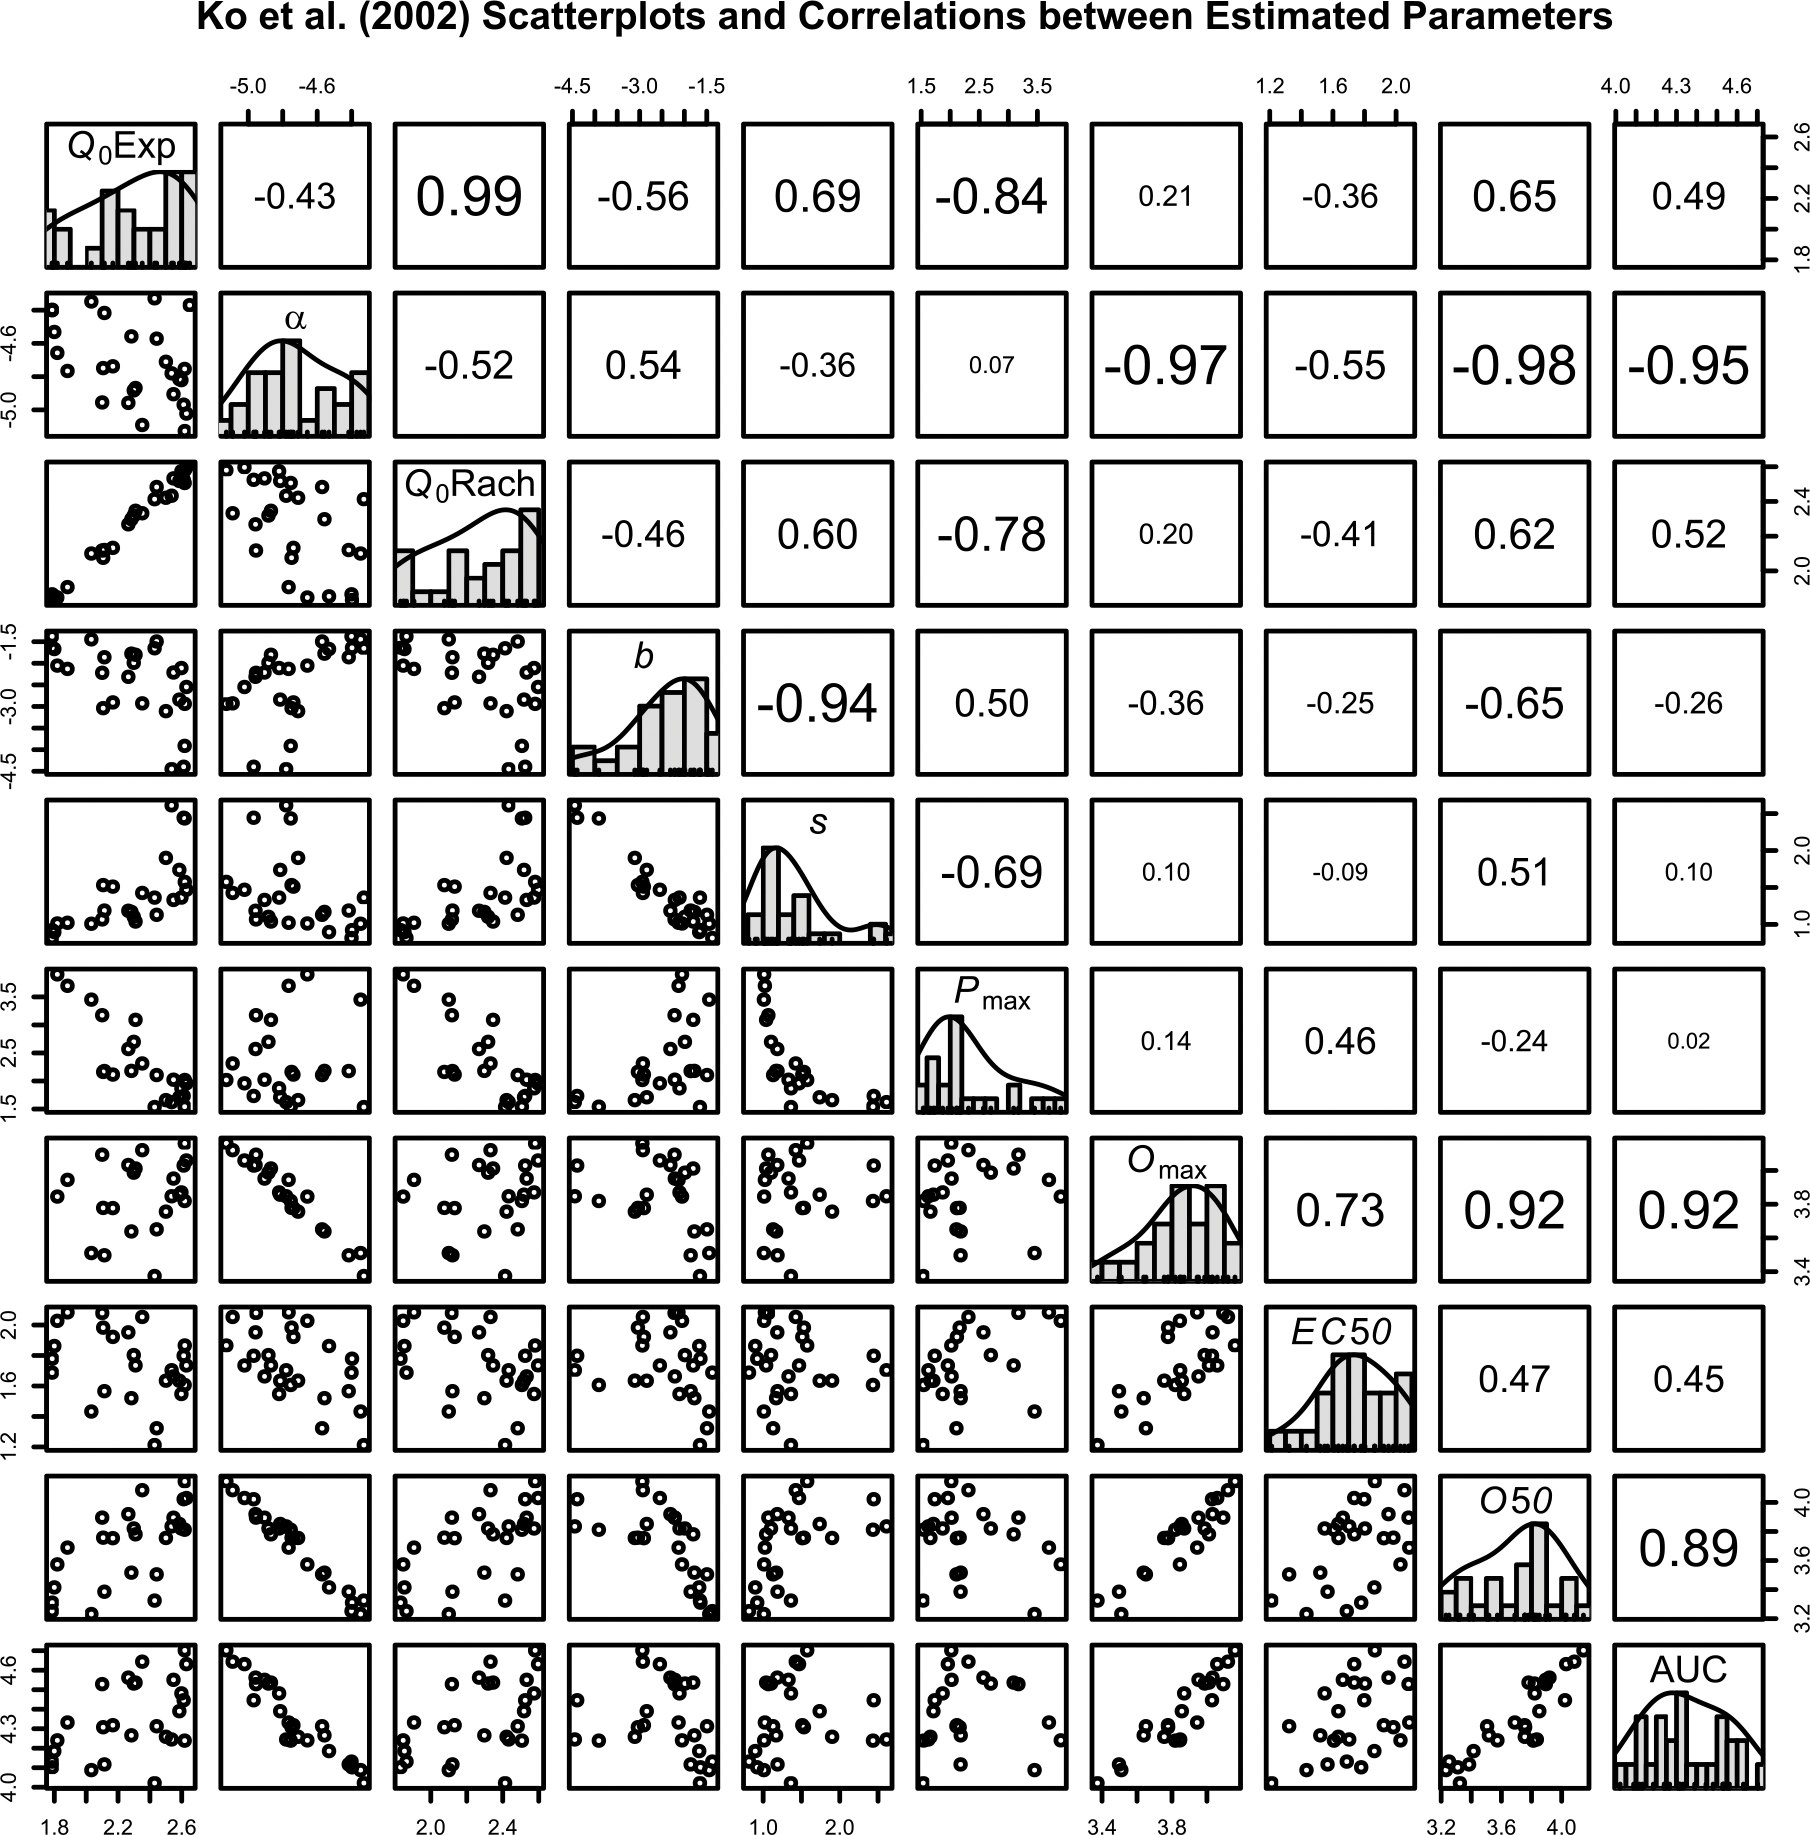
Results: Rachlin's equation provided better fits to consumption data than the exponentiated equation for both mixed-effects and two-stage modeling. We also found that traditional demand metrics, such as Pmax, can be derived analytically when using Rachlin's equation. Certain metrics derived from Rachlin's equation appeared to be related to clinical covariates in ways similar to the exponentiated equation.

Conclusions: Rachlin's equation better described demand data than did the exponentiated equation, indicating that demand for a commodity may decrease hyperbolically rather than exponentially. Other benefits of his equation are that it does not have the same pitfalls as the current exponential equations and is relatively straightforward in its conceptualization when applied to demand data. (PsycInfo Database Record (c) 2023 APA, all rights reserved).


Figures

Figure 1.
Figure 1.
For all panels comparisons are between the exponentiated demand model (dark orange, left of pair) and the Rachlin model (blue, right of pair) from the Kaplan & Reed (2018) alcohol purchase task dataset. Top panel: Boxplots of R2 from the two-stage and mixed-effects approaches for the. Horizontal black lines indicate the median, and black squares indicate the mean. Y-axis is logit-scaled to help show differences between models. Higher is better. Center Panel: Y-axis is the mean absolute error (MAE) for two-stage and mixed-effects approaches. Closer to zero is better. Bottom Panel: AIC and BIC comparisons from the two-stage models (mixed-effects model AIC/BIC values are reported in text). Lower is better for both AIC and BIC. Points to the right of a boxplot represent individual values.
Figure 2.
Figure 2.
Individual model fits from the random effects from the multilevel modeling approach from the exponentiated model (dark orange, long dash) and the Rachlin model (blue, solid) to select individuals. Points that are black represent either consumption at no cost or zero consumption. Pmax is indicated by the dashed vertical line, EC50 is indicated by the solid vertical line. Y-axis is number of drinks consumed, x-axis is cost per drink (log10 scaled). Left-most consumption values are consumptions at zero cost, but since zeros cannot be plotted in log space, this is indicated by these points being cut in half.
Figure 3.
Figure 3.
Top: Individual model fits from the random effects from the multilevel modeling approach from Rachlin model (blue, solid) to select individuals. Pmax is indicated by the dashed vertical line, calculated Omax is indicated by a square. Y-axis is total expenditure on drinks (consumption * price), x-axis is cost per drink (log10 scaled). Bottom: Same participants as top, but both y- and x-axes are log10-scaled, with the y-axis being number of drinks consumed. Dotted line represents a slope of −1 in log-log space, dashed vertical line represents Pmax. Both panels are meant to demonstrate the accuracy of the Pmax derivation. Since zeros cannot be plotted in log space, this is indicated by data points that are cut in half.
Figure 4.
Figure 4.
Scatterplots, histograms, and Pearson correlation matrix of estimated parameters from mixed-effects modeling versions of the exponentiated model and Rachlin model for Kaplan and Reed (2018) data. Font size is associated with strength of correlation. All parameters are log-scaled to approximate normality except demographic covariates. Binges, drinks, and hours are square root transformed to help approximate normality. Q0Exp: Exponentiated Q0. Q0Rach: Rachlin Q0. AUC: Rachlin integrated area under the curve. Binges: Number of binges. Drinks: Total number of drinks during a drinking episode. Hours: Total hours during a drinking episode. Sex: Binary coded sex variable, males were coded as 1, females were coded as 0. Correlations < .06 are not significant at the p < .05 level.
Figure 5.
Figure 5.
Individual model fits using the two-stage approach from the exponentiated model (dark orange, long dash) and the Rachlin model (blue, solid) to data from Ko et al. (2002). Each row is a drug, each column is a different monkey. Shapes represent different drug doses. Y-axis is doses consumed, x-axis is the fixed ratio to obtain a drug dose (FR; log10 scaled). Exponentiated model fits are dark orange, long dashed, lines and the Rachlin model fits are the blue, solid, lines. Note that the Rachlin model did not converge for Monkey C for alfentanil. Circles: Lowest dose. Squares: Middle dose. Triangles: Highest dose.
Figure 6.
Figure 6.
Scatterplots, histograms, and Pearson correlation matrix of estimated parameters from the two-stage approach of the exponentiated model and Rachlin model for Ko et al. (2002) data. Font size is associated with strength of correlation. All parameters are log-scaled to approximate normality. Q0Exp: Exponentiated Q0. Q0Rach: Rachlin Q0. AUC: Rachlin integrated area under the curve.

Similar articles

Cited by

References

    1. Amlung M, Vedelago L, Acker J, Balodis I, & MacKillop J (2017). Steep delay discounting and addictive behavior: A meta-analysis of continuous associations. Addiction, 112(1), 51–62. 10.1111/add.13535 - DOI - PMC - PubMed
    1. Amlung M, Yurasek A, McCarty KN, MacKillop J, & Murphy JG (2015). Area under the curve as a novel metric of behavioral economic demand for alcohol. Experimental and Clinical Psychopharmacology, 23(3), 168–175. 10.1037/pha0000014 - DOI - PMC - PubMed
    1. Aston ER, & Cassidy RN (2019). Behavioral economic demand assessments in the addictions. Current Opinion in Psychology, 30, 42–47. 10.1016/j.copsyc.2019.01.016 - DOI - PMC - PubMed
    1. Aston ER, Metrik J, Amlung M, Kahler CW, & MacKillop J (2016). Interrelationships between marijuana demand and discounting of delayed rewards: Convergence in behavioral economic methods. Drug and Alcohol Dependence, 169, 141–147. 10.1016/j.drugalcdep.2016.10.014 - DOI - PMC - PubMed
    1. Bickel WK, Marsch LA, & Carroll ME (2000). Deconstructing relative reinforcing efficacy and situating the measures of pharmacological reinforcement with behavioral economics: A theoretical proposal. Psychopharmacology, 153(1), 44–56. 10.1007/s002130000589 - DOI - PubMed

Substances