. 2022 Dec 20;55(24):3631-3640.
doi: 10.1021/acs.accounts.2c00523. Epub 2022 Nov 28.

UV Photoelectron Spectroscopy of Aqueous Solutions

Affiliations

UV Photoelectron Spectroscopy of Aqueous Solutions

William G Fortune et al. Acc Chem Res. .

Abstract

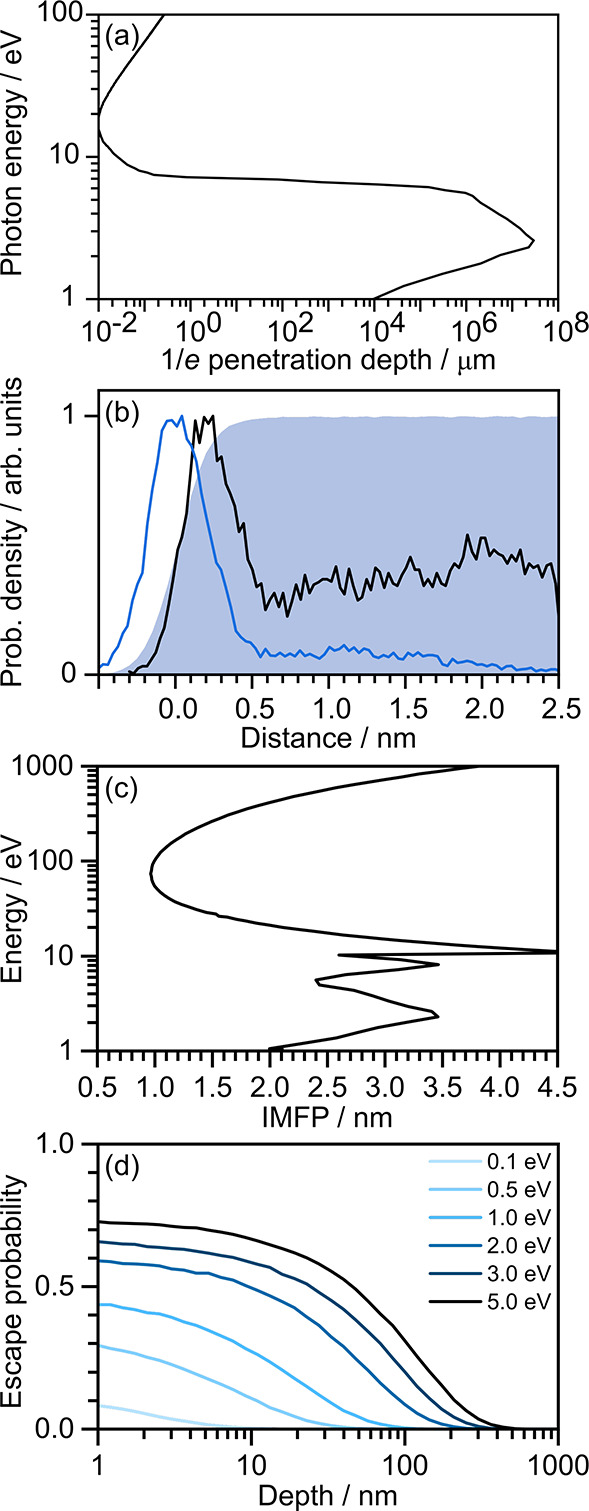
Knowledge of the electronic structure of an aqueous solution is a prerequisite to understanding its chemical and biological reactivity and its response to light. One of the most direct ways of determining electronic structure is to use photoelectron spectroscopy to measure electron binding energies. Initially, photoelectron spectroscopy was restricted to the gas or solid phases due to the requirement for high vacuum to minimize inelastic scattering of the emitted electrons. The introduction of liquid-jets and their combination with intense X-ray sources at synchrotrons in the late 1990s expanded the scope of photoelectron spectroscopy to include liquids. Liquid-jet photoelectron spectroscopy is now an active research field involving a growing number of research groups. A limitation of X-ray photoelectron spectroscopy of aqueous solutions is the requirement to use solutes with reasonably high concentrations in order to obtain photoelectron spectra with adequate signal-to-noise after subtracting the spectrum of water. This has excluded most studies of organic molecules, which tend to be only weakly soluble. A solution to this problem is to use resonance-enhanced photoelectron spectroscopy with ultraviolet (UV) light pulses ( ≲ 6 eV). However, the development of UV liquid-jet photoelectron spectroscopy has been hampered by a lack of quantitative understanding of inelastic scattering of low kinetic energy electrons (≲5 eV) and the impact on spectral lineshapes and positions.In this Account, we describe the key steps involved in the measurement of UV photoelectron spectra of aqueous solutions: photoionization/detachment, electron transport of low kinetic energy electrons through the conduction band, transmission through the water-vacuum interface, and transport through the spectrometer. We also explain the steps we take to record accurate UV photoelectron spectra of liquids with excellent signal-to-noise. We then describe how we have combined Monte Carlo simulations of electron scattering and spectral inversion with molecular dynamics simulations of depth profiles of organic solutes in aqueous solution to develop an efficient and widely applicable method for retrieving true UV photoelectron spectra of aqueous solutions. The huge potential of our experimental and spectral retrieval methods is illustrated using three examples. The first is a measurement of the vertical detachment energy of the green fluorescent protein chromophore, a sparingly soluble organic anion whose electronic structure underpins its fluorescence and photooxidation properties. The second is a measurement of the vertical ionization energy of liquid water, which has been the subject of discussion since the first X-ray photoelectron spectroscopy measurement in 1997. The third is a UV photoelectron spectroscopy study of the vertical ionization energy of aqueous phenol which demonstrates the possibility of retrieving true photoelectron spectra from measurements with contributions from components with different concentration profiles.


Conflict of interest statement

The authors declare no competing financial interest.

Figures

Figure 1
Figure 1
Schematic diagram illustrating multiphoton photoionization/detachment (i) and subsequent electron transport in the conduction band (ii), through the water-vacuum interface (iii), and through the spectrometer (iv). Adapted with permission from ref (1). Copyright 2022 the authors. Published by Springer Nature under a Creative Commons CC BY license.
Figure 2
Figure 2
(a) 1/e penetration depths for photons in the energy regime 0–100 eV. Data from ref (41). (b) Probability density function for phenolate (black line) and phenol (blue line) in water (blue shading), shown as a function of distance from the liquid–vacuum interface. (c) Inelastic mean free path for electrons in liquid water for a range of electron kinetic energies of ejected electrons. Data from refs (35) (≤10 eV) and (12) (>10 eV). (d) Photoelectron escape probability as a function of eKE and depth below the jet surface calculated using the algorithm from ref (2).
Figure 3
Figure 3
One-dimensional electron scattering simulations, plotted as mean eKE losses as a function of initial eKE for electrons starting at various depths (labeled) in the liquid relative to the surface. Only electrons that emerge successfully from the liquid are included. Adapted with permission from ref (1). Copyright 2022 the authors. Published by Springer Nature under a Creative Commons CC BY license.
Figure 4
Figure 4
Schematic diagram illustrating the electronic energy levels of the components of a magnetic bottle photoelectron spectrometer in which the magnet, liquid-jet holder, catcher and skimmer are all graphite-coated. Φgraphite and Φanalyzer are work functions, EF is the Fermi level and Evac is the vacuum level. (a) Without the liquid-jet in place, there is no potential gradient between the magnet and the skimmer. (b) Adding a liquid-jet with a different work function results in a potential gradient that, in this example, accelerates photoelectrons. (c) Adjusting the concentration of electrolytes in the liquid flattens the potential between the magnet and skimmer.
Figure 5
Figure 5
Schematic flowchart of our LJ-PES retrieval algorithm. (i) Having selected the appropriate eKE range based on an experimental measurement, (ii) EzSz(E) transformation functions are generated using Monte Carlo simulations, (iii) before being integrated over the probing depth z, (iv) with each depth weighted by an appropriate function to model the solute or solvent concentration profile. (v) Finally, the experimental spectra are fit to a linear combination of Gaussian functions to which the transformations have been applied, ∑iciGi(E) → ∑icigi(E), to give fit parameters eKEtrue and FWHM. Panel v is adapted with permission from ref (2). Copyright 2022 American Chemical Society.
Figure 6
Figure 6
Multiphoton detachment photoelectron spectra of 20 μM aqueous solution of p-HBDI (gray) together with the retrieved Itrue(E) distributions (black), following photoexcitation at 440 and 249.7 nm, plotted as a function of eKE. Gaussians are fits to the experimental data (filled) and retrieved contributions (lines) and represent S1–D0 (dark green), S1–D1 (light green), S6–D1 (dark blue), and S5–D2 (light blue) detachment processes. Adapted with permission from ref (1). Copyright 2022 the authors. Published by Springer Nature under a Creative Commons CC BY license.
Figure 7
Figure 7
(a) Plot of values of the 1b1 vertical ionization energy of liquid water as a function of photon energy. Note that the values measured by Thürmer et al. (open squares) with ≲ 20 eV are included to highlight the significant impact of inelastic scattering at these photon energies. (b) Nonresonant two-photon photoelectron spectrum of water (black) following photoionization at 200.2 nm (black) together with the retrieved Itrue(E) distribution (red). Adapted with permission from ref (2). Copyright 2022 American Chemical Society.
Figure 8
Figure 8
LJ-PES photoelectron spectra of phenol recorded at 290.0 nm. (a) LJ-PES spectrum of phenol after background subtraction and (b) corresponding raw spectrum of phenol including background contribution. The experimental data, fits to the data, and the retrieved initial energy distribution are shown in black, blue, and red, respectively. Adapted with permission from ref (2). Copyright 2022 American Chemical Society.

References

    1. Tau O.; Henley A.; Boichenko A. N.; Kleshchina N. N.; Riley R.; Wang B.; Winning D.; Lewin R.; Ward J.; Parkin I. P.; Hailes H. C.; Bochenkova A. V.; Fielding H. H. Liquid-microjet photoelectron spectroscopy of the green fluorescent protein chromophore. Nat. Commun. 2022, 13, 507.10.1038/s41467-022-28155-5. - DOI - PMC - PubMed
    1. Scholz M. S.; Fortune W. G.; Tau O.; Fielding H. H. Accurate vertical ionisation energy of water and retrieval of true ultraviolet photoelectron spectra of aqueous solutions. J. Phys. Chem. Lett. 2022, 13, 6889–6895. 10.1021/acs.jpclett.2c01768. - DOI - PMC - PubMed
    1. Henley A.; Fielding H. H. Anion photoelectron spectroscopy of protein chromophores. Int. Rev. Phys. Chem. 2019, 38, 1–34. 10.1080/0144235X.2018.1548807. - DOI
    1. Fielding H. H.; Worth G. A. Using time-resolved photoelectron spectroscopy to unravel the electronic relaxation dynamics of photoexcited molecules. Chem. Soc. Rev. 2018, 47, 309–321. 10.1039/C7CS00627F. - DOI - PubMed
    1. Stolow A.; Bragg A. E.; Neumark D. M. Femtosecond time-resolved photoelectron spectroscopy. Chem. Rev. 2004, 104, 1719–1757. 10.1021/cr020683w. - DOI - PubMed

Publication types