Multicenter Study
. 2022 Dec 6;119(49):e2211429119.
doi: 10.1073/pnas.2211429119. Epub 2022 Nov 28.

Transcriptome-based molecular subtypes and differentiation hierarchies improve the classification framework of acute myeloid leukemia

Affiliations
Multicenter Study

Transcriptome-based molecular subtypes and differentiation hierarchies improve the classification framework of acute myeloid leukemia

Wen-Yan Cheng et al. Proc Natl Acad Sci U S A. .

Abstract

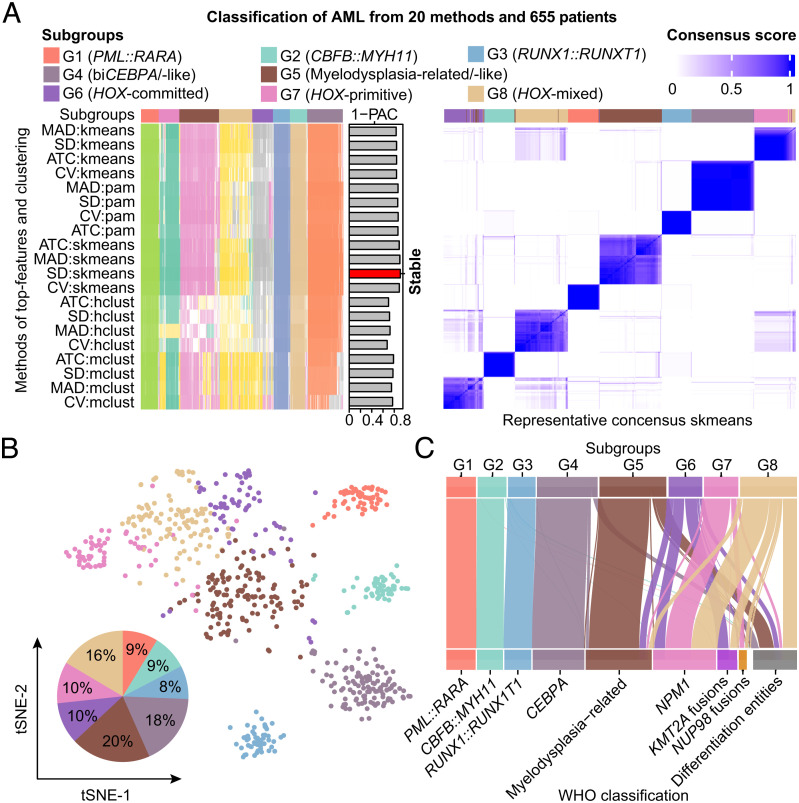
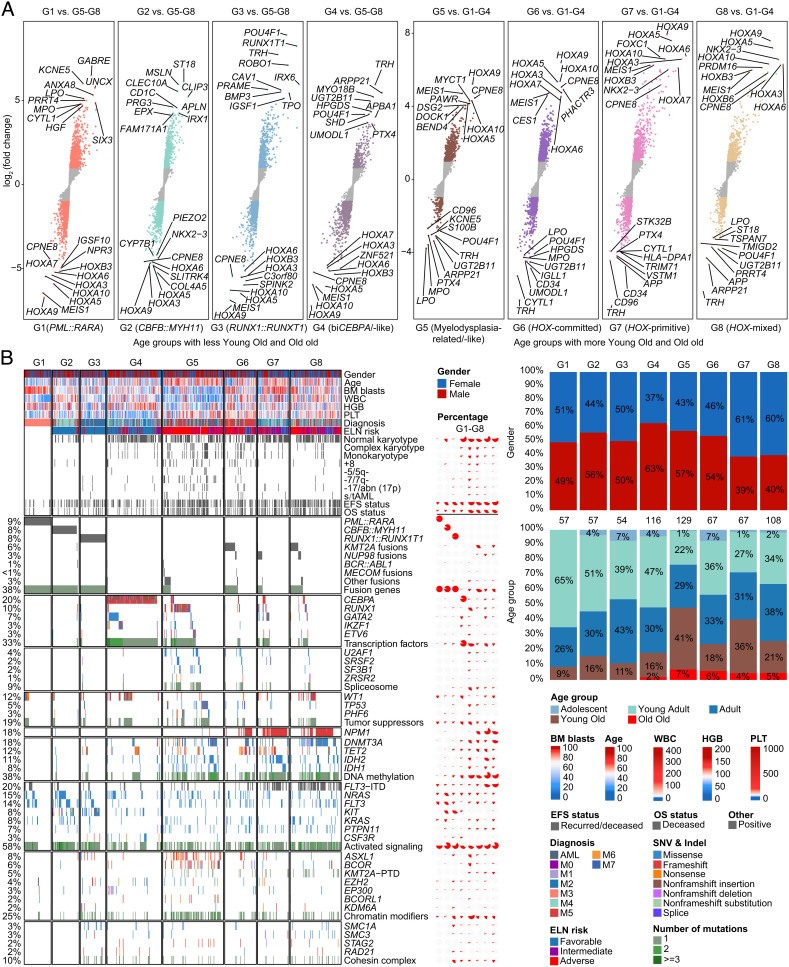
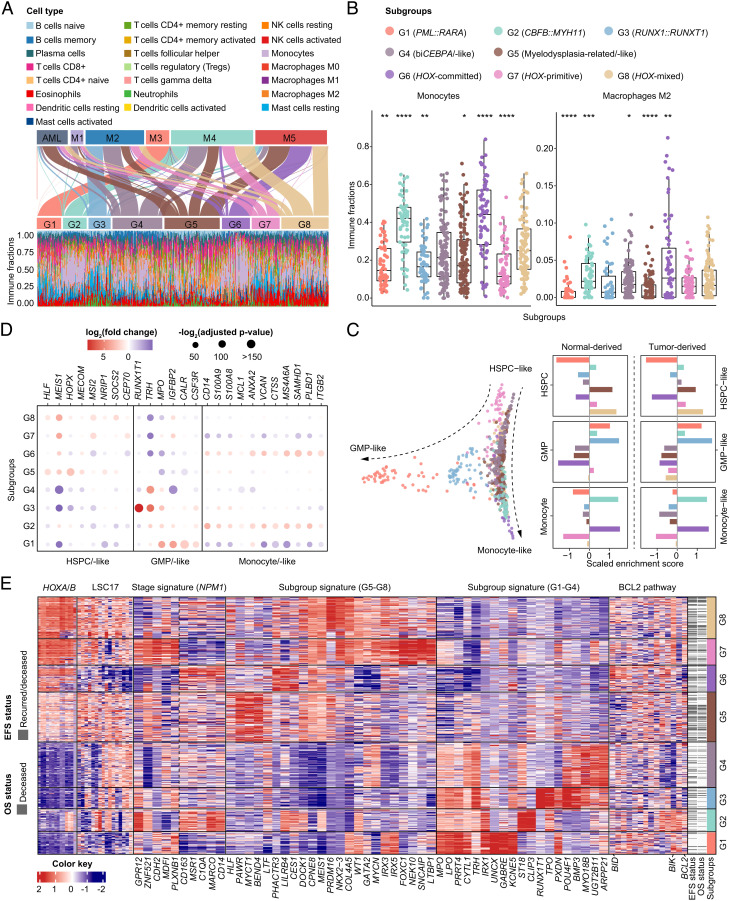
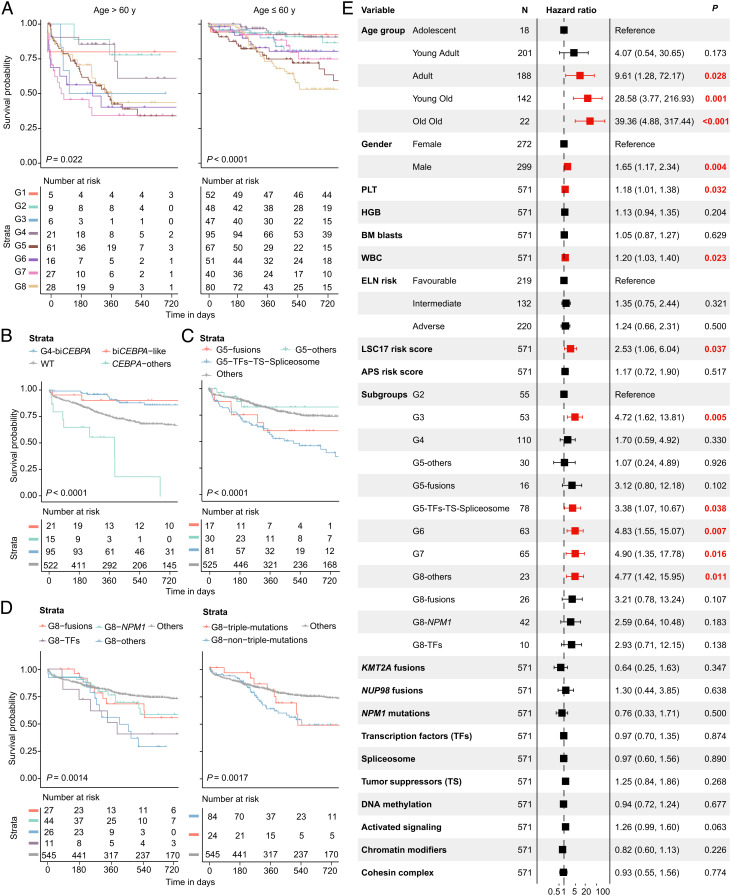
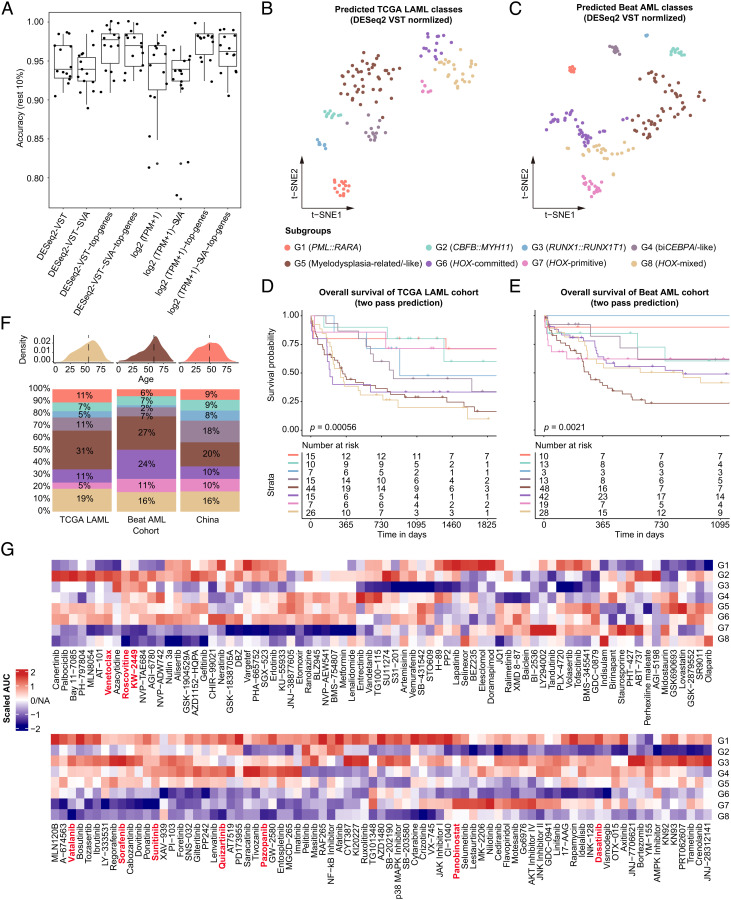
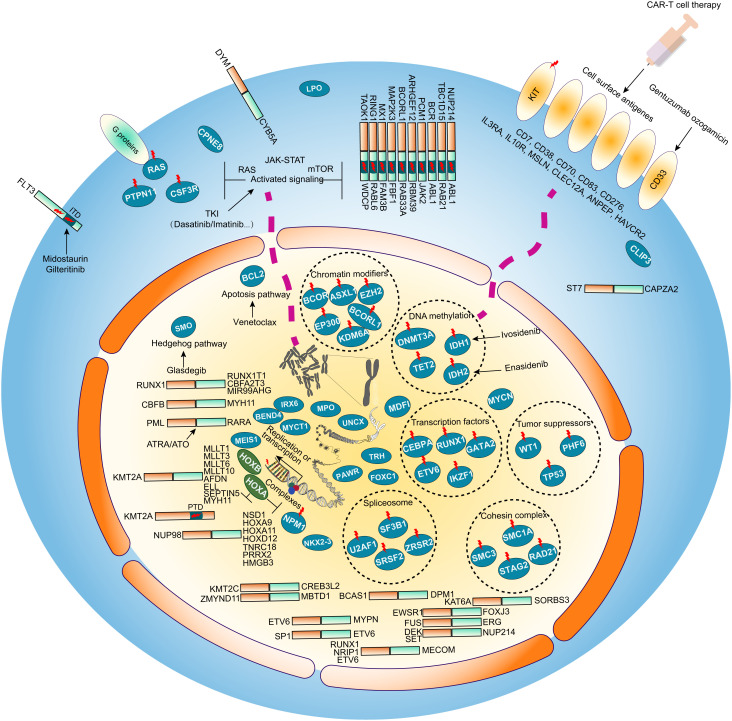
The current classification of acute myeloid leukemia (AML) relies largely on genomic alterations. Robust identification of clinically and biologically relevant molecular subtypes from nongenomic high-throughput sequencing data remains challenging. We established the largest multicenter AML cohort (n = 655) in China, with all patients subjected to RNA sequencing (RNA-Seq) and 619 (94.5%) to targeted or whole-exome sequencing (TES/WES). Based on an enhanced consensus clustering, eight stable gene expression subgroups (G1-G8) with unique clinical and biological significance were identified, including two unreported (G5 and G8) and three redefined ones (G4, G6, and G7). Apart from four well-known low-risk subgroups including PML::RARA (G1), CBFB::MYH11 (G2), RUNX1::RUNX1T1 (G3), biallelic CEBPA mutations or -like (G4), four meta-subgroups with poor outcomes were recognized. The G5 (myelodysplasia-related/-like) subgroup enriched clinical, cytogenetic and genetic features mimicking secondary AML, and hotspot mutations of IKZF1 (p.N159S) (n = 7). In contrast, most NPM1 mutations and KMT2A and NUP98 fusions clustered into G6-G8, showing high expression of HOXA/B genes and diverse differentiation stages, from hematopoietic stem/progenitor cell down to monocyte, namely HOX-primitive (G7), HOX-mixed (G8), and HOX-committed (G6). Through constructing prediction models, the eight gene expression subgroups could be reproduced in the Cancer Genome Atlas (TCGA) and Beat AML cohorts. Each subgroup was associated with distinct prognosis and drug sensitivities, supporting the clinical applicability of this transcriptome-based classification of AML. These molecular subgroups illuminate the complex molecular network of AML, which may promote systematic studies of disease pathogenesis and foster the screening of targeted agents based on omics.

Keywords: RNA-Seq; acute myeloid leukemia; cell differentiation; drug sensitivity; molecular classification.


Conflict of interest statement

The authors declare no competing interest.

Figures

Fig. 1.
Fig. 1.
Characteristic AML subgroups defined by gene expression profiling. (A) Consensus clustering (membership heatmap) of gene expression profiling from 655 primary AML patients with the use of 20 different computational parameters. The PAC negatively indicates the stability of clustering results (Left). Heatmap displays representative consensus clustering method (skmeans) based on top variance genes, which shows the consistency of two samples in the same subgroup (Right). (B) Scatters of eight gene expression subgroups via tSNE visualization are shown. (C) Sankey plot indicates the relationship between the defined molecular subgroups and disease entities defined by WHO classification. PAC, proportion of ambiguous clustering; tSNE, t-distributed stochastic neighbor embedding; WHO, World Health Organization.
Fig. 2.
Fig. 2.
Clinical and molecular features of gene expression subgroups. (A) Differentially expressed genes between each subgroup in G1–G4 and G5–G8 as a whole (Left), and between each subgroup in G5–G8 and G1–G4 as a whole (Right). Each point represents a gene. All genes were ordered by the level of log2 (fold change) from low to high. (B) The Left panel shows clinical features, cytogenetic groups, outcomes, and recurrent gene fusions and mutations in AML, which are classified into diverse functional groups. Each column represents a patient, which is arranged according to the gene expression subgroup through G1–G8. The Middle panel depicts the percentage of clinical and molecular features in each subgroup. The Right panel presents the proportional distribution of gender (Upper) and age group (Lower).
Fig. 3.
Fig. 3.
Cellular hierarchies and regulatory pathways of gene expression subgroups. (A) Sankey plot shows reclassification from FAB subtypes to the defined molecular subgroups (Upper). Immune infiltration with specific cell type abundance in each subgroup as determined by CIBERSORTx (Lower). (B) Comparison of immune fractions of monocytes and macrophages M2 in G1–G8 subgroups. *P < .05; **P < .01; ***P < .005; ****P < .001. (C) Diffusion map for visualization of distinct cell differentiation stages of gene expression subgroups through dimensionality reduction, using HSPC-like, GMP-like, and monocyte-like cell signatures derived from scRNA-Seq data reported by Galen et al. (Left). Enrichment score of differentiation stage markers in each subgroup, using normal-derived and tumor-derived markers from the same scRNA-Seq data (Right). (D) Deregulation of representative molecular markers of each cell type in the eight subgroups. (E) Heatmap of gene expression signatures, including HOXA/B family genes, LSC17 score (Ng et al.), NPM1 stage signatures (Mer et al.), subgroup signatures representing the most significant differentially expressed genes in G5–G8 and G1–G4, and BCL2 family genes in each molecular subgroup. Columns indicate patients and are arranged according to the gene expression subgroup through G1–G8. The red and blue color represents relatively high and low gene expression, respectively. FAB, French-American-British; GMP, granulocyte-monocyte precursors; HSPC, hematopoietic stem/progenitor cells; scRNA-Seq, single-cell RNA sequencing.
Fig. 4.
Fig. 4.
Prognostic value of the established molecular subgroups. (A) Kaplan-Meier curves for overall survival of elderly (>60 y, Left) and young (≤60 y, Right) AML patients stratified by eight gene expression subgroups. (B–D) Kaplan-Meier curves for the probability of overall survival in G4 (B), G5 (C), and G8 (D) subgroups stratified by specific genetic lesions. (E) Multivariable Cox analysis for overall survival in non-M3 AML patients.
Fig. 5.
Fig. 5.
Construction of prediction models and validation in the TCGA LAML and Beat AML cohort. (A) Construction of prediction models utilizing a customized modeling method with different data preprocessing, modeling methods, and random data sampling. Briefly, read counts were quantified by using Featurecounts, and the gene expression matrix was generated by DESeq2 or TPM normalization with or without batch effect adjustment. Then, 90% of all primary AML samples were used for model training by Autogluon with 10 times sampling. (B and C) tSNE visualization for scatters of eight gene expression subgroups predicted in the TCGA LAML (B) and Beat AML (C) cohort. (D and E) Kaplan-Meier curves for overall survival of eight gene expression subgroups in the TCGA LAML (D) and Beat AML (E) cohort. (F) Distribution of age (Upper) and gene expression subgroups (Lower) in the TCGA LAML, Beat AML, and our study cohort. (G) Heatmap shows treatment responses of gene expression subgroups to different small-molecule inhibitors, using the Beat AML ex vivo drug screen data. Drug responses were measured by the scaled AUC in each subgroup as compared with others, with blue and red color indicating sensitivity and resistance, respectively. AUC, area under the dose-response curve; tSNE, t-distributed stochastic neighbor embedding.
Fig. 6.
Fig. 6.
Schematic of molecular alterations and potential therapeutic targets in AML. Accumulation of diverse genomic and transcriptomic aberrations is related to the risk and prognosis of AML. Potential AML-related abnormalities identified in this work are displayed in the cell diagram (cell membrane, cytoplasm, nucleus) including fusion transcripts, genetic mutations, prognostic gene expression and alternative splicing events. Genetic mutations involving activated signaling molecules are common in the cytoplasm and cell membrane. Nuclear regulatory factors may contribute to the instability of the genome resulting in specific genetic mutations and gene expression profiles. Genes with sequence variations are marked with red lightning marks. The known and emerging target therapy agents are also labeled accompanying the target gene or pathway. Venetoclax and Glasdegib are respectively targeting the de-regulated apoptosis pathway gene BCL2 and the Hedgehog pathway SMO. Inhibitors Midostaurin and Gilteritinib can be used to treat FLT3 mutant AMLs. Cellular immunotherapy is another treatment option for AML patients with specific cell surface markers including the Gentuzumab ozogamicin targeting CD33.

References

    1. Newell L. F., Cook R. J., Advances in acute myeloid leukemia. BMJ 375, n2026 (2021). - PubMed
    1. Charrot S., Armes H., Rio-Machin A., Fitzgibbon J., AML through the prism of molecular genetics. Br. J. Haematol. 188, 49–62 (2020). - PubMed
    1. Khoury J. D., The 5th edition of the World Health Organization classification of haematolymphoid tumours: Myeloid and histiocytic/dendritic neoplasms. Leukemia 36, 1703–1719 (2022). - PMC - PubMed
    1. Perl A. E., et al. , Gilteritinib or chemotherapy for relapsed or refractory FLT3-mutated AML. N. Engl. J. Med. 381, 1728–1740 (2019). - PubMed
    1. DiNardo C. D., et al. , Azacitidine and venetoclax in previously untreated acute myeloid leukemia. N. Engl. J. Med. 383, 617–629 (2020). - PubMed

Publication types