. 2022 Dec 6;119(49):e2214935119.
doi: 10.1073/pnas.2214935119. Epub 2022 Nov 29.

CCAR2 functions downstream of the Shieldin complex to promote double-strand break end-joining

Affiliations

CCAR2 functions downstream of the Shieldin complex to promote double-strand break end-joining

Divya Ramalingam Iyer et al. Proc Natl Acad Sci U S A. .

Abstract

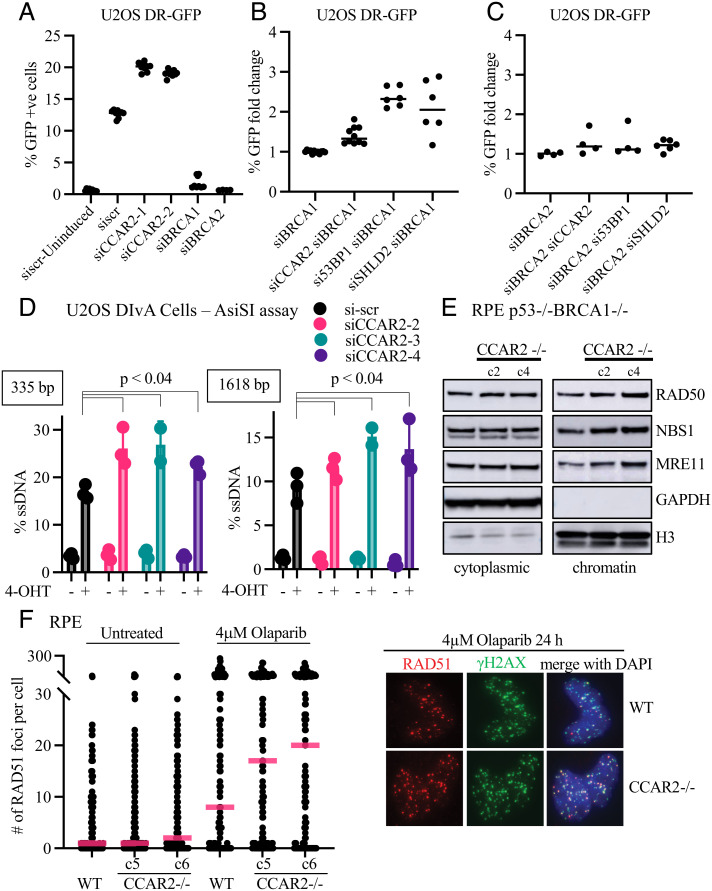
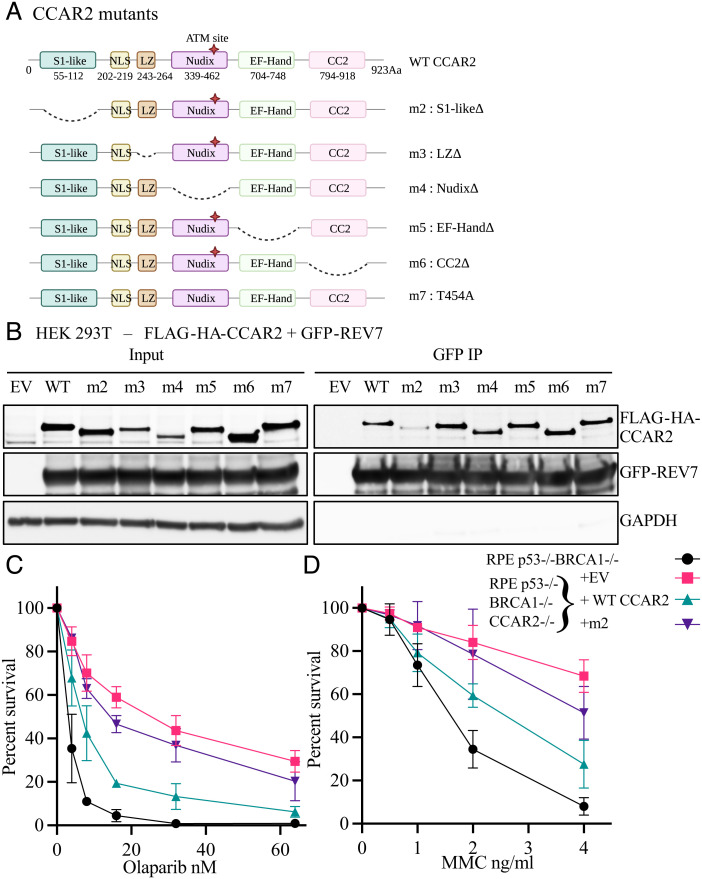
The 53BP1-RIF1 pathway restricts the resection of DNA double-strand breaks (DSBs) and promotes blunt end-ligation by non-homologous end joining (NHEJ) repair. The Shieldin complex is a downstream effector of the 53BP1-RIF1 pathway. Here, we identify a component of this pathway, CCAR2/DBC1, which is also required for restriction of DNA end-resection. CCAR2 co-immunoprecipitates with the Shieldin complex, and knockout of CCAR2 in a BRCA1-deficient cell line results in elevated DSB end-resection, RAD51 loading, and PARP inhibitor (PARPi) resistance. Knockout of CCAR2 is epistatic with knockout of other Shieldin proteins. The S1-like RNA-binding domain of CCAR2 is required for its interaction with the Shieldin complex and for suppression of DSB end-resection. CCAR2 functions downstream of the Shieldin complex, and CCAR2 knockout cells have delayed resolution of Shieldin complex foci. Forkhead-associated (FHA)-dependent targeting of CCAR2 to DSB sites re-sensitized BRCA1-/-SHLD2-/- cells to PARPi. Taken together, CCAR2 is a functional component of the 53BP1-RIF1 pathway, promotes the refill of resected DSBs, and suppresses homologous recombination.

Keywords: 53BP1; CCAR2/DBC1; Shieldin complex; homologous recombination; single nucleotide variants.


Conflict of interest statement

The authors declare no competing interest. A.D.D. reports consulting for Acerand Therapeutics, AstraZeneca, Bayer AG, Blacksmith/Lightstone Ventures, Bristol Myers Squibb, Cedilla Therapeutics, Constellation Pharmaceuticals, Cyteir Therapeutics, EMD Serono, Epizyme, Faze Medicines, GlaxoSmithKline, Impact Therapeutics, LAV Global Management Company Limited, PrimeFour Therapeutics, Patheon Pharmaceuticals, Pfizer, Tango Therapeutics, and Zentalis Pharmaceuticals/Zeno Management; is an Advisory Board member for Cedilla Therapeutics, Cyteir, and Impact Therapeutics; stockholder in Cedilla Therapeutics, Cyteir, Impact Therapeutics, and PrimeFour Therapeutics; and reports receiving commercial research grants from Bristol Myers Squibb, EMD Serono, Moderna, and Tango Therapeutics.

Figures

Fig. 1.
Fig. 1.
CCAR2 Interacts with Shieldin and its Loss Confers PARPi and MMC resistance in BRCA1−/− cells. (A) CCAR2 interacts with REV7. HEK 293T cells were transfected with FLAG-REV7. 48 h after transfection, cells were irradiated with 5 Gy and samples were harvested 1 h post-IR and FLAG IP was performed. Representative images showing co-immunoprecipitation of CCAR2 with REV7. Three biologically independent experiments were performed. (B–D) CCAR2 interacts with SHLD3, SHLD2, and SHLD1. HEK 293T cells transfected with GFP-SHLD3 (B), GFP-SHLD2 (C), or GFP-SHLD1 (D), respectively. Samples were processed for GFP-IP. Representative images showing co-immunoprecipitation of CCAR2 with GFP-SHLD3 (B), GFP-SHLD2 (C), or GFP-SHLD1 (D), respectively. Three biologically independent experiments were performed. (E–F) CCAR2 loss promotes resistance against PARPi and MMC treatment. Cell survival assays were performed with the various CRISPR knockout clones to test sensitivity toward Olaparib (E) and MMC (F). Error bars represent standard deviations between multiple replicates performed with multiple independent knockout clones as listed below. RPE p53−/−BRCA1−/− (n = 7); RPE p53−/−BRCA1−/−CCAR2−/− 3 independent clones (n = 5); RPE p53−/−BRCA1−/−SHLD3−/− 3 independent clones (n = 2); RPE p53−/−BRCA1−/−SHLD2−/− 2 independent clones (n = 2); RPE p53−/−BRCA1−/−CCAR2−/−SHLD3−/− 3 independent clones—2 polyclonal and 1 clonal (n = 2).
Fig. 2.
Fig. 2.
CCAR2 Loss Promotes HR. (A) Loss of CCAR2 promotes HR. Assessment of gene conversion by DR-GFP assay. Effect of CCAR2 knockdown was evaluated using two different siRNAs. BRCA1 and BRCA2 knockdown were used as controls. Data points represent individual values obtained from three independent experiments with three technical replicates in each experiment. (BC) Loss of CCAR2 promotes HR in BRCA1 knockdown. Assessment of gene conversion by DR-GFP assay. Rescue of HR capacity in BRCA1 knockdown (B) and BRCA2 knockdown (C) was assessed by co-depleting either CCAR2, 53BP1, or SHLD2. Multiple siRNA (2–3) were used for CCAR2, 53BP1, and SHLD2. The percentage of GFP-positive cells in each condition was normalized to that from BRCA1 knockdown (B) or BRCA2 knockdown (C) condition. Two independent experiments were performed. Individual values from an experiment are plotted. (D) Loss of CCAR2 promotes DNA end-resection. DNA end-resection was quantified in U2OS DIvA cells depleted of CCAR2 using three different siRNA. DNA end-resection around DSB1 was measured using qPCR as described in Materials and Methods. Three independent experiments were performed with three technical replicates in each. Error bars represent standard deviation between replicates. Statistical analysis was performed using two-tailed unpaired Student’s t test. (E) Loss of CCAR2 increases MRN on the chromatin. RPE p53−/−BRCA1−/− and two independent clones of RPE p53−/−BRCA1−/−CCAR2−/− were subjected to cellular fractionation. The cytoplasmic and chromatin fractions were run on 4–12% SDS-PAGE gel and probed for the indicated proteins. (F) Loss of CCAR2 promotes PARPi-induced RAD51 focus formation. RPE wild-type and two independent RPE CCAR2−/− clones were treated with 4 μM Olaparib for 24 h. After treatment, cells were fixed and stained for γH2AX (green) and RAD51 (red). Number of foci per nuclei were counted using custom scripts on Cell Profiler. More than 100 cells were quantified for each condition. Two biologically independent experiments were performed. Quantification is represented on the Left panel, and the Right panel shows representative images.
Fig. 3.
Fig. 3.
CCAR2 is an Effector of Shieldin via its S1 Domain. (A) Schematic depiction of all the CCAR2 mutants generated and used in this study. (B) S1-domain of CCAR2 is important for interaction with REV7. HEK 293T cells were co-transfected with GFP-REV7 and full-length FLAG-HA-CCAR2 or various mutants of CCAR2. 48 h after transfection, cells were harvested and processed for GFP immunoprecipitation. Two biologically independent experiments were performed. Representative images showing co-immunoprecipitation of CCAR2 with REV7. (C and D) CCAR2 functions via S1-domain. RPE p53−/−BRCA1−/−CCAR2−/− cells complemented using retrovirus carrying empty vector, full-length CCAR2 or m2 mutant of CCAR2 were seeded for cell survival assays to test sensitivity toward Olaparib (C) or MMC (D). RPE p53−/−BRCA1−/− cells were included as control in the assay. Three biologically independent experiments were performed. Error bars represent standard deviation between replicates.
Fig. 4.
Fig. 4.
CCAR2 is a Downstream Effector of the Shieldin Complex. (A) CCAR2 loss delays IR-induced SHLD3 foci resolution. RPE wild-type and CCAR2−/− cells were transduced with lentivirus carrying GFP-SHLD3. 48 h after transduction, cells were irradiated with 5Gy IR and harvested at various time points (1 h, 4 h, and 8 h) post-IR. Cells were fixed and stained for GFP and γH2AX. Number of foci per nuclei were counted using custom scripts on Cell Profiler. More than 100 cells were quantified for each condition. Two biologically independent experiments were performed. Statistical analysis was performed using two-tailed unpaired Student’s t test. Quantification is represented on the Left panel, and the Right panel shows representative images. (B) CCAR2 functions downstream of the Shieldin complex. RPE p53−/−BRCA1−/−SHLD2−/− c2 clone was complemented using retrovirus carrying empty vector, CCAR2-EGFP-FHA or STN1-EGFP-FHA fusion construct. Cells were seeded for cell survival assay, and sensitivity toward Olaparib was tested. Three biologically independent experiments were performed. Error bars represent standard deviation between replicates. (C) Schematic illustration depicting CCAR2 acting downstream in the 53BP1-Shieldin pathway.
Fig. 5.
Fig. 5.
CCAR2 loss Promotes Signature 3/SNVs in BRCA-Deficient Cancers and Correlates with Poor Patient Survival. (A) CCAR2 loss correlates with increased Signature 3 in patient samples. Ovarian cancer patient samples were sorted based on BRCA1/2 and CCAR2 expression levels as explained in the Methods section. Statistical analysis was performed using the Mann–Whitney test. (B) CCAR2 loss correlates with increased total SNV in patient samples. Ovarian cancer patient samples were sorted based on BRCA1/2 and CCAR2 expression levels as explained in the Methods section. Statistical analysis was performed using the Mann–Whitney test. (C) Schematic showing experimental setup for mutational signature analysis by whole genome sequencing. (D) CCAR2 loss increases Signature 3 attributed SNVs in BRCA1−/− cells. Total number of Signature 3 attributed SNVs were estimated from whole genome sequences of RPE p53−/− BRCA1−/− and RPE p53−/−BRCA1−/−CCAR2−/− cells using GATK3 algorithm. (E and F) Loss of CCAR2 in BRCA1-deficient patients correlates with poor progression- and disease-free survival rates. Breast invasive carcinoma (E) and uterine corpus endometrial carcinoma (F) patients deficient in BRCA1 were selected and further sorted based on CCAR2 expression levels (high and low) as described in the Methods section. Kaplan–Meier survival plots were generated comparing the patients with high and low CCAR2 levels using cBioPortal.

References

    1. Ciccia A., Elledge S. J., The DNA damage response: Making it safe to play with knives. Mol. Cell 40, 179–204 (2010). - PMC - PubMed
    1. Scully R., Panday A., Elango R., Willis N. A., DNA double-strand break repair-pathway choice in somatic mammalian cells. Nat. Rev. Mol. Cell Biol. 20, 698–714 (2019). - PMC - PubMed
    1. Ceccaldi R., Rondinelli B., D’Andrea A. D., Repair pathway choices and consequences at the double-strand break. Trends Cell Biol. 26, 52–64 (2016). - PMC - PubMed
    1. Kieffer S. R., Lowndes N. F., Immediate-early, early, and late responses to DNA double stranded breaks. Front. Genet. 13, 793884 (2022). - PMC - PubMed
    1. Setiaputra D., Durocher D., Shieldin–The protector of DNA ends. EMBO Rep. 20, e47560 (2019). - PMC - PubMed

Publication types