. 2022 Dec 6;119(49):e2212548119.
doi: 10.1073/pnas.2212548119. Epub 2022 Nov 28.

Early microbial exposure shapes adult immunity by altering CD8+ T cell development

Affiliations

Early microbial exposure shapes adult immunity by altering CD8+ T cell development

Cybelle Tabilas et al. Proc Natl Acad Sci U S A. .

Abstract

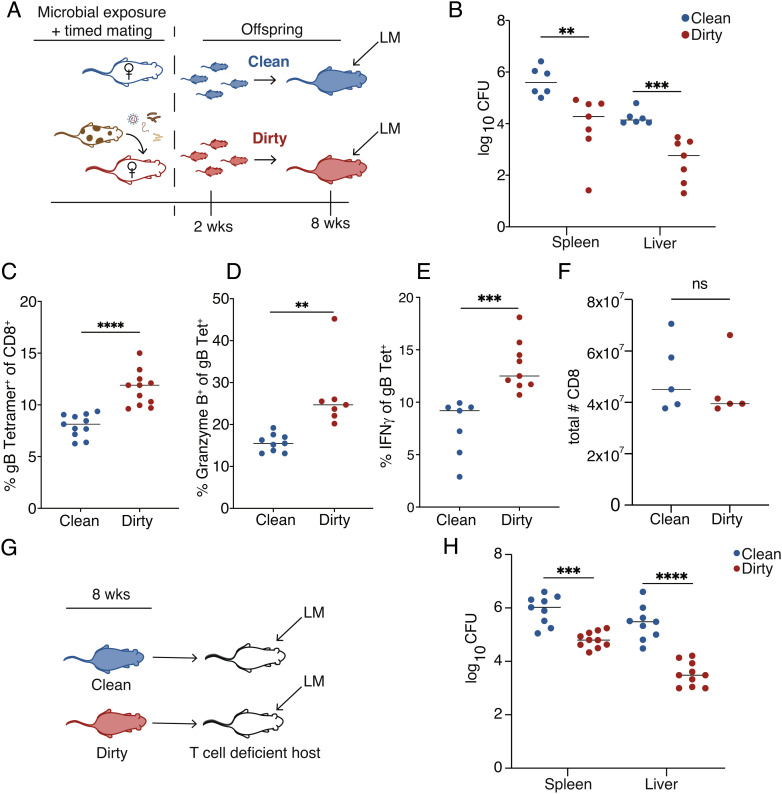
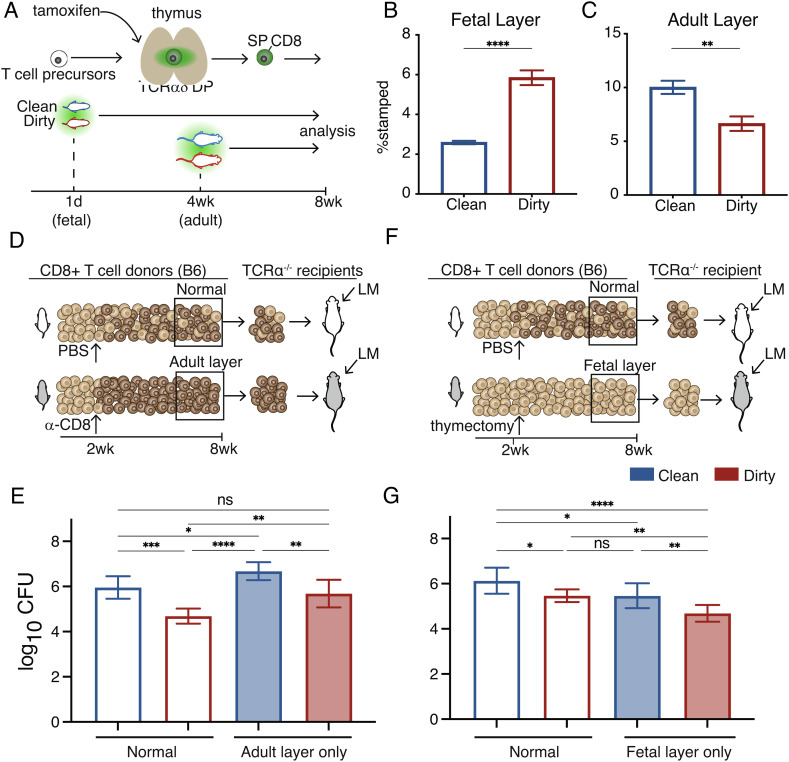
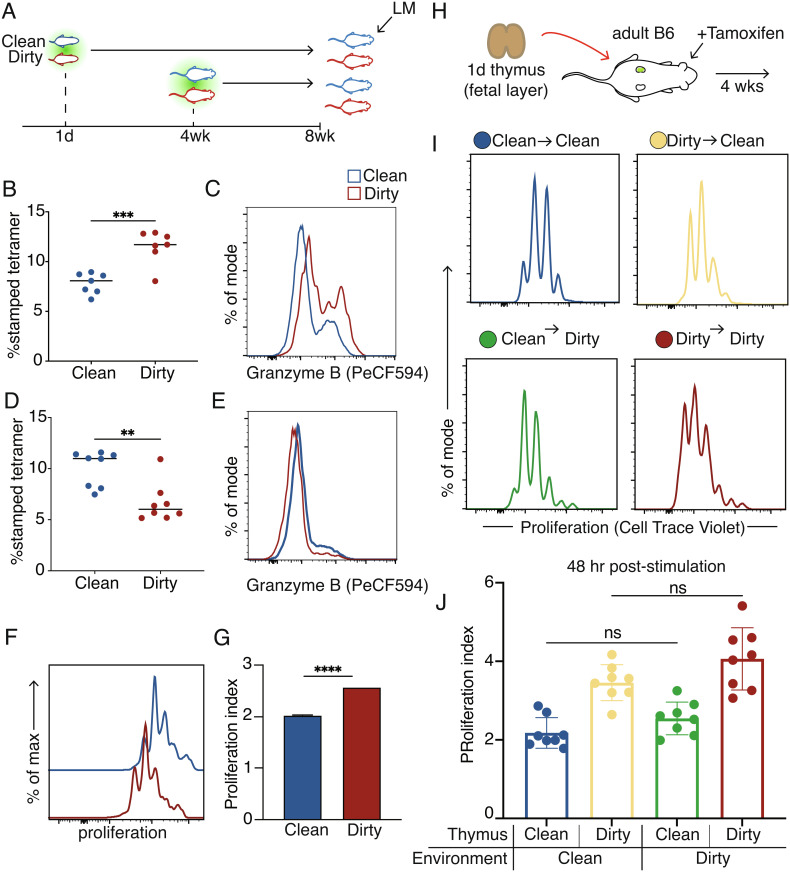
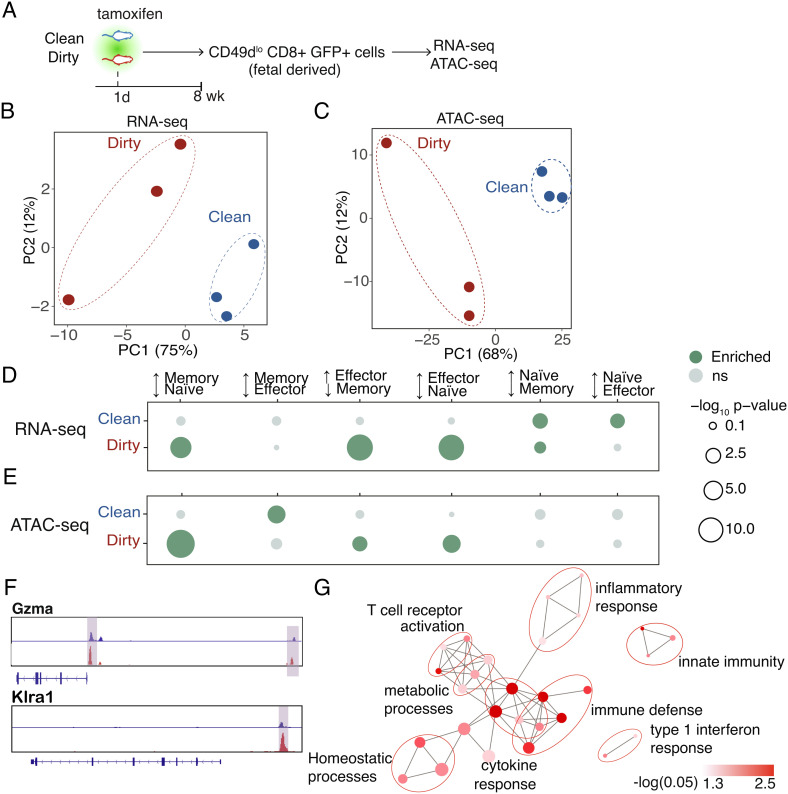
Microbial exposure during development can elicit long-lasting effects on the health of an individual. However, how microbial exposure in early life leads to permanent changes in the immune system is unknown. Here, we show that the microbial environment alters the set point for immune susceptibility by altering the developmental architecture of the CD8+ T cell compartment. In particular, early microbial exposure results in the preferential expansion of highly responsive fetal-derived CD8+ T cells that persist into adulthood and provide the host with enhanced immune protection against intracellular pathogens. Interestingly, microbial education of fetal-derived CD8+ T cells occurs during thymic development rather than in the periphery and involves the acquisition of a more effector-like epigenetic program. Collectively, our results provide a conceptual framework for understanding how microbial colonization in early life leads to lifelong changes in the immune system.

Keywords: CD8+ T cells; developmental layering; developmental origins of adult health and disease; immune training; pet-shop dirty mouse model.


Conflict of interest statement

The authors declare no competing interest.

Figures

Fig. 1.
Fig. 1.
Early microbial exposure enhances immunity in adulthood. (A) Approach to generate dirty mice: Female laboratory mice were exposed to fecal and cage contents of pet-shop mice for 4 wks. Their offspring were maintained in a dirty environment. (B) Bacterial load at 3 d post infection (dpi) in 8-wk-old mice that were directly infected with 1 × 10⁴ CFU of WT LM-gB. (C) Percent of CD8+ T cells that are positive for the Kb:gB498–505 tetramer (D) Granzyme B and (E) interferon-gamma at 5 dpi. (F) Total number of splenic CD8+ T cells. (G) Approach to transfer purified CD8s into T cell-deficient hosts. (H) Bacterial load at 3 dpi from TCRα KO recipients that received 5 × 10⁶ purified CD8s from clean or dirty 8-wk-old donor mice and subsequently infected with LM-gB. Data for B are pooled from two independent experiments (n = 3–4 mice/group) and are ±SEM. Data from C–E are pooled from two independent experiments (n = 4–5 mice/group) and are ±SEM. Data for G are pooled from two independent experiments (n = 4–5 mice/group) and are mean ± SEM. Statistical significance was determined by Student’s t test (ns = not significant, **< 0.005, ***P < 0.0005, ***P < 0.0005, ****< 0.00005).
Fig. 2.
Fig. 2.
Expansion of the fetal layer drives enhanced protection in dirty mice. (A) Approach to timestamp the fetal and adult layers in clean and dirty mice. (B) The proportion of fetal- and (C) adult-derived CD8+ T cells in 8-wk-old clean and dirty mice. (D) Schematic showing the approach to deplete the fetal layer. (E) Pathogen burden in clean and dirty mice lacking the fetal layer of CD8+ T cells. (F) Schematic showing the approach to prevent the adult layer from forming. (G) Pathogen burden in clean and dirty mice lacking the adult layer of CD8+ T cells. Data for B and C are ±SEM and are pooled from two independent experiments (n = 3–4 mice/group). Data for E and G are mean ± SEM and are pooled from two independent experiments (n = 3–4 mice/group). Statistical significance for B and C was determined by Student’s t test. Significance for E and F was determined by a one-way ANOVA with a Tukey multiple comparison posttest (ns = not significant, *< 0.05, **< 0.005, ***< 0.0005, ****< 0.00005).
Fig. 3.
Fig. 3.
Fetal-derived cells in the dirty environment are more responsive to stimulation. (A) Approach to infect clean or dirty timestamp mice with Listeria. (B) The proportion of antigen-specific fetal-derived cells at 5 d post-LM infection. (C) Representative histogram showing Granzyme B production after infection in fetal-derived cells. (D) The proportion of antigen-specific adult-derived CD8+ T cells at 5 d post-LM infection. (E) Representative histogram showing Granzyme B production in adult-derived cells. (F) Representative histograms of proliferation peaks after aCD3/28 activation. (G) Division index of clean or dirty fetal-derived cells. (H) Experimental approach for kidney capsule thymic transplant surgeries. (I) Representative proliferation peaks 48 h after in vitro activation with aCD3/CD28. (J) Division index of fetal-derived cells after aCD3/28 stimulation. Data for and D are ±SEM and are pooled from two independent experiments (n = 3–4 mice/group). Statistical significance for and D was determined by Student’s t test. Statistical significance for J was determined by a one-way ANOVA with a Tukey multiple comparison posttest (ns = not significant, **< 0.005, *** < 0.0005).
Fig. 4.
Fig. 4.
Dirty fetal-derived cells lose their naive programming. (A) Schematic of sorting strategy. (B) Principal component analysis of genome-wide sequencing from RNA- and (C) ATAC-sequencing data sets. (D) Enrichment analysis for various CD8+ T cell states in genes with increased expression and/or (E) increased accessibility in clean and dirty cells. (F) Genome browser views of a dirty-upregulated gene and a dirty-poised gene. (G) Enrichment analysis for GO “biological process” terms in dirty-poised genes. Pathways are connected if they share 30% or more genes. Node sizes denote gene set sizes. Statistical significance of differential expression and differential accessibility was determined by the Wald test (D) and quasilikelihood F test (E) with Benjamini–Hochberg correction (P < 0.05). Corrected P-values for enrichment or depletion denoted by dot size and color. Enrichment values in D and F were determined by a hypergeometric test followed by Benjamini–Hochberg correction. (P < 0.05).

References

    1. Darabi B., Rahmati S., HafeziAhmadi M. R., Badfar G., Azami M., The association between caesarean section and childhood asthma: An updated systematic review and meta-analysis. Allergy Asthma Clin. Immunol. 15, 62 (2019), 10.1186/s13223-019-0367-9. - DOI - PMC - PubMed
    1. Ege M. J., et al. , Prenatal exposure to a farm environment modifies atopic sensitization at birth. J. Allergy Clin. Immunol. 122, 407–412, 412 e401–404 (2008), 10.1016/j.jaci.2008.06.011. - DOI - PubMed
    1. Kirjavainen P. V., et al. , Farm-like indoor microbiota in non-farm homes protects children from asthma development. Nat. Med. 25, 1089–1095 (2019), 10.1038/s41591-019-0469-4. - DOI - PMC - PubMed
    1. Kronman M. P., Zaoutis T. E., Haynes K., Feng R., Coffin S. E., Antibiotic exposure and IBD development among children: A population-based cohort study. Pediatrics 130, e794–803 (2012), 10.1542/peds.2011-3886. - DOI - PMC - PubMed
    1. Bateson P., et al. , Developmental plasticity and human health. Nature 430, 419–421 (2004), 10.1038/nature02725. - DOI - PubMed

Publication types