. 2022 Dec 6;119(49):e2203071119.
doi: 10.1073/pnas.2203071119. Epub 2022 Nov 28.

The multifaceted role of GCM1 during trophoblast differentiation in the human placenta

Affiliations

The multifaceted role of GCM1 during trophoblast differentiation in the human placenta

Mariyan J Jeyarajah et al. Proc Natl Acad Sci U S A. .

Erratum in

Abstract

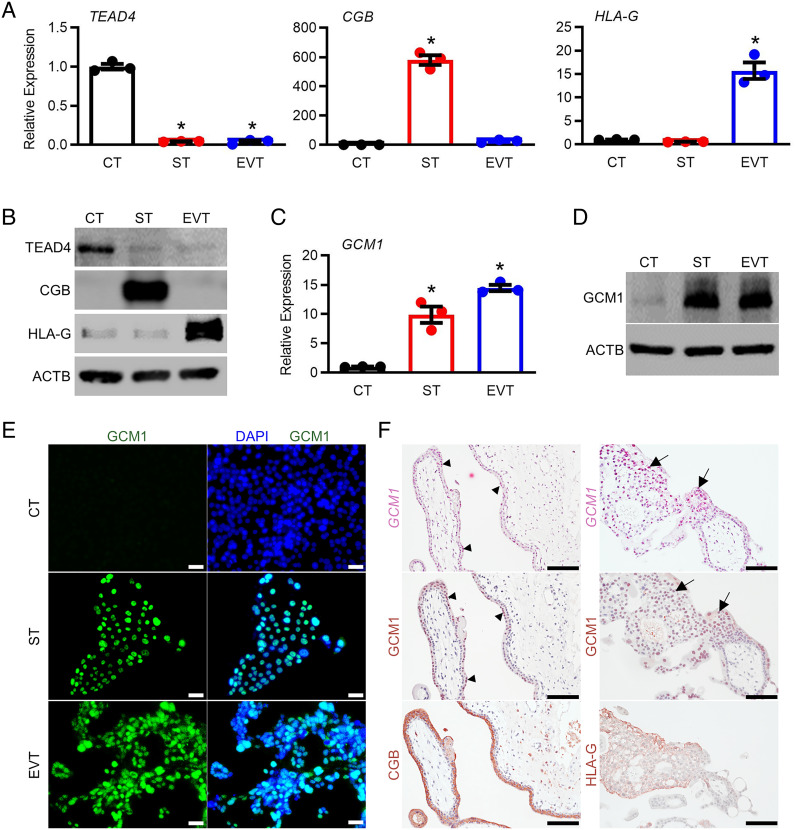
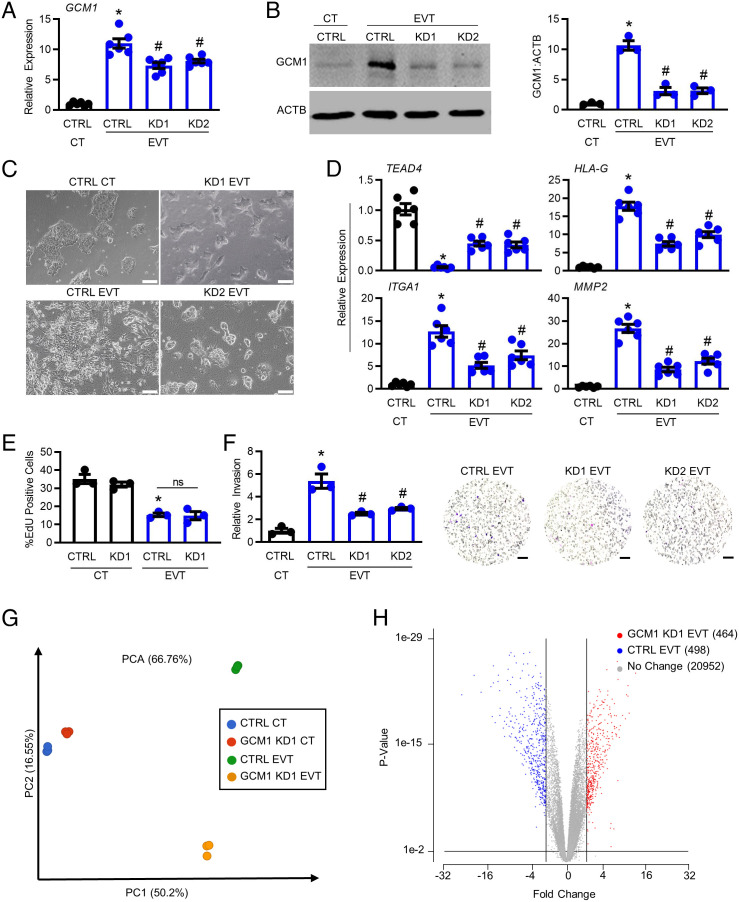
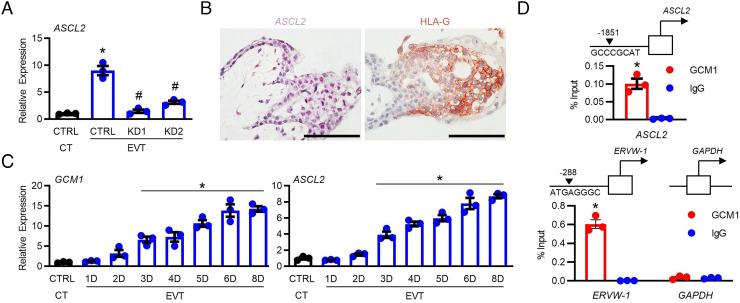
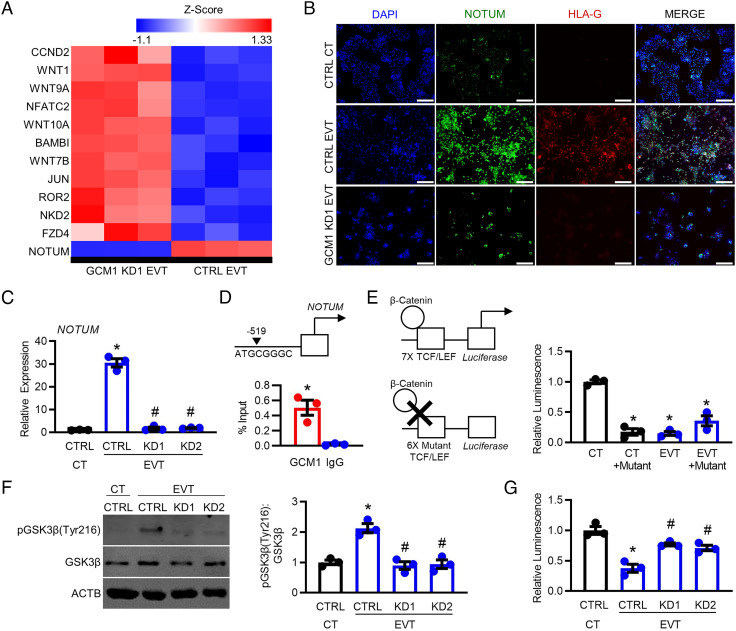
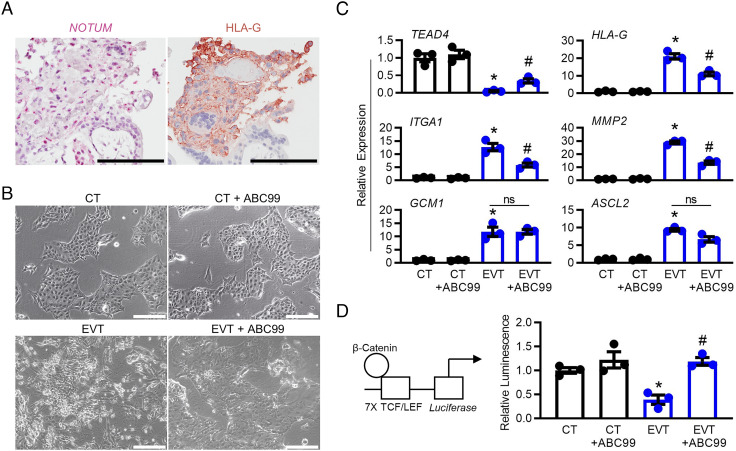
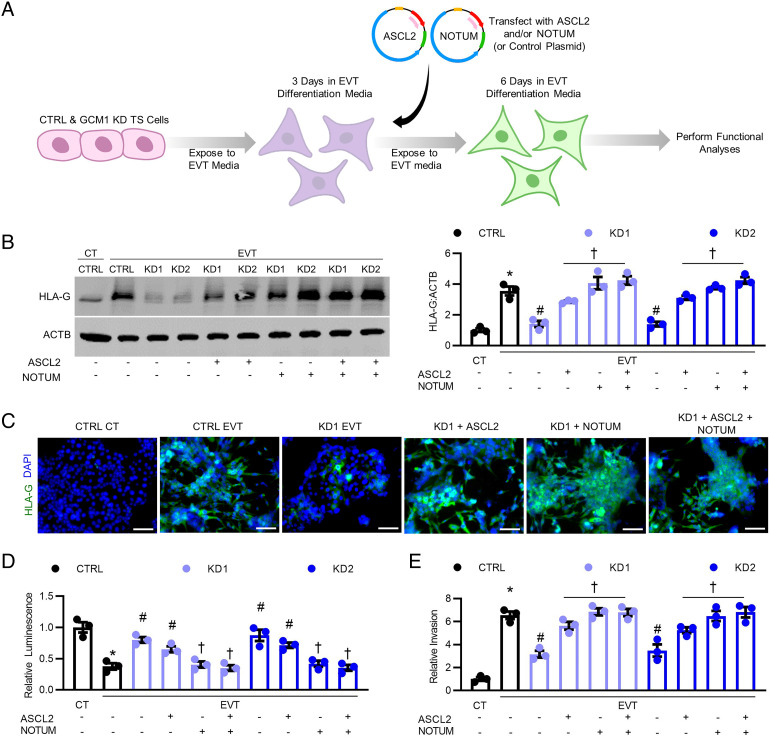
Remodeling of the uterine vasculature by invasive extravillous trophoblasts (EVTs) is a critical aspect of human placentation. Insufficient EVT invasion can lead to severe obstetrical complications like preeclampsia, intrauterine growth restriction, and preterm birth. Glial cells missing-1 (GCM1) is a transcription factor that is crucial for proper placentation in mice, and is highly expressed in human syncytiotrophoblast (ST) and EVTs. GCM1 is classically considered a master regulator of ST formation, but little is known about its contribution to the development and function of EVTs. Therefore, in this study we test the hypothesis that GCM1 is a critical regulator of both EVT and ST development and function. We show that GCM1 is highly expressed in human trophoblast stem (TS) cells differentiated into either ST or EVTs. Knockdown of GCM1 in TS cells hindered differentiation into both ST and EVT pathways. When placed in ST media, GCM1-knockdown cells formed small, unstable clusters; when placed in EVT media, cells had altered morphology and transcript profiles resembling cells trapped in an intermediate state between CT and EVT, and invasive capacity through matrix was reduced. RNA sequencing analysis of GCM1-deficient TS cells revealed downregulation of EVT-associated genes and enrichment in transcripts related to WNT signaling, which was linked to decreased expression of the EVT master regulator ASCL2 and the WNT antagonist NOTUM. Our findings reveal an essential role of GCM1 during ST and EVT development, and suggest that GCM1 regulates differentiation of human TS cells into EVTs by inducing expression of ASCL2 and NOTUM.

Keywords: differentiation; placenta; pregnancy; stem cells; trophoblast.


Conflict of interest statement

The authors declare no competing interest.

Figures

Fig. 1.
Fig. 1.
GCM1 is expressed in human ST and EVTs. (A) Quantitative RT-PCR and (B) Western blot analysis of CT (TEAD4), ST (CGB), and EVT (HLA-G) markers in TS cells (CT30) maintained in CT stem state, or differentiated to ST or EVTs. (C) Quantitative RT-PCR, (D) Western blot and (E) immunofluorescence for GCM1 (green) in TS cells in CT stem state, or differentiated to ST or EVTs. ACTB was used as a loading control for Western blotting. DAPI was used to demarcate nuclei. (F) In situ hybridization (pink dots) and immunohistochemistry (brown) for GCM1 in 7-wk human placenta. Immunohistochemistry for CGB and HLA-G (brown) was used to demarcate ST and EVT, respectively. Arrowheads show GCM1-positive cells in the ST layer; arrows show representative EVTs positive for GCM1. Values significantly different from CT are indicated with an asterisk (*, N = 3, P < 0.05). (Scale bar, 100 µm.)
Fig. 2.
Fig. 2.
GCM1 is required for EVT development. (A) Quantitative RT-PCR and (B) Western blot analysis showing GCM1 expression in control (CTRL) and two distinct GCM1 knockdown (KD1 and KD2) TS cells differentiated into EVTs. ACTB was used as a loading control for Western blotting. (C) Phase-contrast images depicting CTRL, GCM1 KD1, and GCM1 KD2 cells. (D) Quantitative RT-PCR analysis showing expression of one CT marker (TEAD4) and three EVT markers (HLA-G, ITGA1, and MMP2) in CTRL, GCM1 KD1, and GCM1 KD2 TS cells differentiated into EVTs. (E) Quantification of percent EdU-positive nuclei in CTRL and GCM1 KD1 TS cells in CT stem state, or differentiated into EVTs for 6 d. (F) Relative number of CTRL, GCM1 KD1, and GCM1 KD2 TS cells that invaded through Matrigel following differentiation into EVTs. Representative images of invaded cells are found to the right of the graph. Membrane pores are the black circles, cells are stained purple. (G) Principal component analysis showing relationship between replicates of CTRL and GCM1 KD1 cells cultured in CT or EVT media, using all expressed genes as input. Please note that CTRL and KD1 cells cluster close together in CT media, but diverge when cultured in EVT media. (H) Volcano plot showing the number of unique transcripts identified in RNAseq analysis. Transcripts up-regulated in GCM1 KD1 EVTs relative to CTRL EVTs are shown in red (fold change ≥ 2, P < 0.01), and down-regulated transcripts are shown in blue. The X-axis represents magnitude of fold change, and the Y-axis shows the P-value. Values significantly different between CTRL CT and CTRL EVT are indicated with an asterisk (*, P < 0.05), and values significantly different between CTRL EVT and GCM1 KD EVT are indicated with a number sign (#, P < 0.05); ns = not statistically significant. N = 6 for (A) and (D), all other panels are N = 3. (Scale bar, 100 µm.)
Fig. 3.
Fig. 3.
GCM1 regulates ASCL2 expression. (A) Quantitative RT-PCR analysis showing expression of ASCL2 in control (CTRL) and GCM1 knockdown (KD1 and KD2) cells, differentiated to form EVTs. (B) In situ hybridization (pink dots) and immunohistochemistry (brown) for ASCL2 and HLA-G in 7-wk human placenta, respectively. (C) Quantitative RT-PCR analysis showing GCM1 and ASCL2 expression in TS cells in CT stem state or placed in EVT media over an 8-d period. (D) ChIP was performed for GCM1 or IgG (negative control) in lysates of cells cultured in EVT media for 3 d, followed by quantitative PCR to detect enrichment 1,851 bp upstream of ASCL2. An established GCM1-binding site 288 bp upstream of ERVW-1 was used as a positive control; an 87-bp product adjacent to the transcription start site of GAPDH that does not contain a GCM1 consensus-binding site was used as a negative control. In (A), values significantly different between CTRL CT and CTRL EVT are indicated with an asterisk (*, N = 3, P < 0.05), and values significantly different between CTRL EVT and GCM1 KD EVT are indicated with a number sign (#, N = 3, P < 0.05). In (C), values significantly different from CT are shown using an asterisk (*, N = 3, P < 0.05). In (D), statistical differences are shown using an asterisk (*, N = 3, P < 0.05). (Scale bar, 100 µm.)
Fig. 4.
Fig. 4.
WNT signaling is up-regulated in GCM1-deficient TS cells. (A) Heat map showing Z-score values of Least Squares Means for select genes associated with WNT signaling (path:hsa04310) in control (CTRL) and GCM1 knockdown 1 (KD1) cells cultured in EVT media as determined using RNAseq analysis. Colors represent scaled expression values with blue representing low expression and red showing high expression. (B) Immunofluorescence for NOTUM (green) and HLA-G (red) in CTRL and GCM1 KD1 TS cells differentiated into EVTs. DAPI was used to detect nuclei (blue). (C) Quantitative RT-PCR analysis showing NOTUM expression in CTRL and GCM1 KD1 and KD2 TS cells cultured in EVT media. (D) ChIP was performed for GCM1 or IgG (negative control) in lysates of human TS cells cultured in EVT media for 3 d, followed by quantitative PCR to detect enrichment 519 bp upstream of NOTUM. (E) TCF/LEF reporter assay to detect WNT/β-catenin activity in TS cells cultured in CT stem state or in EVT media. Schematics of reporter plasmids can be found to the left of the graph. (F) Western blot analysis of pGSK3β(Tyr216) and total GSK3β in CTRL and GCM1 KD1 and KD2 TS cells cultured in EVT media. ACTB was used as a loading control for Western blotting. (G) TCF/LEF reporter assay showing relative luminescence in CTRL and GCM1 KD1 and KD2 TS cells cultured in EVT media. In (D) and (E), statistical differences are indicated with an asterisk (*, N = 3, P < 0.05). In (C), (F), and (G), values significantly different between CTRL CT and CTRL EVT are indicated with an asterisk (*, N = 3, P < 0.05), and values significantly different from CTRL EVT and GCM1 KD EVT are indicated with a number sign (#, N = 3, P < 0.05). (Scale bar, 100 µm.)
Fig. 5.
Fig. 5.
Inhibition of NOTUM leads to increased WNT signaling and poor EVT development. (A) In situ hybridization for NOTUM (pink dots) and immunohistochemistry for HLA-G (brown) in 7-wk human placenta. (B) Phase-contrast images depicting control (DMSO-treated) and ABC99-treated (NOTUM inhibitor; 5 mM) TS cells cultured in CT or EVT media. (C) Quantitative RT-PCR analysis showing expression of CT (TEAD4) and five EVT markers (HLA-G, ITGA1, MMP2, GCM1, and ASCL2) in TS cells cultured in CT or EVT media in the presence or absence of ABC99. (D) TCF/LEF reporter assay showing relative luminescence in TS cells cultured in CT or EVT media with or without ABC99. Visual of reporter plasmid can be found to the left of the graph. Values significantly different from DMSO-treated CT are indicated with an asterisk (*, N = 3, P < 0.05) and values significantly different between DMSO-treated and ABC99-treated cells cultured in EVT media are indicated with a number sign (#, N = 3, P < 0.05); ns = not statistically significant. (Scale bars, 100 µm.)
Fig. 6.
Fig. 6.
Overexpression of ASCL2 and/or NOTUM in GCM1-deficient cells restores EVT differentiation. (A) Schematic depicting experimental approach. (B) Western blot analysis for HLA-G in control (CTRL) and GCM1 knockdown (KD1 and KD2) TS cells transfected with either control or ASCL2 and/or NOTUM expression plasmids and cultured in EVT differentiation media. ACTB was used as a loading control for Western blotting. (C) Immunofluorescence for HLA-G (green) in CTRL and GCM1 KD1 TS cells cultured in either CT or EVT differentiation media and transfected with either a control plasmid or ASCL2 and/or NOTUM expression plasmids. DAPI was used to demarcate nuclei (blue). Similar results were obtained using GCM1 KD2 cells. (D) TCF/LEF reporter assay showing relative luminescence in CTRL and GCM1 KD1 and KD2 TS cells cultured in CT or EVT media and transfected with either a control plasmid or ASCL2 and/or NOTUM expression plasmids. (E) Relative invasion of CTRL and GCM1 KD1 and KD2 TS cells transfected with either control or ASCL2 and/or NOTUM expression plasmids and cultured in EVT differentiation media. Values significantly different between CTRL CT and CTRL EVT are indicated with an asterisk (*, N = 3, P < 0.05); a number sign (#, N = 3, P < 0.05) denotes values significantly different between CTRL EVT and GCM1 KD EVTs; and a dagger (†, N = 3, P < 0.05) denotes values significantly different between GCM1 KD EVTs transfected with plasmids encoding ASCL2 and/or NOTUM compared with GCM1 KD EVTs transfected with a control plasmid. (Scale bar, 100 µm.)
Fig. 7.
Fig. 7.
Schematic depicting the role of GCM1 in human trophoblast development.

Similar articles

Cited by

References

    1. Turco M. Y., Moffett A., Development of the human placenta. Development 146, 22 (2019). - PubMed
    1. Baines K. J., Renaud S. J., Transcription factors that regulate trophoblast development and function. Prog. Mol. Biol. Transl. Sci. 145, 39–88 (2017). - PubMed
    1. Jaremek A., Jeyarajah M. J., Jaju Bhattad G., Renaud S. J., Omics approaches to study formation and function of human placental syncytiotrophoblast. Front. Cell Dev. Biol. 9, 1543 (2021). - PMC - PubMed
    1. Renaud S. J., Jeyarajah M. J., How trophoblasts fuse: An in-depth look into placental syncytiotrophoblast formation. Cell. Mol. Life Sci. 79, 433 (2022). - PMC - PubMed
    1. Pollheimer J., Vondra S., Baltayeva J., Beristain A. G., Knöfler M., Regulation of placental extravillous trophoblasts by the maternal uterine environment. Front. Immunol. 9, 2597 (2018). - PMC - PubMed

Publication types

Grants and funding