. 2023 Feb 1;22(2):227-239.
doi: 10.1158/1535-7163.MCT-22-0302.

High-Throughput Functional Evaluation of MAP2K1 Variants in Cancer

Affiliations

High-Throughput Functional Evaluation of MAP2K1 Variants in Cancer

Sho Mizuno et al. Mol Cancer Ther. .

Abstract

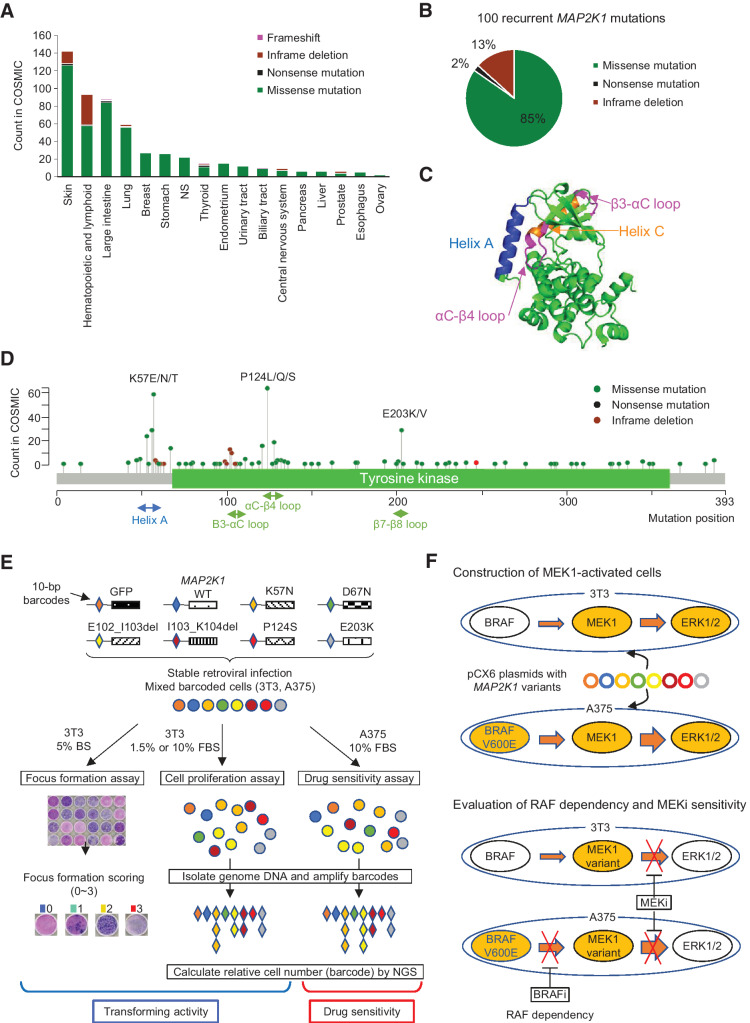
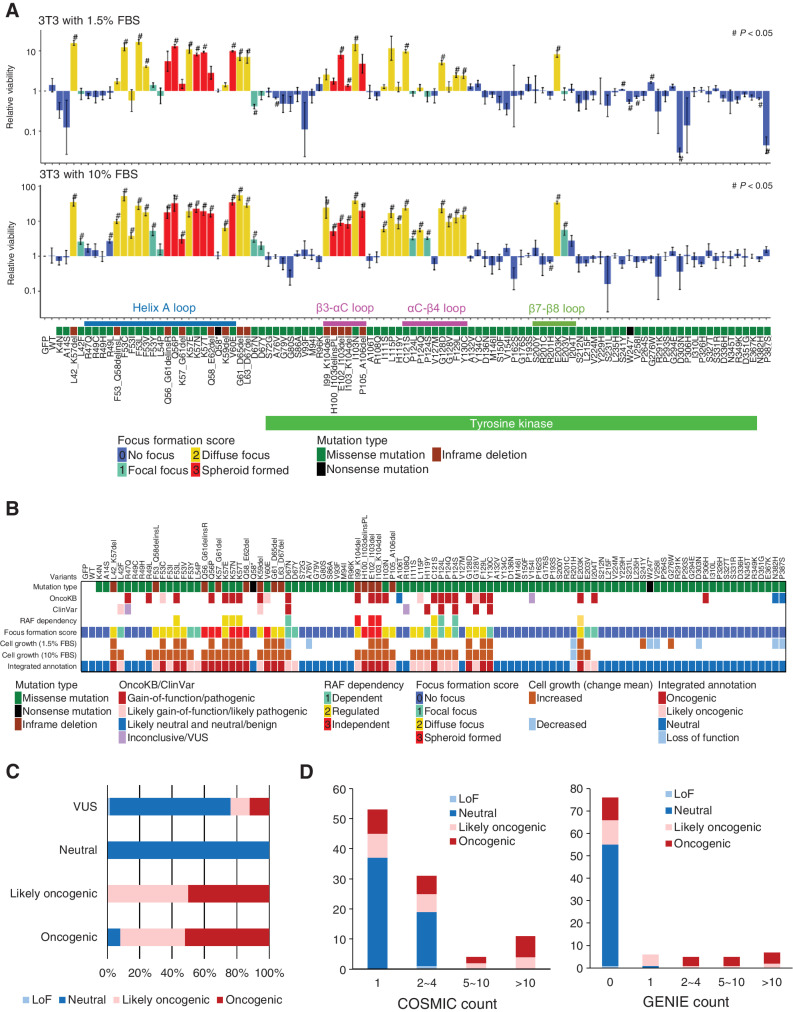
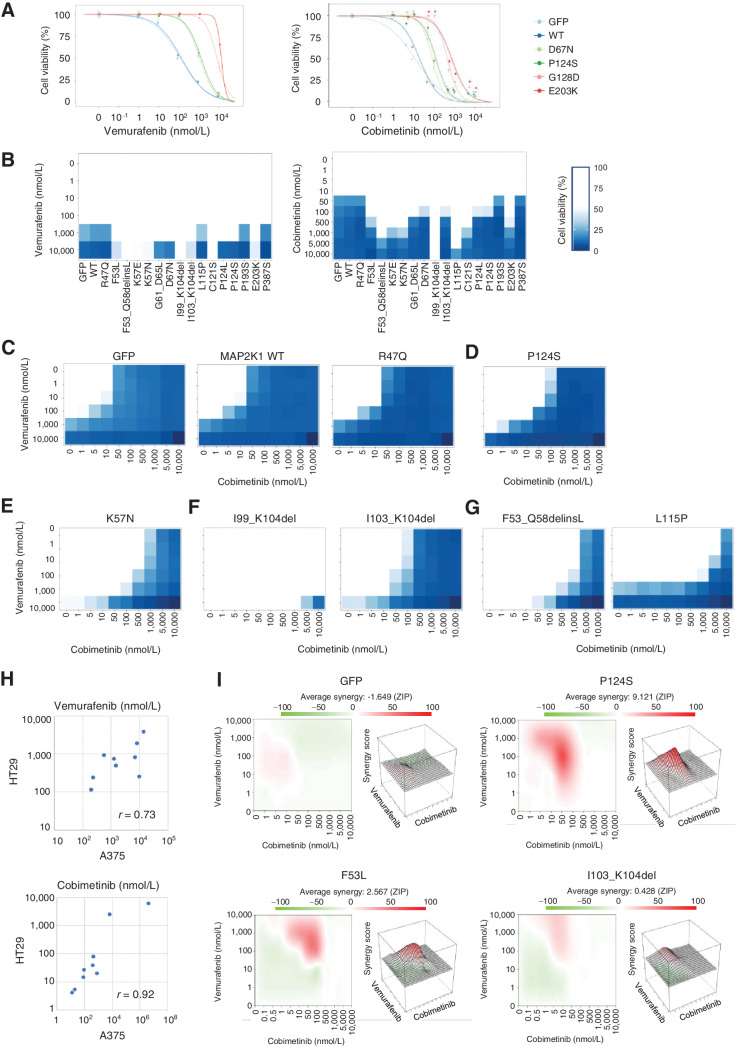
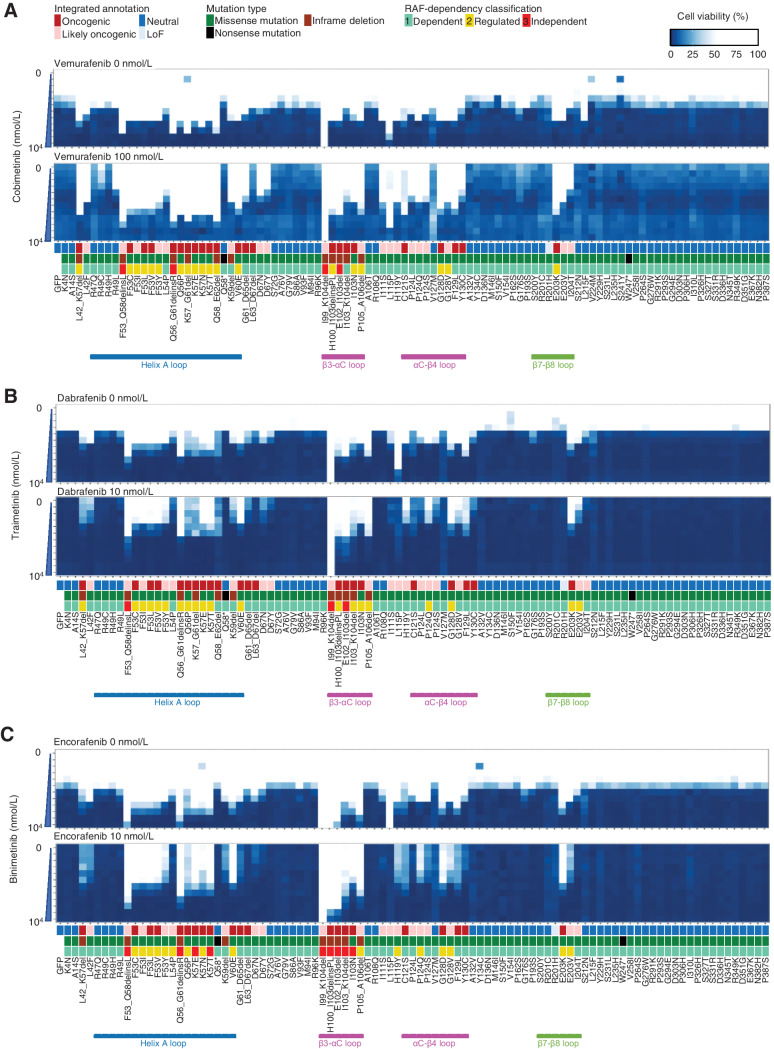
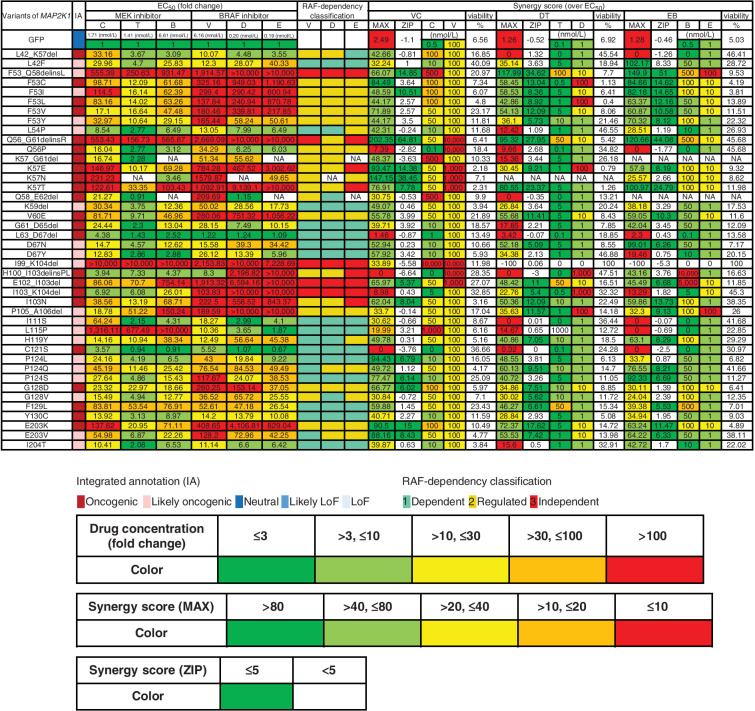
Activating mutations in mitogen-activated protein kinase kinase 1 (MAP2K1) are involved in a variety of cancers and may be classified according to their RAF dependence. Sensitivity to combined BRAF and MEK treatments is associated with co-mutations of MAP2K1 and BRAF; however, the significance of less frequent MAP2K1 mutations is largely unknown. The transforming potential and drug sensitivity of 100 MAP2K1 variants were evaluated using individual assays and the mixed-all-nominated-in-one method. In addition, A375, a melanoma cell line harboring the BRAF V600E mutation, was used to evaluate the function of the MAP2K1 variants in combination with active RAF signaling. Among a total of 67 variants of unknown significance, 16 were evaluated as oncogenic or likely oncogenic. The drug sensitivity of the individual variants did not vary with respect to BRAF inhibitors, MEK inhibitors (MEKi), or their combination. Sensitivity to BRAF inhibitors was associated with the RAF dependency of the MAP2K1 variants, whereas resistance was higher in RAF-regulated or independent variants compared with RAF-dependent variants. Thus, the synergistic effect of BRAF and MEKis may be observed in RAF-regulated and RAF-dependent variants. MAP2K1 variants exhibit differential sensitivity to BRAF and MEKis, suggesting the importance of individual functional analysis for the selection of optimal treatments for each patient. This comprehensive evaluation reveals precise functional information and provides optimal combination treatment for individual MAP2K1 variants.


Figures

Figure 1. Spectrum of MAP2K1 variants, the structure of the MEK1 protein, and a schematic overview of the MANO method. A, Patterns of MAP2K1 mutations in various cancers. The bar charts illustrate the number of tumor samples with MAP2K1 mutations in the COSMIC database for each cancer type. Mutation types are coded in green (missense mutation), black (nonsense mutation), light green (inframe deletion), pink (frameshift). B, circle chart showing the percentage of MAP2K1 mutation types selected in this study. C, Categorization of MEK1 mutations in the crystal structure location. Helix A (blue), Helix-C (orange), β3-αC loop and αC-β4 loop (pink) are highlighted. D, Distribution of MAP2K1 mutations detected in the COSMIC database. E, Schematic representation of the MANO method. 3T3 cells and A375 cells were infected with recombination retrovirus-expressing MAP2K1 variants with individual 10 bp barcodes. The transforming activity of MAP2K1 variants in 3T3 cells was evaluated using a focus formation assay. Equal numbers of stabilized, transduced cells were mixed and cultured with two types of medium in 3T3 cells, or treated with drugs in A375 cells. Genomic DNA was extracted from the cells at the end of each experiment. The barcode sequences were PCR-amplified and subjected to deep sequencing to quantitate the relative abundance. F, Construction of MEK-dependent cells and evaluation of MEKi sensitivity against MEK1 variants. Both cell lines were transfected with MAP2K1 variants by retrovirus using pCX6 plasmid to generate MEK-dependent cell lines. MEK1-dependent 3T3 cells were assessed for drug sensitivity and RAF-dependency and sensitivity to MEKis was evaluated in A375 cells transfected with MAP2K1 variants, with or without RAF inhibitors.
Figure 1.
Spectrum of MAP2K1 variants, the structure of the MEK1 protein, and a schematic overview of the MANO method. A, Patterns of MAP2K1 mutations in various cancers. The bar charts illustrate the number of tumor samples with MAP2K1 mutations in the COSMIC database for each cancer type. Mutation types are coded in green (missense mutation), black (nonsense mutation), light green (inframe deletion), and pink (frameshift). B, Circle chart showing the percentage of MAP2K1 mutation types selected in this study. C, Categorization of MEK1 mutations in the crystal structure location. Helix A (blue), Helix C (orange) as well as β3-αC loop and αC-β4 loop (pink) are highlighted. D, Distribution of MAP2K1 mutations detected in the COSMIC database. E, Schematic representation of the MANO method. 3T3 cells and A375 cells were infected with recombination retrovirus-expressing MAP2K1 variants with individual 10 bp barcodes. The transforming activity of MAP2K1 variants in 3T3 cells was evaluated using a focus formation assay. Equal numbers of stabilized, transduced cells were mixed and cultured with two types of medium in 3T3 cells or treated with drugs in A375 cells. Genomic DNA was extracted from the cells at the end of each experiment. The barcode sequences were PCR-amplified and subjected to deep sequencing to quantitate the relative abundance. F, Construction of MEK-dependent cells and evaluation of MEKi sensitivity against MEK1 variants. Both cell lines were transfected with MAP2K1 variants by retrovirus using pCX6 plasmid to generate MEK-dependent cell lines. MEK1-dependent 3T3 cells were assessed for drug sensitivity and RAF dependency, and sensitivity to MEKis was evaluated in A375 cells transfected with MAP2K1 variants, with or without RAF inhibitors.
Figure 2. Transforming activity and functional annotation of MAP2K1 variants. A, Fold change from day 0 to day 14 (10% FBS; bottom) or day 17 (1.5% FBS; top) of 3T3 cells with respective MAP2K1 variants in the mixed cell population was computed using the MANO method and shown on a logarithmic scale as relative proliferation. Mutations with a relative proliferation significantly different from GFP (#) are shown (paired t test, P < 0.05). The color of the bars indicates the FFS based on the focus formation assay and sorted according to the amino acid position. The error bars quantify the mean fold change across the three replicates and indicate the standard error. B, For each of 100 MAP2K1 variants (at the top of this figure), the mutation types and clinical significance annotated in OncoKB and ClinVar databases are presented in the top 3 rows. Below that, RAF-dependency is shown according to Y. Gao and colleagues (41). Cell growth (1.5% or 10% FBS) is shown by increased (brown) and decreased (light blue) mutations (#) with significant differences in the cell growth assay (shown in Fig. 3A), respectively. C, The oncogenicity evaluated by the method is compared with that of OncoKB. OncoKB annotations are shown at the left of the stacked bar chart. D, The results of the focus formation assay and growth competition assay by the MANO method were summarized to annotate the oncogenicity of the variants according to the classification described in the method. The oncogenicity evaluated by this method is compared with the variant count number of COSMIC or AACR Project GENIE. Error bars indicate SD.
Figure 2.
Transforming activity and functional annotation of MAP2K1 variants. A, Fold change from day 0 to day 14 (10% FBS; bottom) or day 17 (1.5% FBS; top) of 3T3 cells with respective MAP2K1 variants in the mixed cell population was computed using the MANO method and shown on a logarithmic scale as relative proliferation. Mutations with a relative proliferation significantly different from GFP (#) are shown (paired t test, P < 0.05). The color of the bars indicates the FFS based on the focus formation assay and sorted according to the amino acid position. The error bars quantify the mean fold change across the three replicates and indicate the standard error. B, For each of 100 MAP2K1 variants (at the top of this figure), the mutation types and clinical significance annotated in OncoKB and ClinVar databases are presented in the top three rows. Below that, RAF dependency is shown according to Y. Gao and colleagues (41). Cell growth (1.5% or 10% FBS) is shown by increased (brown) and decreased (light blue) mutations (#) with significant differences in the cell growth assay (shown in Fig. 3A), respectively. C, The oncogenicity evaluated by the method is compared with that of OncoKB. OncoKB annotations are shown below the stacked bar chart. D, The results of the focus formation assay and growth competition assay by the MANO method were summarized to annotate the oncogenicity of the variants according to the classification described in the method. The oncogenicity evaluated by this method is compared with the variant count number of COSMIC or AACR Project GENIE. Error bars indicate SD.
Figure 3. The individual sensitivity of MAP2K1 variants to combination therapy of BRAF and MEKi in A375 cells. A, A375 cells transduced with 4 MAP2K1 variants, WT, and GFP were treated with DMSO, a BRAF inhibitor (vemurafenib, right) or a MEKi (cobimetinib, left) at the concentrations indicated for 5 days. Cell viability was measured using the PrestoBlue cell viability assay. The relative viability of the treated cells was measured in comparison with drug-free treatment. Data were plotted as the mean ± SD (n = 3). B, A375 cells transduced with 16 variants, WT, GFP were treated with DMSO, BRAF inhibitor (left) or MEKis (right) for 5 days. The relative viability of the results is illustrated using color shading heatmap compared with drug-free treatment. Data were plotted as the mean ± SD (n = 3). C–G, Results of cell viability assay using combination treatment with two drugs at different concentrations for each individual variant color shading heatmap. C, Parental (GFP) and no function. D, RAF-dependent. E, RAF-regulated. F, RAF-independent. G, others. H, The variant sensitivities evaluated in A375 and HT-29 were well correlated (r = 0.73 for vemurafenib and r = 0.92 for cobimetinib). I, the synergistic effect of the combination therapy of vemurafenib and cobimetinib, and the average synergy of the four variants of GFP, P124S, F53L, and I103_K104del were calculated (Materials and Methods). Those with high synergy are highlighted in red in the 2D figure on the left and are highly represented in the 3D landscape on the right.
Figure 3.
The individual sensitivity of MAP2K1 variants to combination therapy of BRAF and MEK inhibitors in A375 cells. A, A375 cells transduced with four MAP2K1 variants, WT, and GFP were treated with DMSO, a BRAF inhibitor (vemurafenib, right), or a MEKi (cobimetinib, left) at the concentrations indicated for 5 days. Cell viability was measured using the PrestoBlue cell viability assay. The relative viability of the treated cells was measured in comparison with drug-free treatment. Data were plotted as the mean ± SD (n = 3). B, A375 cells transduced with 16 variants, WT, and GFP were treated with DMSO, a BRAF inhibitor (left), or MEKis (right) for 5 days. The relative viability of the results is illustrated using color shading heatmap compared with drug-free treatment. Data were plotted as the mean ± SD (n = 3). C–G, Results of cell viability assay using combination treatment with two drugs at different concentrations for each individual variant color shading heatmap. C, Parental (GFP) and no function. D, RAF dependent. E, RAF regulated. F, RAF independent. G, Others. H, The variant sensitivities evaluated in A375 and HT-29 were well correlated (r = 0.73 for vemurafenib and r = 0.92 for cobimetinib). I, The synergistic effect of the combination therapy of vemurafenib and cobimetinib, and the average synergy of the four variants of GFP, P124S, F53L, and I103_K104del were calculated (Materials and Methods). Those with high synergy are highlighted in red in the 2D figure on the left and are highly represented in the 3D landscape on the right.
Figure 4. The sensitivity of MAP2K1 variants to BRAF and MEKi using the MANO method. A375 cells with MAP2K1 variants, GFP were treated with DMSO or BRAF inhibitors (vemurafenib, dabrafenib, and encorafenib) and MEKis (cobimetinib, trametinib, and binimetinib) at the indicated concentrations. The BRAF and MEKis concentrations were varied by 6 (0 to 10,000 nmol/L) and 12 steps (0 to 10,000 nmol/L), respectively. The relative viability of the treated cells with each drug versus DMSO-treated cells was measured and the results are presented using a color-coded scale. Data are presented as the mean ± SD (n = 3). A, Combination therapy with cobimetinib alone (top) and vemurafenib 100 nmol/L in addition to cobimetinib (bottom). B, Combination therapy with trametinib alone (top) and dabrafenib 10 nmol/L in addition to trametinib (bottom). C, Combination therapy with binimetinib alone (top) and encorafenib 10 nmol/L in addition to trametinib (bottom).
Figure 4.
The sensitivity of MAP2K1 variants to BRAF and MEK inhibitors using the MANO method. A375 cells with MAP2K1 variants, GFP were treated with DMSO or BRAF inhibitors (vemurafenib, dabrafenib, and encorafenib) and MEKis (cobimetinib, trametinib, and binimetinib) at the indicated concentrations. Concentrations of the BRAF and MEK inhibitors were varied by 6 (0 to 10,000 nmol/L) and 12 steps (0 to 10,000 nmol/L), respectively. The relative viability of the treated cells with each drug versus DMSO-treated cells was measured, and the results are presented using a color-coded scale. Data are presented as the mean ± SD (n = 3). A, Combination therapy with cobimetinib alone (top) and vemurafenib 100 nmol/L in addition to cobimetinib (bottom). B, Combination therapy with trametinib alone (top) and dabrafenib 10 nmol/L in addition to trametinib (bottom). C, Combination therapy with binimetinib alone (top) and encorafenib 10 nmol/L in addition to trametinib (bottom).
Figure 5. Assessment of drug sensitivity and synergy for oncogenic MAP2K1 variants. The drug sensitivities of the indicated oncogenic MAP2K1 variant mutants were categorized into five levels; ≤ 3 (green), > 3, ≤ 10 (yellow-green), > 10, ≤ 30 (yellow), > 30, ≤ 100 (orange), and > 100 (red) based on the fold change (to GFP) of the IC50 value for each drug against each mutant. The maximum synergistic effect among the combinations of concentrations above the IC50 was calculated and concentrations of BRAF and MEKis in the case shown on the right side were categorized into five levels; > 80 (green), > 40, ≤ 80 (yellow-green), > 20, ≤ 40 (yellow), > 10, ≤ 20 (orange), and ≤ 10 (red). The concentration of the drug in each case is displayed (nmol/L) and colored on the basis of the fold change of IC50 for GFP. The mean of the synergy effect is shown in the ZIP, where ≥ 5 (green) is defined as having a synergy effect.
Figure 5.
Assessment of drug sensitivity and synergy for oncogenic MAP2K1 variants. The drug sensitivities of the indicated oncogenic MAP2K1 variant mutants were categorized into five levels; ≤ 3 (green); > 3, ≤ 10 (yellow-green); > 10, ≤ 30 (yellow); > 30, ≤ 100 (orange); and > 100 (red) based on the fold change (to GFP) of the IC50 value for each drug against each mutant. The maximum synergistic effect among the combinations of concentrations above the IC50 was calculated and concentrations of BRAF and MEK inhibitors in the case shown on the right side were categorized into five levels; > 80 (green); > 40, ≤ 80 (yellow-green); > 20, ≤ 40 (yellow); > 10, ≤ 20 (orange); and ≤ 10 (red). The concentration of the drug in each case is displayed (nmol/L) and colored on the basis of the fold change of IC50 for GFP. The mean of the synergy effect is shown in the ZIP, where ≥ 5 (green) is defined as having a synergy effect. B, binimetinib; C, cobimetinib; D, dabrafenib; DT, dabrafenib and trametinib; E, encorafenib; EB, encorafenib and binimetinib; EC50, half maximal effective concentration; NA, not applicable; T, trametinib; V, vemurafenib, VC, vemurafenib and cobimetinib.

Comment in

  • 1535-7163. doi: 10.1158/1535-7163.MCT-22-2-HI

References

    1. Balmanno K, Cook SJ. Tumor cell survival signaling by the ERK1/2 pathway. Cell Death Differ 2009;16:368–77. - PubMed
    1. Emery CM, Vijayendran KG, Zipser MC, Sawyer AM, Niu L, Kim JJ, et al. . MEK1 mutations confer resistance to MEK and B-RAF inhibition. Proc Natl Acad Sci USA 2009;106:20411–6. - PMC - PubMed
    1. Dougherty MK, Muller J, Ritt DA, Zhou M, Zhou XZ, Copeland TD, et al. . Regulation of Raf-1 by direct feedback phosphorylation. Mol Cell 2005;17:215–24. - PubMed
    1. Davies H, Bignell GR, Cox C, Stephens P, Edkins S, Clegg S, et al. . Mutations of the BRAF gene in human cancer. Nature 2002;417:949–54. - PubMed
    1. Hodis E, Watson IR, Kryukov GV, Arold ST, Imielinski M, Theurillat JP, et al. . A landscape of driver mutations in melanoma. Cell 2012;150:251–63. - PMC - PubMed

Publication types