. 2023 Jan;613(7945):775-782.
doi: 10.1038/s41586-022-05573-5. Epub 2022 Nov 28.

Structures of the holo CRISPR RNA-guided transposon integration complex

Affiliations

Structures of the holo CRISPR RNA-guided transposon integration complex

Jung-Un Park et al. Nature. 2023 Jan.

Abstract

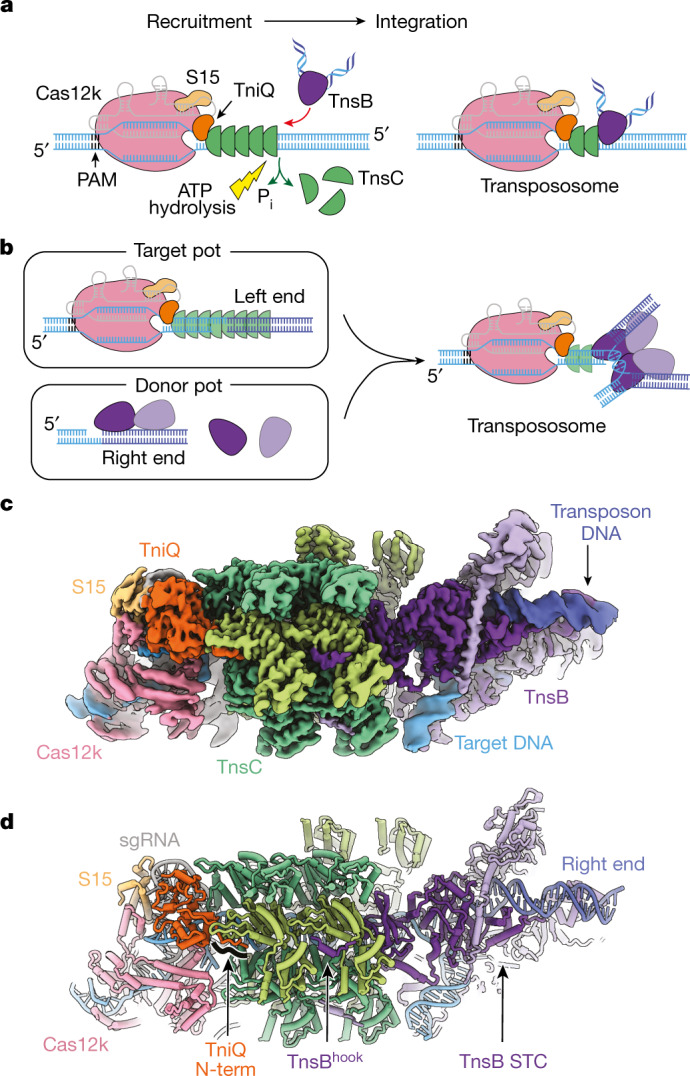
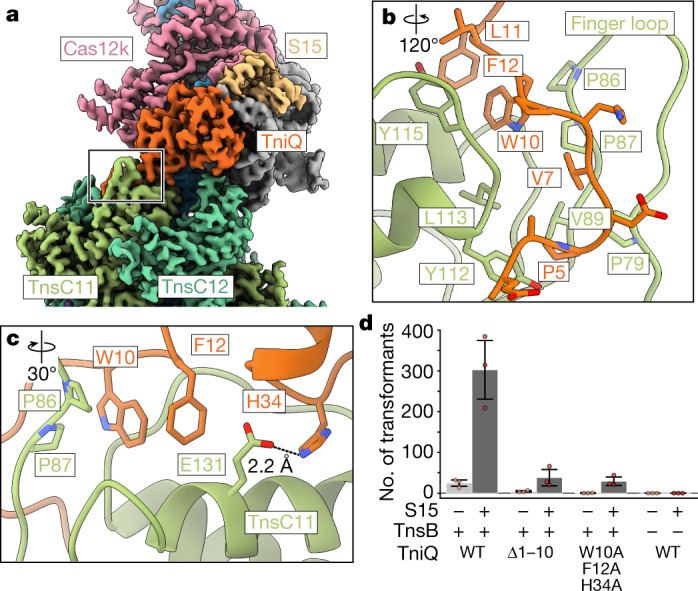
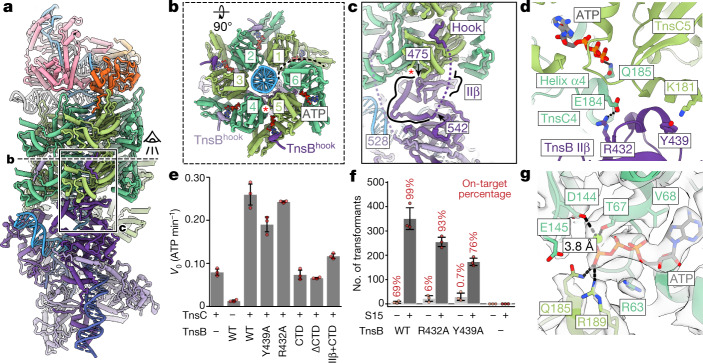
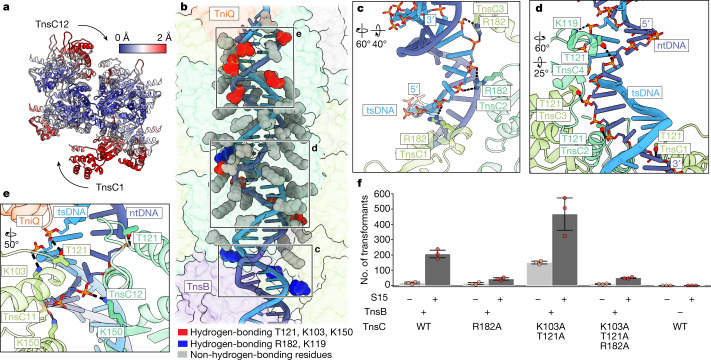
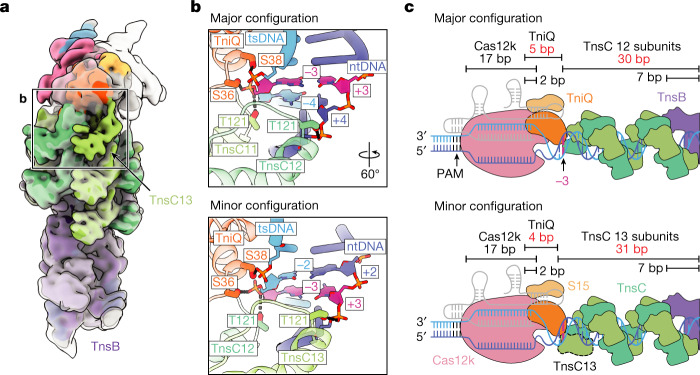
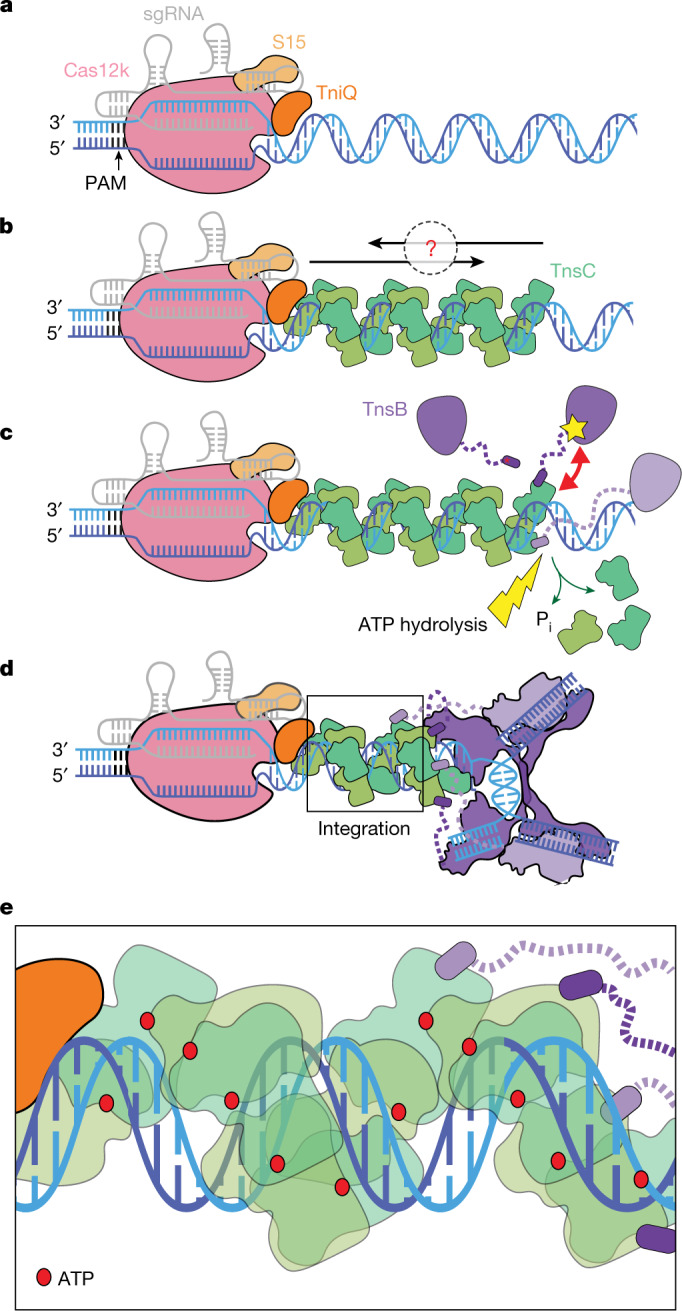
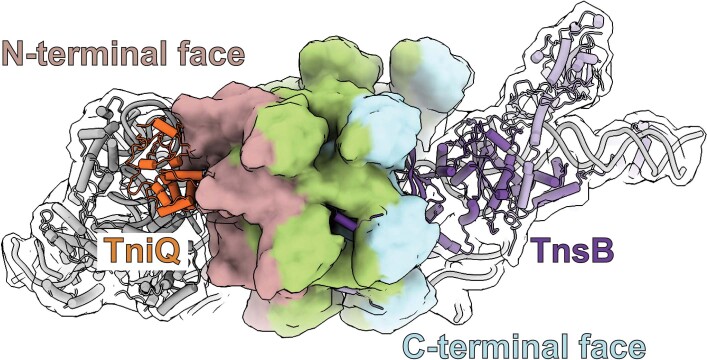
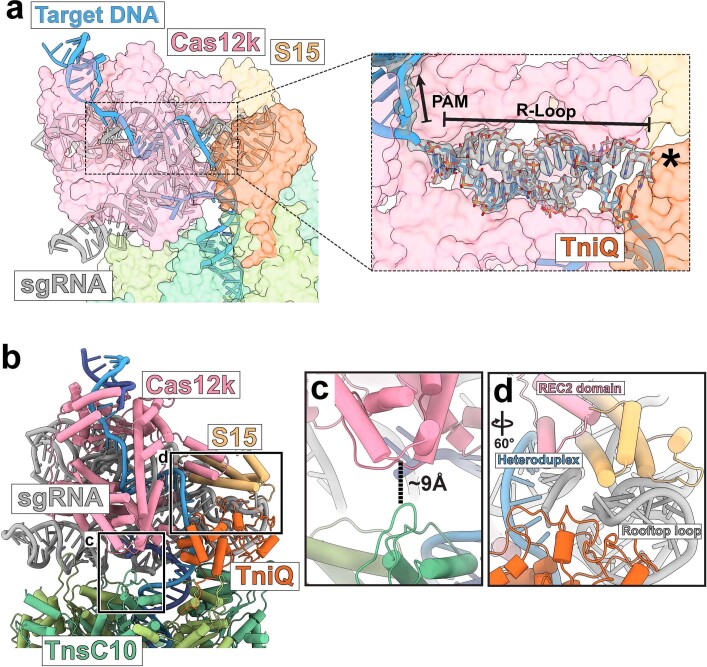
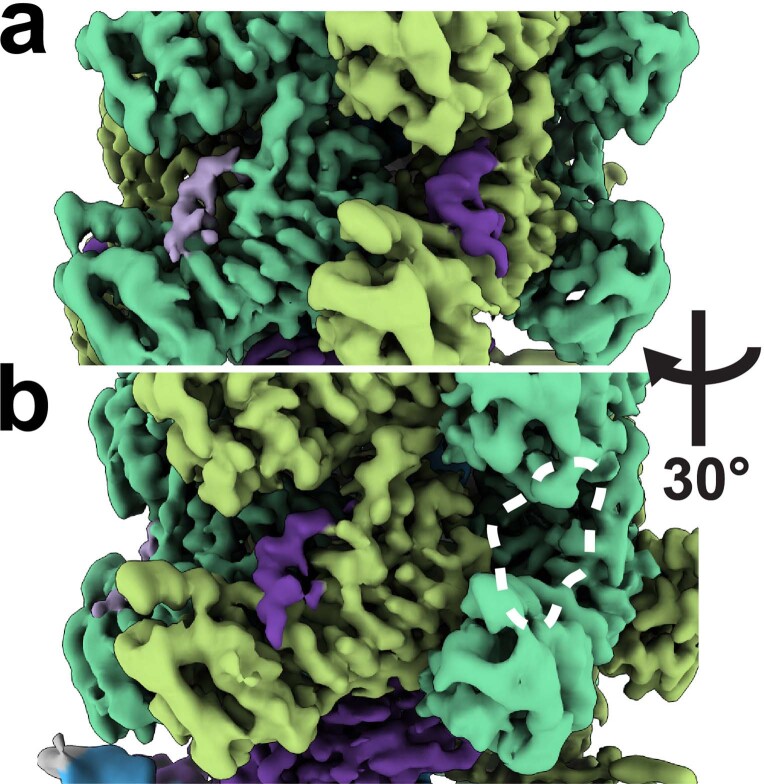
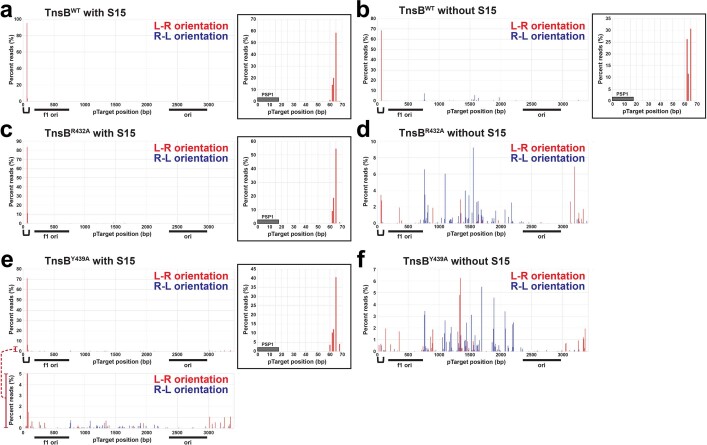
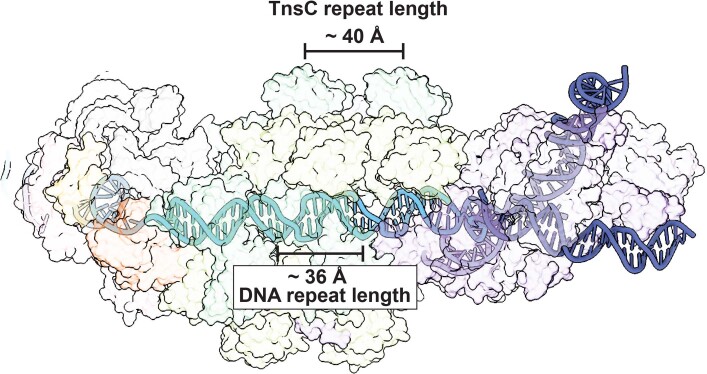
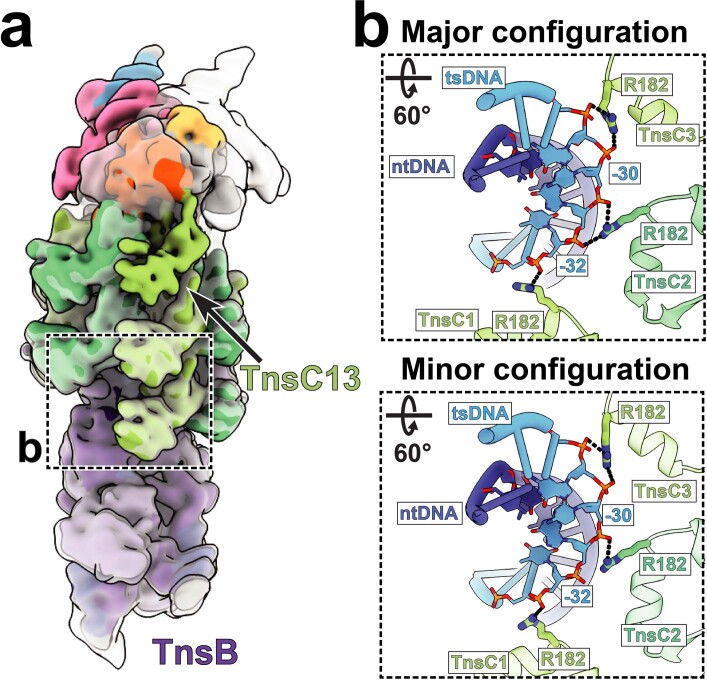
CRISPR-associated transposons (CAST) are programmable mobile genetic elements that insert large DNA cargos using an RNA-guided mechanism1-3. CAST elements contain multiple conserved proteins: a CRISPR effector (Cas12k or Cascade), a AAA+ regulator (TnsC), a transposase (TnsA-TnsB) and a target-site-associated factor (TniQ). These components are thought to cooperatively integrate DNA via formation of a multisubunit transposition integration complex (transpososome). Here we reconstituted the approximately 1 MDa type V-K CAST transpososome from Scytonema hofmannii (ShCAST) and determined its structure using single-particle cryo-electon microscopy. The architecture of this transpososome reveals modular association between the components. Cas12k forms a complex with ribosomal subunit S15 and TniQ, stabilizing formation of a full R-loop. TnsC has dedicated interaction interfaces with TniQ and TnsB. Of note, we observe TnsC-TnsB interactions at the C-terminal face of TnsC, which contribute to the stimulation of ATPase activity. Although the TnsC oligomeric assembly deviates slightly from the helical configuration found in isolation, the TnsC-bound target DNA conformation differs markedly in the transpososome. As a consequence, TnsC makes new protein-DNA interactions throughout the transpososome that are important for transposition activity. Finally, we identify two distinct transpososome populations that differ in their DNA contacts near TniQ. This suggests that associations with the CRISPR effector can be flexible. This ShCAST transpososome structure enhances our understanding of CAST transposition systems and suggests ways to improve CAST transposition for precision genome-editing applications.


Conflict of interest statement

The authors declare no competing interests.

Figures

Fig. 1
Fig. 1. Cryo-EM structure of ShCAST transpososome.
a, Mechanistic model of ShCAST recruitment (left) and integration (right). TnsC (green semicircle) associates with target-site proteins: Cas12k (pink), TniQ (orange) and S15 (tan). The PAM (black) defines the beginning of the protospacer, where Cas12k and single guide RNA (sgRNA) (grey) bind. TnsB (purple) is recruited to the target site through TnsC (red arrow). ATP hydrolysis (yellow lightning bolt) is stimulated by TnsB, resulting in the release of phosphate (Pi) and disassembly of TnsC (green arrows). Upon integration, a nucleoprotein complex containing all CAST components forms at the target site (right). b, Schematic of transpososome sample preparation. Left, the target pot and the donor pot were prepared independently to mimic the process of the RNA-guided transposition. DNA substrates for both the target pot and donor pot have target DNA (light blue) and transposon-end (dark blue) regions that are connected by 5 bp of single-stranded DNA, designed to form a strand-transfer complex (STC) (Methods). The target pot and donor pot include target-site-associated proteins (Cas12k, S15, TniQ and TnsC) and TnsB, respectively, in addition to the corresponding DNA substrate. The transpososome (right) is reconstituted by combining the target and donor pots (Methods). c, The 3.5 Å-resolution cryo-EM reconstruction of the ShCAST transpososome, filtered according to local resolution. Each component in the complex is coloured as in a. Different shades (light or dark green and light or dark purple) indicate different subunits of the protein of the same colour. Target DNA is shown in light blue and transposon DNA is in dark blue. d, The atomic model of the ShCAST transpososome. TniQ N terminus comprises residues 1–10. Right and left refer to the ends of the transposon DNA.
Fig. 2
Fig. 2. TniQ–TnsC interactions are crucial for ShCAST transposition.
a, The composite cryo-EM map was created using two separate reconstructions from the local refinements (Methods). The composite map is coloured as in Fig.1. TnsC protomers are labelled according to their position in the transpososome (TnsC1 is the closest TnsC protomer to TnsB). The outline indicates the TniQ–TnsC interface. b,c, The atomic model of interactions at the TniQ–TnsC interface rotated 120° around the vertical axis (b) and 30° around the horizontal (c) with respect to the outlined region in a. b, The N-terminal tail of TniQ is shown—as sticks—interacting with a hydrophobic cleft created by the finger loop of TnsC. c, Hydrogen-bonding interactions are shown as dashed black lines; distance between the donor and acceptor atoms is indicated. d, TniQ mutations eliminate in vitro transposition activity, consistent with the interactions observed in our transpososome structure. WT, wild type. In vitro transposition activity was monitored by transforming the reaction product into competent cells, and counting the number of transformants after plating on an antibiotic-containing plate (Methods). Data are mean ± s.d. (n = 3 biological triplicates). Raw data points are shown in red.
Fig. 3
Fig. 3. TnsB–TnsC interactions are well defined and contribute to stimulating the ATPase activity of TnsC.
a, An overview of TnsB–TnsC interactions in the transpososome. b, The N-terminal face of the TnsC hexamer closest to TnsB, as indicated in a. TnsC protomers are labelled according to their position (1 indicates the TnsC protomer closest to TnsB). The dashed line indicates where the hexamer ends. TnsBhook peptides bind at TnsC protomers 2–5 and are coloured according to nearest TnsB protomer. The red asterisk indicates where domain IIβ (residues 410–474) associates across 2 TnsC protomers on the C-terminal face of TnsC. c, Side view of TnsB–TnsC interactions, as indicated in a. Residues 475–542 correspond to the additional structured TnsB domain (highlighted with black lines) that is observed to interact between the two TnsC protomers shown in b. The red asterisk indicates the beginning of helix α4. Dotted lines indicate the flexible linker (not observed in our structure). d, TnsB–TnsC interactions near the ATP-binding pocket. Interacting residues are shown and dashed lines represent hydrogen bonds. e, Alterations to TnsB domain IIβ decrease ATP hydrolysis activity. The hydrolysis rate (vo) is shown for each variant. Data are mean ± s.d. (n = 3 biological triplicates). f, In vitro transposition assay testing TnsB mutants in the presence (dark grey) or absence (light grey) of S15. The number of transformants is plotted for each condition tested as a proxy for the transposition activity. Data are mean ± s.d. (n = 3 biological triplicates). Raw data points are shown in red. The on-target percentage of transposition was estimated from Illumina sequencing and indicated on the corresponding bar plot. g, The ATP-binding pocket of TnsC with cryo-EM density (grey with transparent surface), magnesium ion (green sphere) and hydrogen bonds (dashed lines) shown.
Fig. 4
Fig. 4. TnsC forms a network of important interactions with target DNA throughout the transpososome.
a, TnsC protomers are coloured by changes in Cα r.m.s.d. between the helical TnsC (PDB: 7M99) and TnsC in the transpososome. The arrows represent the inward movement of TnsC, starting from the helical filament. b, TnsC–DNA interactions throughout the transpososome. TnsC residues forming hydrogen-bonding interactions with DNA, at least 4 Å away, are represented by red (K103, T121 and K150, previously identified interacting residues) or blue (R182 and K119; newly identified interacting residues) spheres. TnsC residues that are close to, but do not form specific interactions with the DNA backbone, more than 4 Å away, are represented by grey spheres. The target strand DNA (tsDNA) (light blue) and non-target strand DNA (ntDNA) (dark blue) are represented in ribbon. c, TnsB-proximal TnsC protomers interact with the sugar-phosphate backbone of tsDNA. d, TnsB-proximal TnsC protomers are shown to interact with the ntDNA backbone. e, TnsC protomers adjacent to Cas12k interact with both tsDNA and ntDNA immediately downstream of the R-loop. In ce, hydrogen-bonding interactions between protein residues and the sugar-phosphate backbone of DNA are represented with dashed lines. Rotations relative to b are indicated. f, In vitro transposition assay of TnsC residues observed to interact with DNA. Data are mean ± s.d. (n = 3 biological triplicates). Raw data points are shown in red.
Fig. 5
Fig. 5. Two different transpososome configurations differ at the Cas12k-proximal end.
a, The cryo-EM reconstructions (low pass filtered to 10Å) of major and minor configurations of transpososome. The reconstructions were aligned with respect to TnsB, where protein–DNA interactions are identical in the two configurations. The map corresponding to the minor configuration is coloured and opaque, and the major configuration is transparent. The outline indicates TnsC–DNA interactions at the Cas12k face. b, Expanded view of the outlined region in a, showing that major and minor configurations interact with both target-strand DNA (tsDNA) and non-target strand DNA (ntDNA). Residues from TniQ and TnsC in the minor configuration interact with the phosphate backbone that are shifter by 1 bp towards the R-loop compared with the major configuration. Hydrogen-bonding interactions between protein residues and the DNA backbone are represented with dashed lines. Base pairs interacting with the final two protomers of TnsC are represented in stick. Positions three bases downstream of the R-loop (−3 on tsDNA and +3 on ntDNA) are coloured magenta as a landmark, facilitating comparison of the two configurations. c, Schematic of DNA-binding contacts of each component (Cas12k, TniQ and TnsC) in major (top) and minor (bottom) configurations. The number of base pairs contacted by each component is shown and the length is indicated with bar-ended lines. Positions interacting with two protein components (Cas12k and TniQ or TnsC and TnsB) are indicated as overlapping bars. The minor configuration includes and additional TnsC protomer (TnsC13, dashed outline) proximal to Cas12k, which makes the DNA-binding contribution of TniQ and TnsC different in the two configurations (highlighted in red). The third base pair downstream of the R-loop is coloured magenta, as in b.
Fig. 6
Fig. 6. Mechanistic model of recruitment and integration of the transposition components in ShCAST.
a, The CRISPR effector Cas12k (pink) bound to sgRNA (grey) defines the target site by forming an R-loop and associating with S15 (tan) and TniQ (orange). b, TnsC (green) may polymerize on DNA (blue) in two directions: towards or away from the target site (indicated by the black arrows and the question mark). TnsC interacts with target-site-associated proteins (Cas12k–sgRNA, S15 and TniQ) to form the recruitment complex. c, Two interactions between TnsB (purple) and TnsC: TnsB is recruited to TnsC filaments by TnsBhook (purple, indicated with a red asterisk) and domain IIβ (indicated approximately by a yellow star) from TnsB can interact with TnsC (indicated by a red double arrow), lead to disassembly of TnsC and promote ATP hydrolysis (yellow lightning bolt), resulting in the release of phosphate (green arrows). Dashed lines (purple) represent flexible linkers between TnsBhook and the rest of TnsB. d, TnsB is recruited to the target site and forms the STC upon integration. Four TnsBhook are bound to four TnsC protomers proximal to TnsB through the flexible linker (dashed purple line). Two turns of TnsC (12 protomers) are stably formed against disassembly. Together with target-site-associated proteins and TnsB STC, all CAST components form the transpososome at the integration site. e, A magnified view of TnsC (boxed) in the transpososome shown in d. All TnsC protomers are in the ATP-bound state (ATP is shown as a red circle). TnsC in the transpososome does not specifically track with DNA helical symmetry, unlike previous helical structures of TnsC.
Extended Data Fig. 1
Extended Data Fig. 1. Designed DNA substrate schematic and negative staining microscopy of target pot and transpososome.
a. DNA substrate design for the transpososome assembly includes two DNA substrates: target pot DNA containing a Cas12k-binding site and the first two TnsB binding sites of left-end (LE), and donor pot DNA with the first two TnsB binding sites of right-end (RE). DNA substrates were designed to form a strand-transfer complex by having 5 base pairs (bp) single-stranded DNA (ssDNA) connecting the target DNA region and the transposon DNA region. The design for target-pot DNA is composed of four single-stranded DNA (ssDNA) of the following: Target-LE_F (light blue), non-target_R (red), desthiobiotinylated LUEGO (green), and LE_R (dark blue). Cas12k-binding region contains PAM and a 10 bp mismatch to facilitate R-loop formation as indicated as a displaced strand. 5′ end labeled desthiobiotin (green circle) on the LUEGO was used to conjugate target-pot DNA on magnetic beads for the pulldown. Second, donor-pot DNA consists of three ssDNA: RE_F (grey), RE_R1 (purple), and RE_R2 (orange). LE_R region and RE_R1 region of each DNA substrate corresponds to the first two TnsB binding sites of LE and RE, respectively. Two DNA substrates have 5 bp of complementary sequences to each other, which are annealed upon transpososome assembly. Locations of PAM, and R-loop are annotated in black. Sequences for all DNA substrates are included in Supplementary Table 1. b. Features of the designed DNA substrate. Each left-end and right-end transposon region of the DNA includes 8 bp terminal sequences and the two TnsB binding sites (L1 and L2 for the left end, R1 and R2 for the right end). The beginning of the left-end sequence (red triangle) is 61 bp distant from the PAM as indicated with a black arrow. PAM and the 5 bp of complementary sequences (target site duplication) were represented in red.c. Negative stain image of the target pot (i.e. recruitment complex containing Cas12k, S15, TniQ, and TnsC) shows a heterogenous assembly with variable length TnsC filaments (indicated by black arrows). d. Negative stain image of the transpososome complex shows the addition of donor pot disassembled TnsC filaments and resulted in a homogeneous sample. Scale bar (white) represents 100 nm. The micrographs shown are examples images from negative-stain screening datasets consisting of 20 and 100 micrographs, respectively.
Extended Data Fig. 2
Extended Data Fig. 2. Cryo-EM imaging and image processing pipeline of the transpososome complex.
a. Representative cryo-EM micrograph from the reconstituted transpososome sample. Scale bar (white, bottom right) represents 100 nm. The micrograph shown is an example image from a full dataset consisting of 17,554 micrographs. b. Image processing workflow used to analyze the cryo-EM data. 2D classification in cryoSPARC v3.3.1 on template picked particles (from 14,017 micrographs) resulted in 535,932 particles. Ab-initio reconstruction on the initial particle stack resulted in two classes, one with 53% of the particles (pink) and the other with 47% of the particles (gray). The two classes were separated for subsequent classification and refinement steps. Before performing 3D classification in RELION v4, each class underwent homogenous refinement in cryoSPARCv3.3.1. RELION v4 3D classification (without alignments, skip_align), was applied to both populations from the ab-initio reconstruction resulting in the colored volumes shown (blue, pink, and yellow). On the left, the two classes (pink and yellow) that have the best resolved Cas12k density were combined for downstream refinement to produce the final 3D reconstruction (boxed), which is the major configuration of the transpososome complex with 12 TnsC protomers. Local refinement was performed on three different segments of the map, focusing on: Cas12k (3.1 Å), TnsC (3.2 Å) and TnsB (3.2 Å). On the right, the class that has the best resolved Cas12k and TnsB density (27% of particles, shown in pink) was selected for downstream refinement to produce the final 3D reconstruction (boxed), which is the minor configuration of the transpososome complex with 13 TnsC protomers. Similar local refinement was performed on three different segments of the minor TnsC complex to result in high resolution reconstructions of the target site proteins (Cas12k+TniQ+S15), TnsC, and TnsB. c-d. Fourier shell correlation (FSC) curve of the major (c) and minor (d) configuration of the transpososome complex, respectively. Masked (dashed) or unmasked (solid) gold standard half-map FSC (blue) and model-map FSC (red) curves are shown for the refined reconstruction and atomic model. Model-map cutoff (0.5) and gold-standard FSC cutoffs (0.143) are indicated with dashed lines. Estimated resolution based on these cutoffs are indicated. e-f. Local resolution filtered reconstruction for the major (e) and minor (f) configuration of the transpososome complex, respectively, are shown with estimated local resolution indicated using colored surface. Local resolution ranges from 3.0 Å (blue) to 7.0 Å (red). Legend at the bottom indicates local resolution range and values in Angstrom. g-h. Angular distribution plot for particle projections of the major (g) and minor (h) configuration of the transpososome complex, respectively. The plot was calculated in cryoSPARC v3.3.1 and shows the number of particles for each viewing angle. Colors indicate counts; red corresponds to high particle counts for that particular viewing angle, blue to low particle counts.
Extended Data Fig. 3
Extended Data Fig. 3. TnsC has dedicated faces for TniQ and TnsB within the transpososome.
A simulated map is colored by different regions of TnsC (opaque surface) to represent the N- and C-terminal face of TnsC. The regions are colored as follows: N-terminal face (residues 19–140 on TnsC7-TnsC12, rose-brown), and C-terminal face (residues 141–275 on TnsC1-TnsC6, light blue). Region not included in either N- or C-terminal face is colored green. TniQ (orange ribbon) and TnsB (purple ribbon) associates with the N-terminal face and C-terminal face respectively.
Extended Data Fig. 4
Extended Data Fig. 4. Interactions between transpososome components near R-loop.
a. DNA (blue ribbon) forms 17 base pair heteroduplex with RNA (gray) in Cas12k (pink). Cas12k, S15 (tan), and TniQ (orange) are shown in surface representation. Close-up view on the right shows the model docked into the cryo-EM density of the R-loop. The PAM distal end of the R-loop is indicated with an asterisk (*). b. Atomic model of the ShCAST transpososome, focusing on Cas12k. The TnsC protomer closest to Cas12k (TnsC10) is labeled. TnsC protomers are numbered as previously defined (see Main Text, Fig. 2). ShCAST protein and nucleic acid components are labeled and colored according to previously defined colors (see Main Text, Fig. 1). Black box indicates the TnsC finger loop that is close to Cas12k shown as inset in panel B. c. The closet distance between TnsC protomer TnsC10 and Cas12k is shown with dashed line and labeled (in Å). d. S15 (beige) is positioned between the REC2 domain of Cas12k (pink(and the sgRNA-DNA heteroduplex (blue/grey). The rooftop loop of sgRNA (grey) is stabilized by S15 (beige) and TniQ (orange). Rotation with respect to panel a is indicated in top left corner.
Extended Data Fig. 5
Extended Data Fig. 5. TnsBHook density occupies select TnsC protomers in the TnsC hexamer closest to TnsB.
a. Local resolution filtered cryo-EM reconstruction (same as that shown in Fig. 1) colored by assignment reveals that TnsBHook (light and dark purple) occupies binding sites on TnsC (green). b. Rotation of the cryo-EM reconstruction by 30° shows the adjacent TnsBHook binding pocket on TnsC (white dashed lines) is empty.
Extended Data Fig. 6
Extended Data Fig. 6. High throughput mapping of the in vitro transposition events reveals that the identified interaction between TnsC and TnsB IIβ domain is crucial for target-site selection.
Insertion positions were determined by Illumina sequencing of the plasmids extracted from colonies from in vitro transpositions under the following conditions (same with Fig. 3f, see Methods): a. TnsB wild-type (WT) with S15, b. TnsB WT without S15, c. TnsB R432A with S15, d. TnsB R432A without S15, e. TnsB Y439A with S15, and f. TnsB Y439A without S15. Determined insertion positions were plotted as a histogram indicating the percentage of the reads at the 10 base-pair (bp) windows within the target plasmid. Position numbers (x-axis) correspond to the number of base pairs between the PAM and the beginning of the transposon-end sequence after the transposition. Red and blue bars represent the transposition products with the left end-right end (L-R, correct) or the right end-left end (R-L, wrong) orientation respectively. For the conditions with high on-target percentage (> 60%, panels a, b, c, and e), insets are presented for the positions around the PSP1 protospacer (from 0 bp to 70 bp), which is indicated with black brackets on the x-axis. Grey bar in the inset indicates the 17 bp PSP1 protospacer. For panel e, a red bar on the y-axis represents the region for zoom-in on the lower panel to visualize signals from the off-target transposition events. Two origins of replications within the target plasmids (f1 ori and ori) are annotated as black bars on the x-axis, which explains the reason for the cold spots for the transpositions.
Extended Data Fig. 7
Extended Data Fig. 7. TnsC in ShCAST transpososome does not match helical parameters of the bound DNA.
The repeat length of TnsC turn (~6 protomers per turn) is approximately 40 Å, while the repeat length of the TnsC-bound DNA (~11 base pairs per turn) is approximately 36 Å. DNA model is represented in a solid ribbon. Protein components and sgRNA in the transpososome are represented as transparent surfaces. Color scheme is identical to the established colors in Fig. 1.
Extended Data Fig. 8
Extended Data Fig. 8. TnsC-DNA interaction proximal to TnsB is identical in the major and minor configurations.
a. Low pass filtered (10 Å) cryo-EM reconstructions of both major (transparent grey) and minor (solid, colored) configurations are aligned with respect to TnsB. The dashed box indicates the TnsC-DNA interactions at the TnsB proximal region shown as inset in panel B. b. Three TnsB-proximal TnsC protomers (From TnsC1 to TnsC3) in both major and minor configurations interact with target strand DNA (tsDNA) in an identical manner through residue R182. Hydrogen bonding interactions (distance cut off <4 Å) between protein residues and the sugar-phosphate backbone of DNA are represented with dashed lines. Base pairs that are interacting with TnsC are represented as filled nucleotides and stick phosphate-backbone.

Comment in

References

    1. Peters JE, Makarova KS, Shmakov S, Koonin EV. Recruitment of CRISPR–Cas systems by Tn7-like transposons. Proc. Natl Acad. Sci. USA. 2017;114:E7358–E7366. doi: 10.1073/pnas.1709035114. - DOI - PMC - PubMed
    1. Strecker J, et al. RNA-guided DNA insertion with CRISPR-associated transposases. Science. 2019;365:48–53. doi: 10.1126/science.aax9181. - DOI - PMC - PubMed
    1. Klompe SE, Vo PLH, Halpin-Healy TS, Sternberg SH. Transposon-encoded CRISPR–Cas systems direct RNA-guided DNA integration. Nature. 2019;571:219–225. doi: 10.1038/s41586-019-1323-z. - DOI - PubMed
    1. Faure G, et al. CRISPR–Cas in mobile genetic elements: counter-defence and beyond. Nat. Rev. Microbiol. 2019;17:513–525. doi: 10.1038/s41579-019-0204-7. - DOI - PMC - PubMed
    1. Petassi MT, Hsieh SC, Peters JE. Guide RNA categorization enables target site choice in Tn7–CRISPR–Cas transposons. Cell. 2020;183:1757–1771 e1718. doi: 10.1016/j.cell.2020.11.005. - DOI - PMC - PubMed

Publication types

MeSH terms

Supplementary concepts