. 2023 Feb;14(1):243-259.
doi: 10.1002/jcsm.13124. Epub 2022 Nov 28.

Loss of FoxOs in muscle increases strength and mitochondrial function during aging

Affiliations

Loss of FoxOs in muscle increases strength and mitochondrial function during aging

Christie M Penniman et al. J Cachexia Sarcopenia Muscle. 2023 Feb.

Abstract

Background: Muscle mitochondrial decline is associated with aging-related muscle weakness and insulin resistance. FoxO transcription factors are targets of insulin action and deletion of FoxOs improves mitochondrial function in diabetes. However, disruptions in proteostasis and autophagy are hallmarks of aging and the effect of chronic inhibition of FoxOs in aged muscle is unknown. This study investigated the role of FoxOs in regulating muscle strength and mitochondrial function with age.

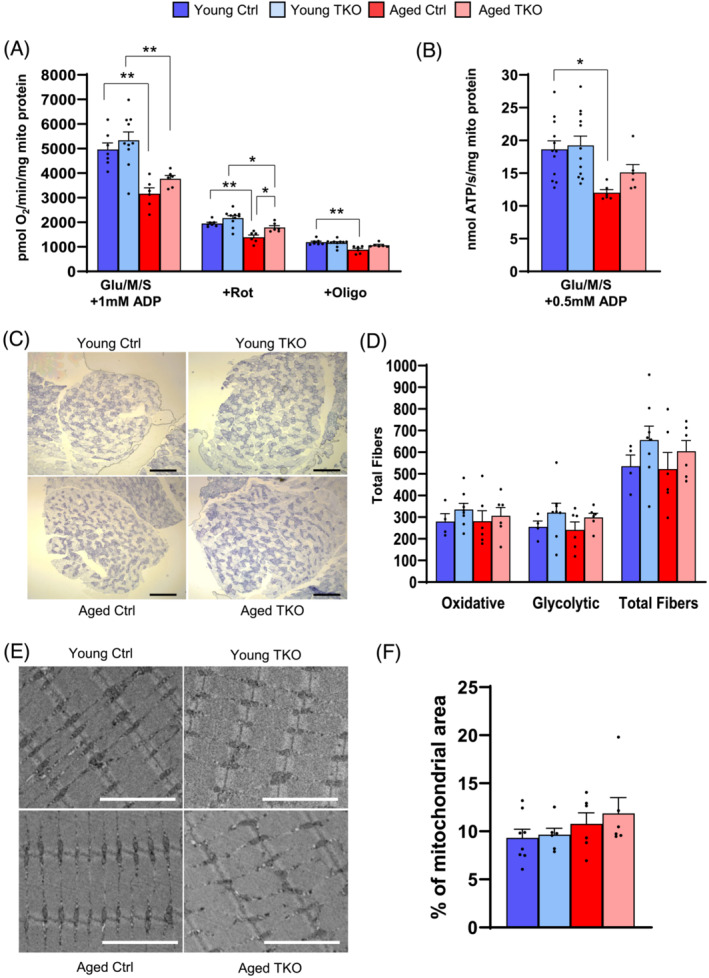
Methods: We measured muscle strength, cross-sectional area, muscle fibre-type, markers of protein synthesis/degradation, central nuclei, glucose/insulin tolerance, and mitochondrial bioenergetics in 4.5-month (Young) and 22-24-month-old (Aged) muscle-specific FoxO1/3/4 triple KO (TKO) and littermate control (Ctrl) mice.

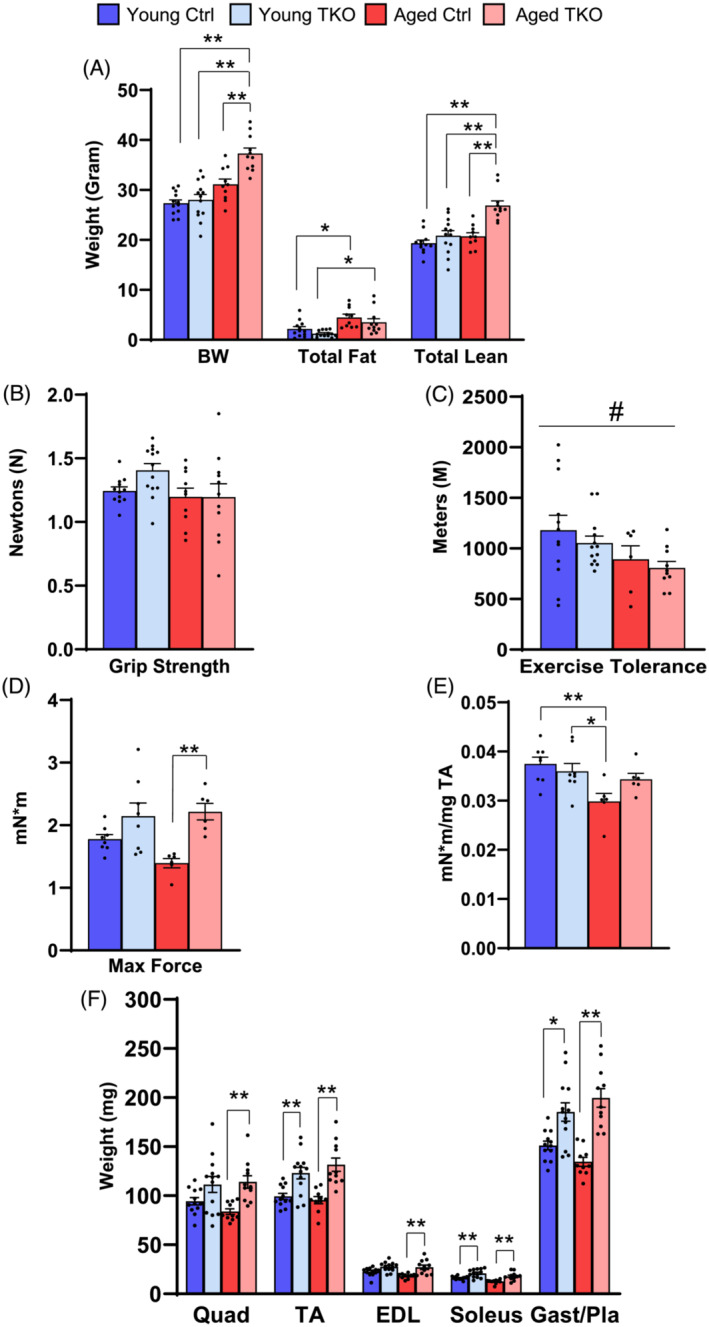
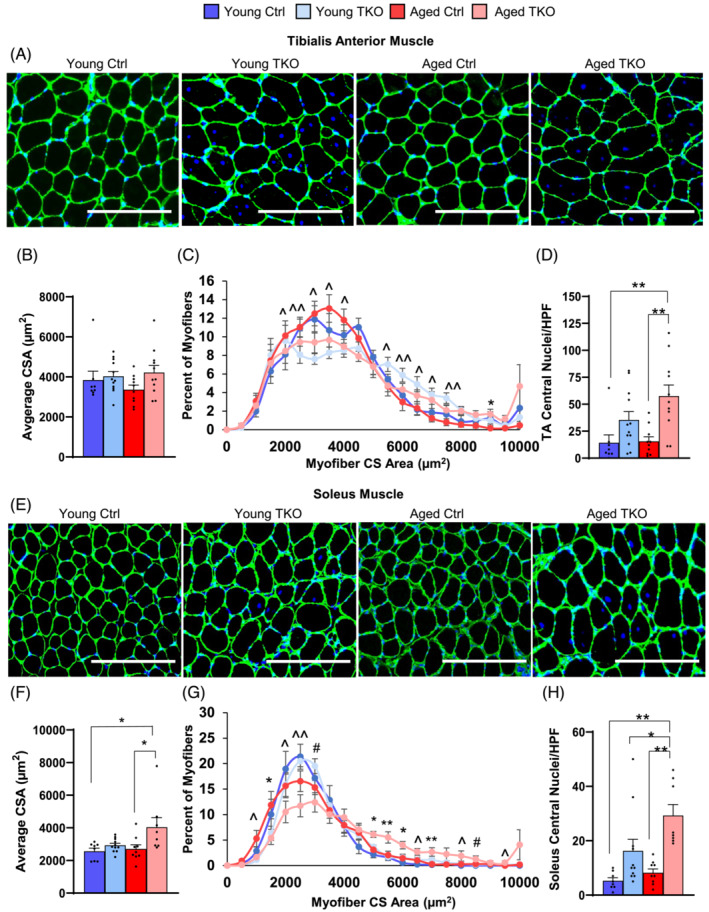
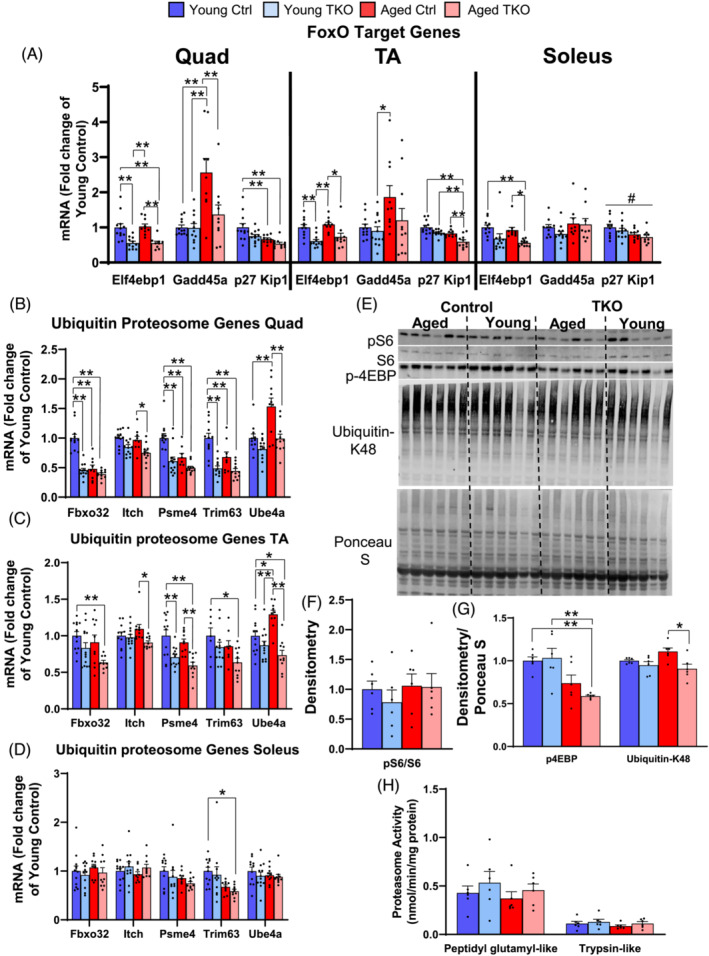
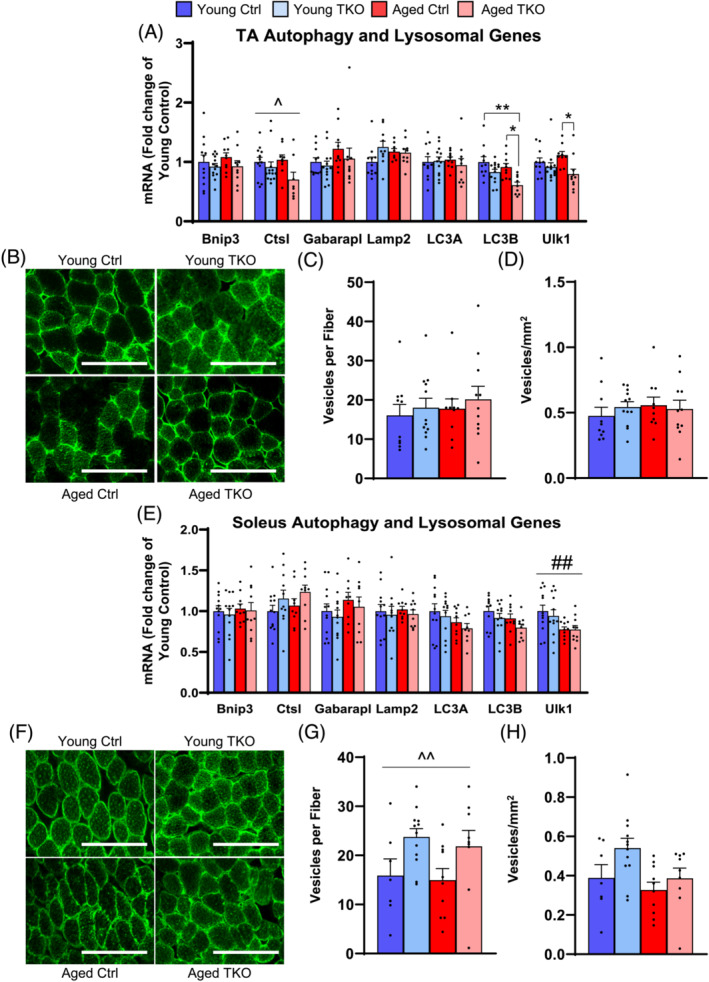
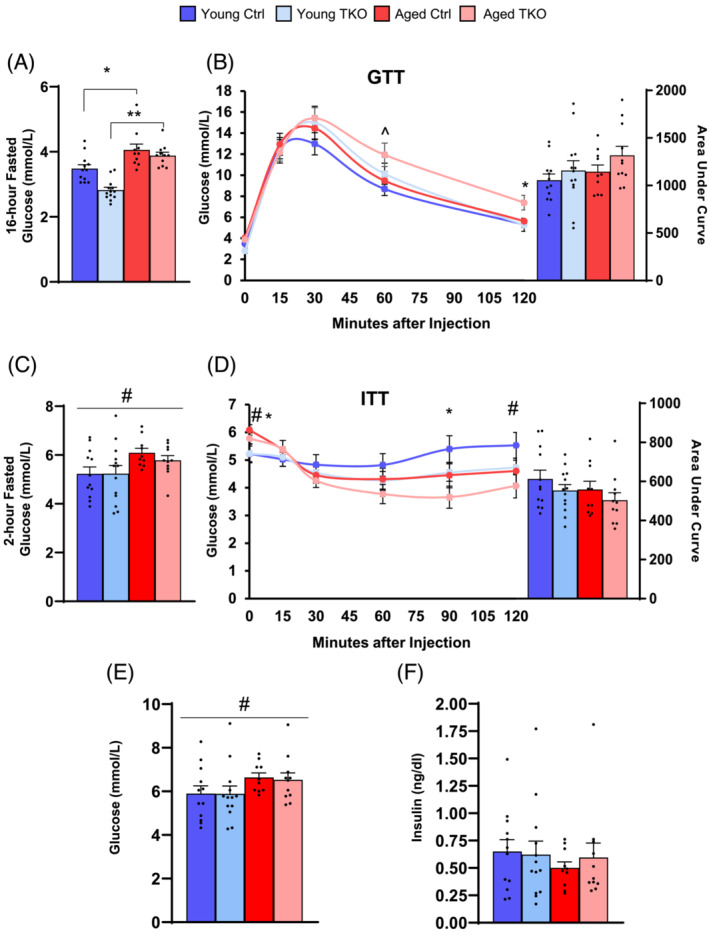
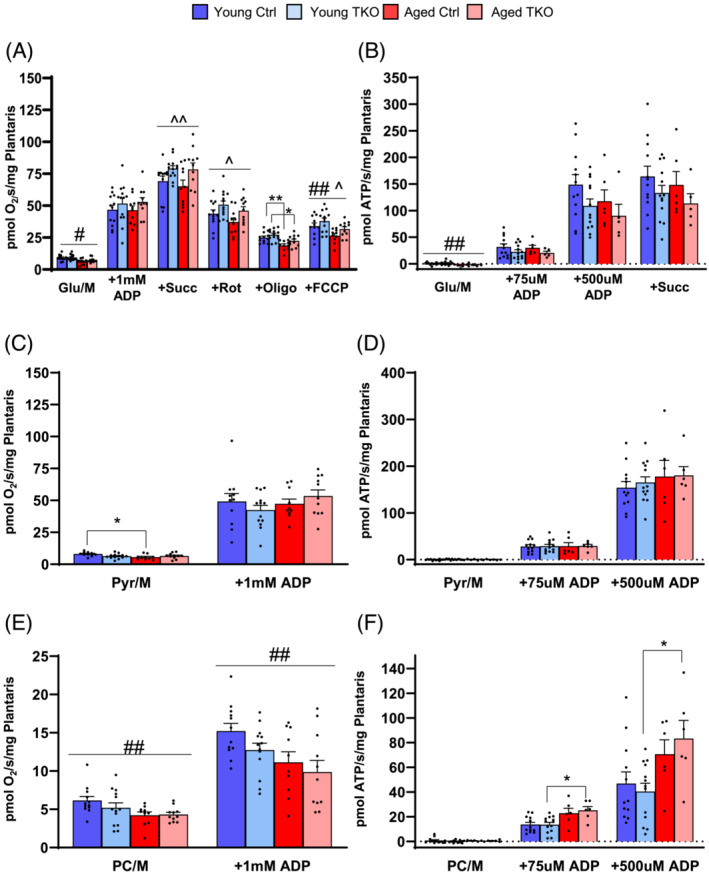
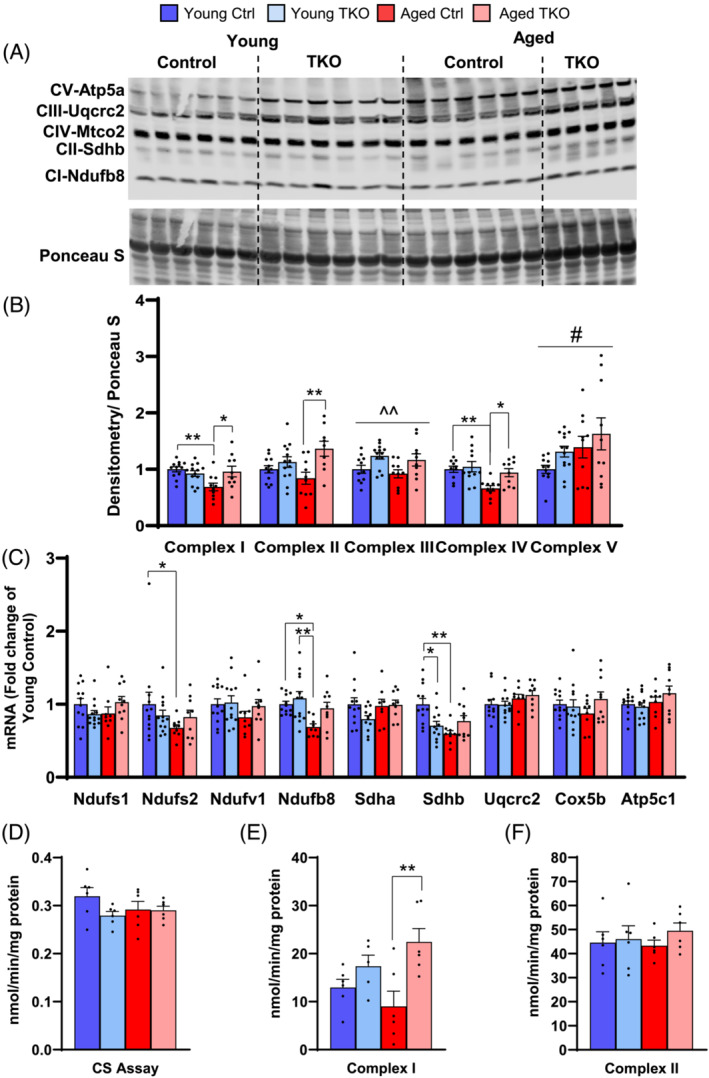
Results: Lean mass was increased in Aged TKO compared with both Aged Ctrl and younger groups by 26-33% (P < 0.01). Muscle strength, measured by max force of tibialis anterior (TA) contraction, was 20% lower in Aged Ctrl compared with Young Ctrls (P < 0.01) but was not decreased in Aged TKOs. Increased muscle strength in Young and Aged TKO was associated with 18-48% increased muscle weights compared with Ctrls (P < 0.01). Muscle cross-sectional analysis of TA, soleus, and plantaris revealed increases in fibre size distribution and a 2.5-10-fold increase in central nuclei in Young and Aged TKO mice, without histologic signs of muscle damage. Age-dependent increases in Gadd45a and Ube4a expression as well accumulation of K48 polyubiquitinated proteins were observed in quad and TA but were prevented by FoxO deletion. Young and Aged TKO muscle showed minimal changes in autophagy flux and no accumulation of autophagosomes compared with Ctrl groups. Increased strength in Young and Aged TKO was associated with a 10-20% increase in muscle mitochondrial respiration using glutamate/malate/succinate compared with controls (P < 0.05). OXPHOS subunit expression and complex I activity were decreased 16-34% in Aged Ctrl compared with Young Ctrl but were prevented in Aged TKO. Both Aged Ctrl and Aged TKO showed impaired glucose tolerance by 33% compared to young groups (P < 0.05) indicating improved strength and mitochondrial respiration are not due to improved glycemia.

Conclusions: FoxO deletion increases muscle strength even during aging. Deletion of FoxOs maintains muscle strength in part by mild suppression of atrophic pathways, including inhibition of Gadd45a and Ube4a expression, without accumulation of autophagosomes in muscle. Deletion of FoxOs also improved mitochondrial function by maintenance of OXPHOS in both young and aged TKO.

Keywords: Aging; FoxO; Glucose tolerance; Insulin resistance; Mitochondrial function; Muscle hypertrophy.


Conflict of interest statement

The authors declare no conflict of interest regarding the present work.

Figures

Figure 1
Figure 1
Muscle‐specific FoxO deletion increases muscle size and prevents loss of muscle strength with aging. Body composition measured by NMR showing body weight (BW), total fat, and total lean mass in Young (4.5‐month‐old) Ctrl, Young TKO, Aged (22‐ to 24‐month‐old) Ctrl, and Aged TKO mice (A). Force generated during grip strength test (B) (n = 10–14 per group). Total distance run during an exercise tolerance test (C) (n = 10–14 per group). Total muscle force generation (D) and muscle force normalized to TA weight (E) was measured via max isometric force test (see In vivo Muslc Contractile Function in Supplemental methods) in TA muscle (n = 6–8 per group). Dissected muscle weights of Young and Aged TKO and littermate control mice (F) (n = 10–14 per group). Only one quad and one gast/pla muscle from each mouse was weighed for analysis but both TAs, EDLs, and soleus muscles were weighed for analysis. *P < 0.05, **P < 0.01 as indicated by 2‐way ANOVA (Quad, quadriceps; TA, tibialis anterior; EDL, extensor digitorum longus; and Gast/Pla, gastrocnemius and plantaris).
Figure 2
Figure 2
FoxO deletion in muscle mildly increases fibre size and markedly increases central nuclei in TKO muscle. Laminin and DAPI stain of tibialis anterior (TA) cross sections (scale bar 250 μm) (n = 8–13 per group) (A). Average cross sectional area (CSA) (B) and distribution of CSA (C) from TA. Quantification of fibres with central nuclei of TA muscle are shown (D). Laminin and DAPI stain of soleus cross sections (scale bar 250 μm) (n = 8–13 per group) (E). Average CSA (F) and distribution of myofibre CSA (G) from soleus. Quantification of central nucleated fibres in soleus (H). HPF, high power field. *P < 0.05; **P < 0.01 Aged Ctrl vs. Aged TKO or as indicated; ^P < 0.05, ^^P < 0.01 genotype main effect and #P < 0.05 age main effect by 2‐way ANOVA.
Figure 3
Figure 3
Age‐related increases in Gadd45a and Ube4a are prevented with FoxO deletion whereas other ubiquitin proteasome genes are decreased in Young and Aged TKO muscle. Quantitative RT‐PCR of FoxO‐target genes (A), from Young Ctrl, Young TKO, Aged Ctrl, and Aged TKO quadriceps (Quad), TA, and soleus muscle. (n = 9–13 per group). Quantitative RT‐PCR of ubiquitin‐proteasome genes in Quad (B), TA (C), and soleus (D) muscle. (n = 9–13 per group). Expression of TBP was used as a housekeeping normalizer. Western blot (E) and densitometry (F, G) for p‐S6, total S6, p‐4EBP, and K48 polyubiquitinated proteins in quad muscle (n = 6 per group). Proteasome activity in quad lysates (H) measured by breakdown of fluorescently labelled peptidyl glutamyl‐like (LLE) or trypsin‐like (LSTR) substrates (n = 6 per group). *P < 0.05, **P < 0.01 as indicated and #P < 0.05 age main effect by 2‐way ANOVA.
Figure 4
Figure 4
Autophagy‐lysosome genes are minimally decreased and LC3A vesicles do not accumulate in TA or soleus from Young and Aged TKO. Quantitative RT‐PCR of autophagy lysosomal genes in TA (A) and soleus (E) muscle from Young Ctrl, Young TKO, Aged Ctrl, and Aged TKO (n = 9–13 per group). TBP was used as a housekeeping normalizer. LC3A stained cross section of TA (B) and soleus muscle (F) (scale bar 200 μm). Quantification of vesicles per fibre in TA (C) and soleus (G). Quantification of vesicle per mm2 in TA (D) and soleus (H) (n = 10–11 per group). *P < 0.05, **P < 0.01 as indicated, ^P < 0.05, ^^P < 0.01 genotype main effect, ##P < 0.01 age main effect by 2‐way ANOVA.
Figure 5
Figure 5
Age‐related increases in fasting glucose are not prevented in aged TKO mice. Overnight (16‐hour) fasted glucose levels in Young and Aged TKO mice and littermate controls (A). Glucose excursions and area under the curve for GTT (B) (n = 10–14 per group). Two‐hour fasted glucose prior to ITT (C). Glucose excursions and area under the curve for ITT (D) (n = 10–14 per group). Ad libitum fed glucose levels (E) and serum insulin concentrations (F) at the time of sacrifice (n = 10–13 per group). *P < 0.05, **P < 0.01 as indicated. ^P < 0.05 genotype main effect, #P < 0.05 age main effect by 2‐way ANOVA.
Figure 6
Figure 6
Maximal mitochondrial respiration is increased in plantaris from FoxO TKO mice using combined complex I and II substrates. Basal and maximal (+1 mM ADP) respiration in saponin‐permeabilized plantaris fibres using glutamate/malate (Glu/M) substates, then sequential addition of succinate (Succ), rotenone (Rot), oligomycin (Oligo), and FCCP (A). ATP production rates in permeabilized plantaris fibres using Glu/M and subsequent addition of succinate (B). Basal and maximal respiration in permeabilized plantaris fibres using pyruvate/malate (Pyr/M) substrates (C). ATP production rates in permeabilized plantaris fibres using Pyr/M (D). Basal and maximal respiration in permeabilized plantaris fibres using palmitoyl‐carnitine/Malte (PC/M) substrates (E). ATP production in permeabilized plantaris fibres using PC/M (F). (n = 5–13 per group). *P < 0.05 as indicated. ^P < 0.05, ^^P < 0.01 genotype main effect. #P < 0.05, ##P < 0.01 age main effect by 2‐way ANOVA.
Figure 7
Figure 7
Oxygen consumption and ATP production in isolated mitochondria is decreased in aged mice, but partially rescued in Aged TKO. Maximal respiration of isolated mitochondria from mixed quad/gastroc with glutamate/malate/succinate (Glu/M/S) substrates, followed by addition of rotenone (Rot), and oligomycin (Oligo) (A). Maximal ATP production of isolated mitochondria with Glu/M/S substrates (B) (n = 5–13 per group). Images (C) and quantification (D) of total muscle fibres from succinate dehydrogenase (SDH) stained plantaris muscles (n = 4–8 per group, scale bar: 500 μm). Images (E) and quantification (F) of mitochondrial area on TEM images from plantaris muscle (n = 6–10 per group, scale bar 3 μm). *P < 0.05, **P < 0.01 as indicated by 2‐way ANOVA.
Figure 8
Figure 8
Deletion of FoxOs preserves OXPHOS subunit levels and activity in muscle with age. OXPHOS subunits measured by western blot in quad muscle (A). Densitometry of indicated subunit from complexes I–V (B) shown in panel A (n = 9–13 per group). Quantitative RT‐PCR of OXPHOS subunit genes in quad muscle (C) (n = 9–13 per group). Citrate synthase (CS) (D) complex I (E), and complex II (F) enzyme activities measured in tibialis anterior muscle from Young and Aged TKO and Ctrl mice (n = 6 per group). *P < 0.05, **P < 0.01 as indicated, ^^P < 0.01 genotype main effect, #P < 0.05 age main effect by 2‐way ANOVA.

References

    1. Peterson CM, Johannsen DL, Ravussin E. Skeletal muscle mitochondria and aging: a review. J Aging Res 2012;2012:194821. - PMC - PubMed
    1. Goodpaster BH, Park SW, Harris TB, Kritchevsky SB, Nevitt M, Schwartz AV, et al. The loss of skeletal muscle strength, mass, and quality in older adults: the health, aging and body composition study. J Gerontol A Biol Sci Med Sci 2006;61:1059–1064. - PubMed
    1. Newman AB, Kupelian V, Visser M, Simonsick EM, Goodpaster BH, Kritchevsky SB, et al. Strength, but not muscle mass, is associated with mortality in the health, aging and body composition study cohort. J Gerontol A Biol Sci Med Sci 2006;61:72–77. - PubMed
    1. Paulussen KJM, McKenna CF, Beals JW, Wilund KR, Salvador AF, Burd NA. Anabolic Resistance of Muscle Protein Turnover Comes in Various Shapes and Sizes. Front Nutr 2021;8:615849. - PMC - PubMed
    1. Morton RW, Traylor DA, Weijs PJM, Phillips SM. Defining anabolic resistance: implications for delivery of clinical care nutrition. Curr Opin Crit Care 2018;24:124–130. - PubMed

Publication types

MeSH terms