. 2023 Jul;72(7):1326-1339.
doi: 10.1136/gutjnl-2022-327608. Epub 2022 Nov 28.

Transcriptomic and immunophenotypic profiling reveals molecular and immunological hallmarks of colorectal cancer tumourigenesis

Affiliations

Transcriptomic and immunophenotypic profiling reveals molecular and immunological hallmarks of colorectal cancer tumourigenesis

Jessica Roelands et al. Gut. 2023 Jul.

Abstract

Objective: Biological insights into the stepwise development and progression of colorectal cancer (CRC) are imperative to develop tailored approaches for early detection and optimal clinical management of this disease. Here, we aimed to dissect the transcriptional and immunologic alterations that accompany malignant transformation in CRC and to identify clinically relevant biomarkers through spatial profiling of pT1 CRC samples.

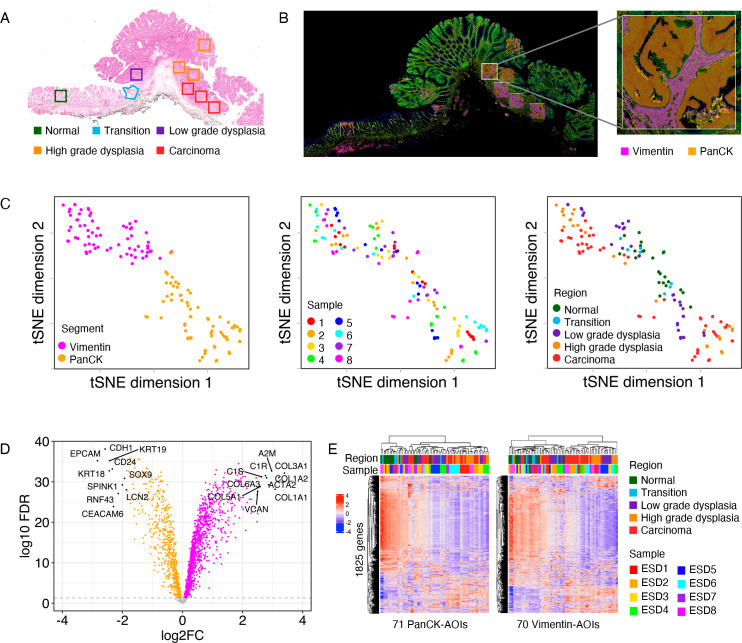
Design: We employed digital spatial profiling (GeoMx) on eight pT1 CRCs to study gene expression in the epithelial and stromal segments across regions of distinct histology, including normal mucosa, low-grade and high-grade dysplasia and cancer. Consecutive histology sections were profiled by imaging mass cytometry to reveal immune contextures. Finally, publicly available single-cell RNA-sequencing data was analysed to determine the cellular origin of relevant transcripts.

Results: Comparison of gene expression between regions within pT1 CRC samples identified differentially expressed genes in the epithelium (n=1394 genes) and the stromal segments (n=1145 genes) across distinct histologies. Pathway analysis identified an early onset of inflammatory responses during malignant transformation, typified by upregulation of gene signatures such as innate immune sensing. We detected increased infiltration of myeloid cells and a shift in macrophage populations from pro-inflammatory HLA-DR+CD204- macrophages to HLA-DR-CD204+ immune-suppressive subsets from normal tissue through dysplasia to cancer, accompanied by the upregulation of the CD47/SIRPα 'don't eat me signal'.

Conclusion: Spatial profiling revealed the molecular and immunological landscape of CRC tumourigenesis at early disease stage. We identified biomarkers with strong association with disease progression as well as targetable immune processes that are exploitable in a clinical setting.

Keywords: colorectal neogenesis; gene expression; immunogenetics.


Conflict of interest statement

Competing interests: None declared.

Figures

Figure 1
Figure 1
Digital spatial profiling of early-stage CRC. (A) Representative example of a pT1 CRC sample stained by H&E. Selected ROIs with different histological features are annotated. (B) Immunofluorescent detection of PanCK and Vimentin on the same sample as in panel (A). Artificial overlay of tissue segmentation is indicated for each ROI, visualising Vimentin+ (pink) and PanCK+ (orange) segments. Inset: higher magnification of an individual ROI. (C) Dimensionality reduction visualisation of all AOIs according to overall gene expression profiles by tSNE. The tSNE plots are annotated by segment (left), sample ID (middle) and histological region (right). (D) Volcano plot of differentially expressed genes between PanCK and Vimentin segments by paired t-test. FDR is calculated using the Benjamini-Hochberg method. (E) Heatmaps of gene expression (n=1825) using unsupervised clustering for PanCK AOIs (n=71, left) and Vimentin AOIs (n=70, right). Heatmaps are annotated by histological region and sample ID. AOI, areas of illumination; CRC, colorectal cancer; FDR, false discovery rate; PanCK, pan-cytokeratin; ROI, region of interest; tSNE, t-Distributed Stochastic Neighbour Embedding.
Figure 2
Figure 2
(A–B) Volcano plots showing differentially expressed genes between distinct histologies in stepwise comparisons (unpaired t-test). Reference groups for comparisons are indicated. Analysis was performed for the epithelial segment (PanCK) (A) and stromal segment (Vimentin) (B), separately. A p value of 0.05 (−log10 p value of 1.30103) and log2FC of 0.5 were used as cut-offs. Differentially expressed genes with the highest and lowest log2FC and selected genes of interest are labelled. (C) Boxplots of log2-transformed, normalised gene expression of five differentially expressed genes detected in the epithelium and corresponding gene expression in the stromal segment. (D) Boxplots of five differentially expressed genes identified in the stroma (vimentin) and corresponding gene expression in the epithelial segment. Log2FC, log2 fold change; PanCK, pan-cytokeratin.
Figure 3
Figure 3
Differential protein abundance of candidate biomarkers in early-stage CRC. (A) Protein abundance of candidate biomarkers in the early-stage CRC samples that were profiled using DSP (n=8). Representative images of IHC detection for MUC-4, Thy1 and Hsp47 across regions with distinct histology (normal, transition, low-grade dysplasia, high-grade dysplasia and carcinoma). (B) Protein abundance of candidate biomarkers in an independent validation set of 20 pT1 CRC samples. Stacked bar chart reflects proportion of samples in each scored category. Significance of Spearman correlation is indicated by asterisks. ***p<0.001. CRC, colorectal cancer; DSP, digital spatial profiling; IHC, immunohistochemistry.
Figure 4
Figure 4
Key biological pathways associated with advancing histology in epithelial and stromal compartments. AOIs are ordered by segment, region and by sample ID. Unsupervised clustering of gene set enrichment scores (ssGSEA) calculated using gene sets from the WikiPathways database. All pathways with a significant association with histology, either in PanCK or Vimentin segments, are included (FDR<0.05). Main clusters of identified pathways are indicated with white horizontal lines. The corresponding Spearman correlation coefficient, Rho, between histology as ordinal variable and the enrichment scores are indicated for each pathway in PanCK and Vimentin segments separately (dotted heatmap). FDR is calculated using Benjamini-Hochberg method. An unsupervised version of this heatmap, using unsupervised clustering for both rows and columns, is included as online supplemental figure S8. AOI, area of illumination; FDR, false discovery rate; PanCK, pan-cytokeratin; ssGSEA, single sample gene set enrichment.
Figure 5
Figure 5
Immune-related alterations in relation to CRC histology. (A) Boxplots of deconvoluted abundancies of distinct immune cell populations across histologies in the Vimentin segment. (B) Forest plot of Spearman’s Rho and corresponding 95% CI for the correlation between enrichment score of immune-related pathways from WikiPathways and histology as ordinal variable. Correlation was assessed in PanCK and Vimentin segments separately. (C) Expression of immunomodulators across distinct regions in the Vimentin segment. AOIs (columns) are ordered by histology and subsequently by sample ID. Expression z-score was calculated in epithelial and stromal segments separately. Type of immunomodulator, either inhibitory or stimulatory, is indicated. An unsupervised version of the heatmap with PanCK and Vimentin regions combined, using unsupervised clustering for both rows and columns, is included as online supplemental figure 9. (D) Line graphs of expression of CD47 and SIRPA during tumourigenesis. Mean enrichment score and corresponding 95% CI are indicated. CRC, colorectal cancer; log2FC, log2 fold change; PanCK, pan-cytokeratin; ROI, region of interest.
Figure 6
Figure 6
Upregulation of the CD47/SIRPα axis and corresponding shift in macrophage subpopulations during the stepwise progression from normal colorectal tissue to cancer. (A) IHC detection of SIRPα and CD47 in distinct histologies of pT1 CRC samples. (B) IHC scores for SIRPα and CD47 in the independent validation set of 18 pT1 CRC samples. Stacked barchart displays the distribution of samples according to the expression of SIRPα and CD47, per histological region. Significance of Spearman correlation is indicated by asterisks. ***p<0.001. (C) Visualisation of macrophage subpopulations by imaging mass cytometry in a normal region and carcinoma region of a pT1 CRC sample. Representative images showing HLA-DR+CD204+ macrophages in a normal region and HLA-DRCD204+ macrophages in a carcinoma region. Myeloid markers: CD68 (red), CD204 (blue), and HLA-DR (green). The tumour is marked by ß-catenin (white). (D) Relative abundance of distinct macrophage subpopulations by region from normal colon tissue to carcinoma as defined by IMC. (E) tSNE embedding of all macrophages from 62 CRC samples (n=17 590 cells) and 35 adjacent normal samples (n=1257 cells) from the scRNA-seq data set by Pelka et al, 2021. Each dot represents a single cell. Six distinct clusters of macrophages were identified. (F) Violin plots showing the expression of CD163, MSR1, HLA-DRA and SIRPA in each of the identified macrophage clusters. (G) Prevalence of each macrophage cluster in normal tissue and cancer tissue. CRC, colorectal cancer; IHC, immunohistochemistry; IMC, imaging mass cytometry; scRNA-seq, single-cell RNA-sequencing; tSNE, t-Distributed Stochastic Neighbour Embedding

References

    1. Fearon ER, Vogelstein B. A genetic model for colorectal tumorigenesis. Cell 1990;61:759–67. 10.1016/0092-8674(90)90186-I - DOI - PubMed
    1. Hanahan D, Weinberg RA. Hallmarks of cancer: the next generation. Cell 2011;144:646–74. 10.1016/j.cell.2011.02.013 - DOI - PubMed
    1. Cancer Genome Atlas Network . Comprehensive molecular characterization of human colon and rectal cancer. Nature 2012;487:330–7. 10.1038/nature11252 - DOI - PMC - PubMed
    1. Guinney J, Dienstmann R, Wang X, et al. . The consensus molecular subtypes of colorectal cancer. Nat Med 2015;21:1350–6. 10.1038/nm.3967 - DOI - PMC - PubMed
    1. Giannakis M, Mu XJ, Shukla SA, et al. . Genomic correlates of Immune-Cell infiltrates in colorectal carcinoma. Cell Rep 2016;15:857–65. 10.1016/j.celrep.2016.03.075 - DOI - PMC - PubMed

Publication types