. 2022 Dec 23;9(6):ENEURO.0382-22.2022.
doi: 10.1523/ENEURO.0382-22.2022. Print 2022 Nov-Dec.

Sounding the Alarm: Sex Differences in Rat Ultrasonic Vocalizations during Pavlovian Fear Conditioning and Extinction

Affiliations

Sounding the Alarm: Sex Differences in Rat Ultrasonic Vocalizations during Pavlovian Fear Conditioning and Extinction

Mikaela A Laine et al. eNeuro. .

Abstract

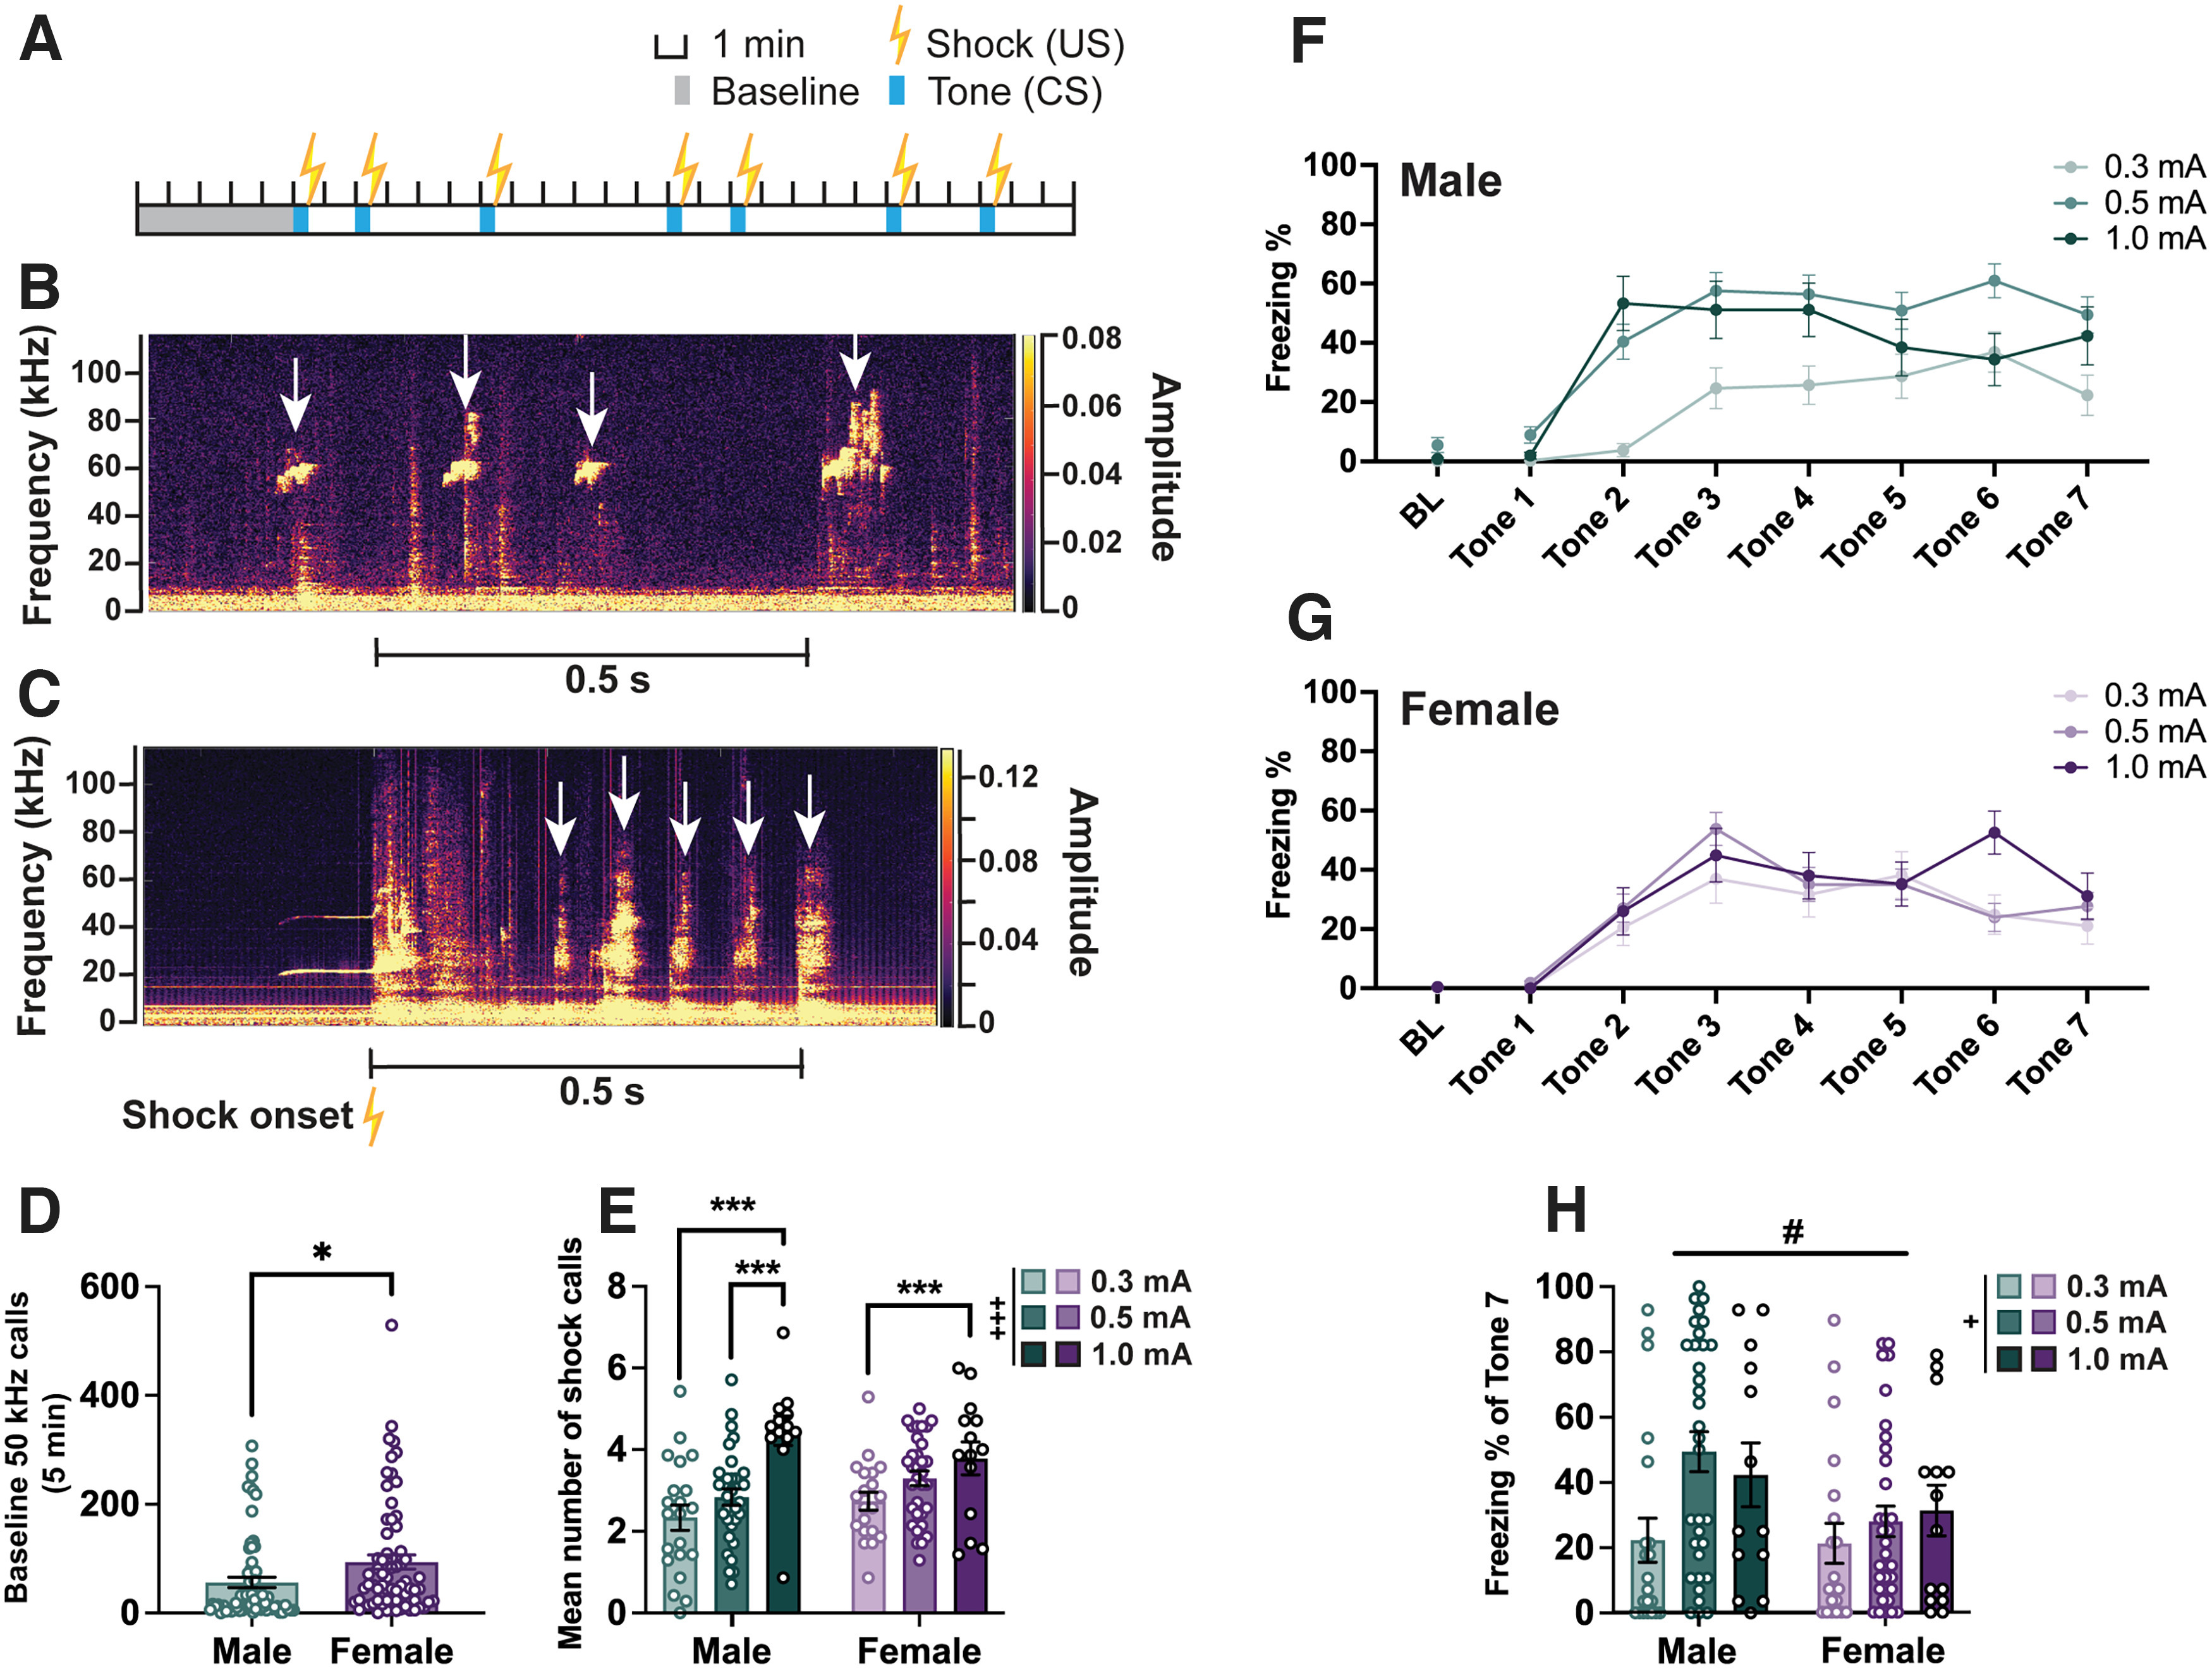
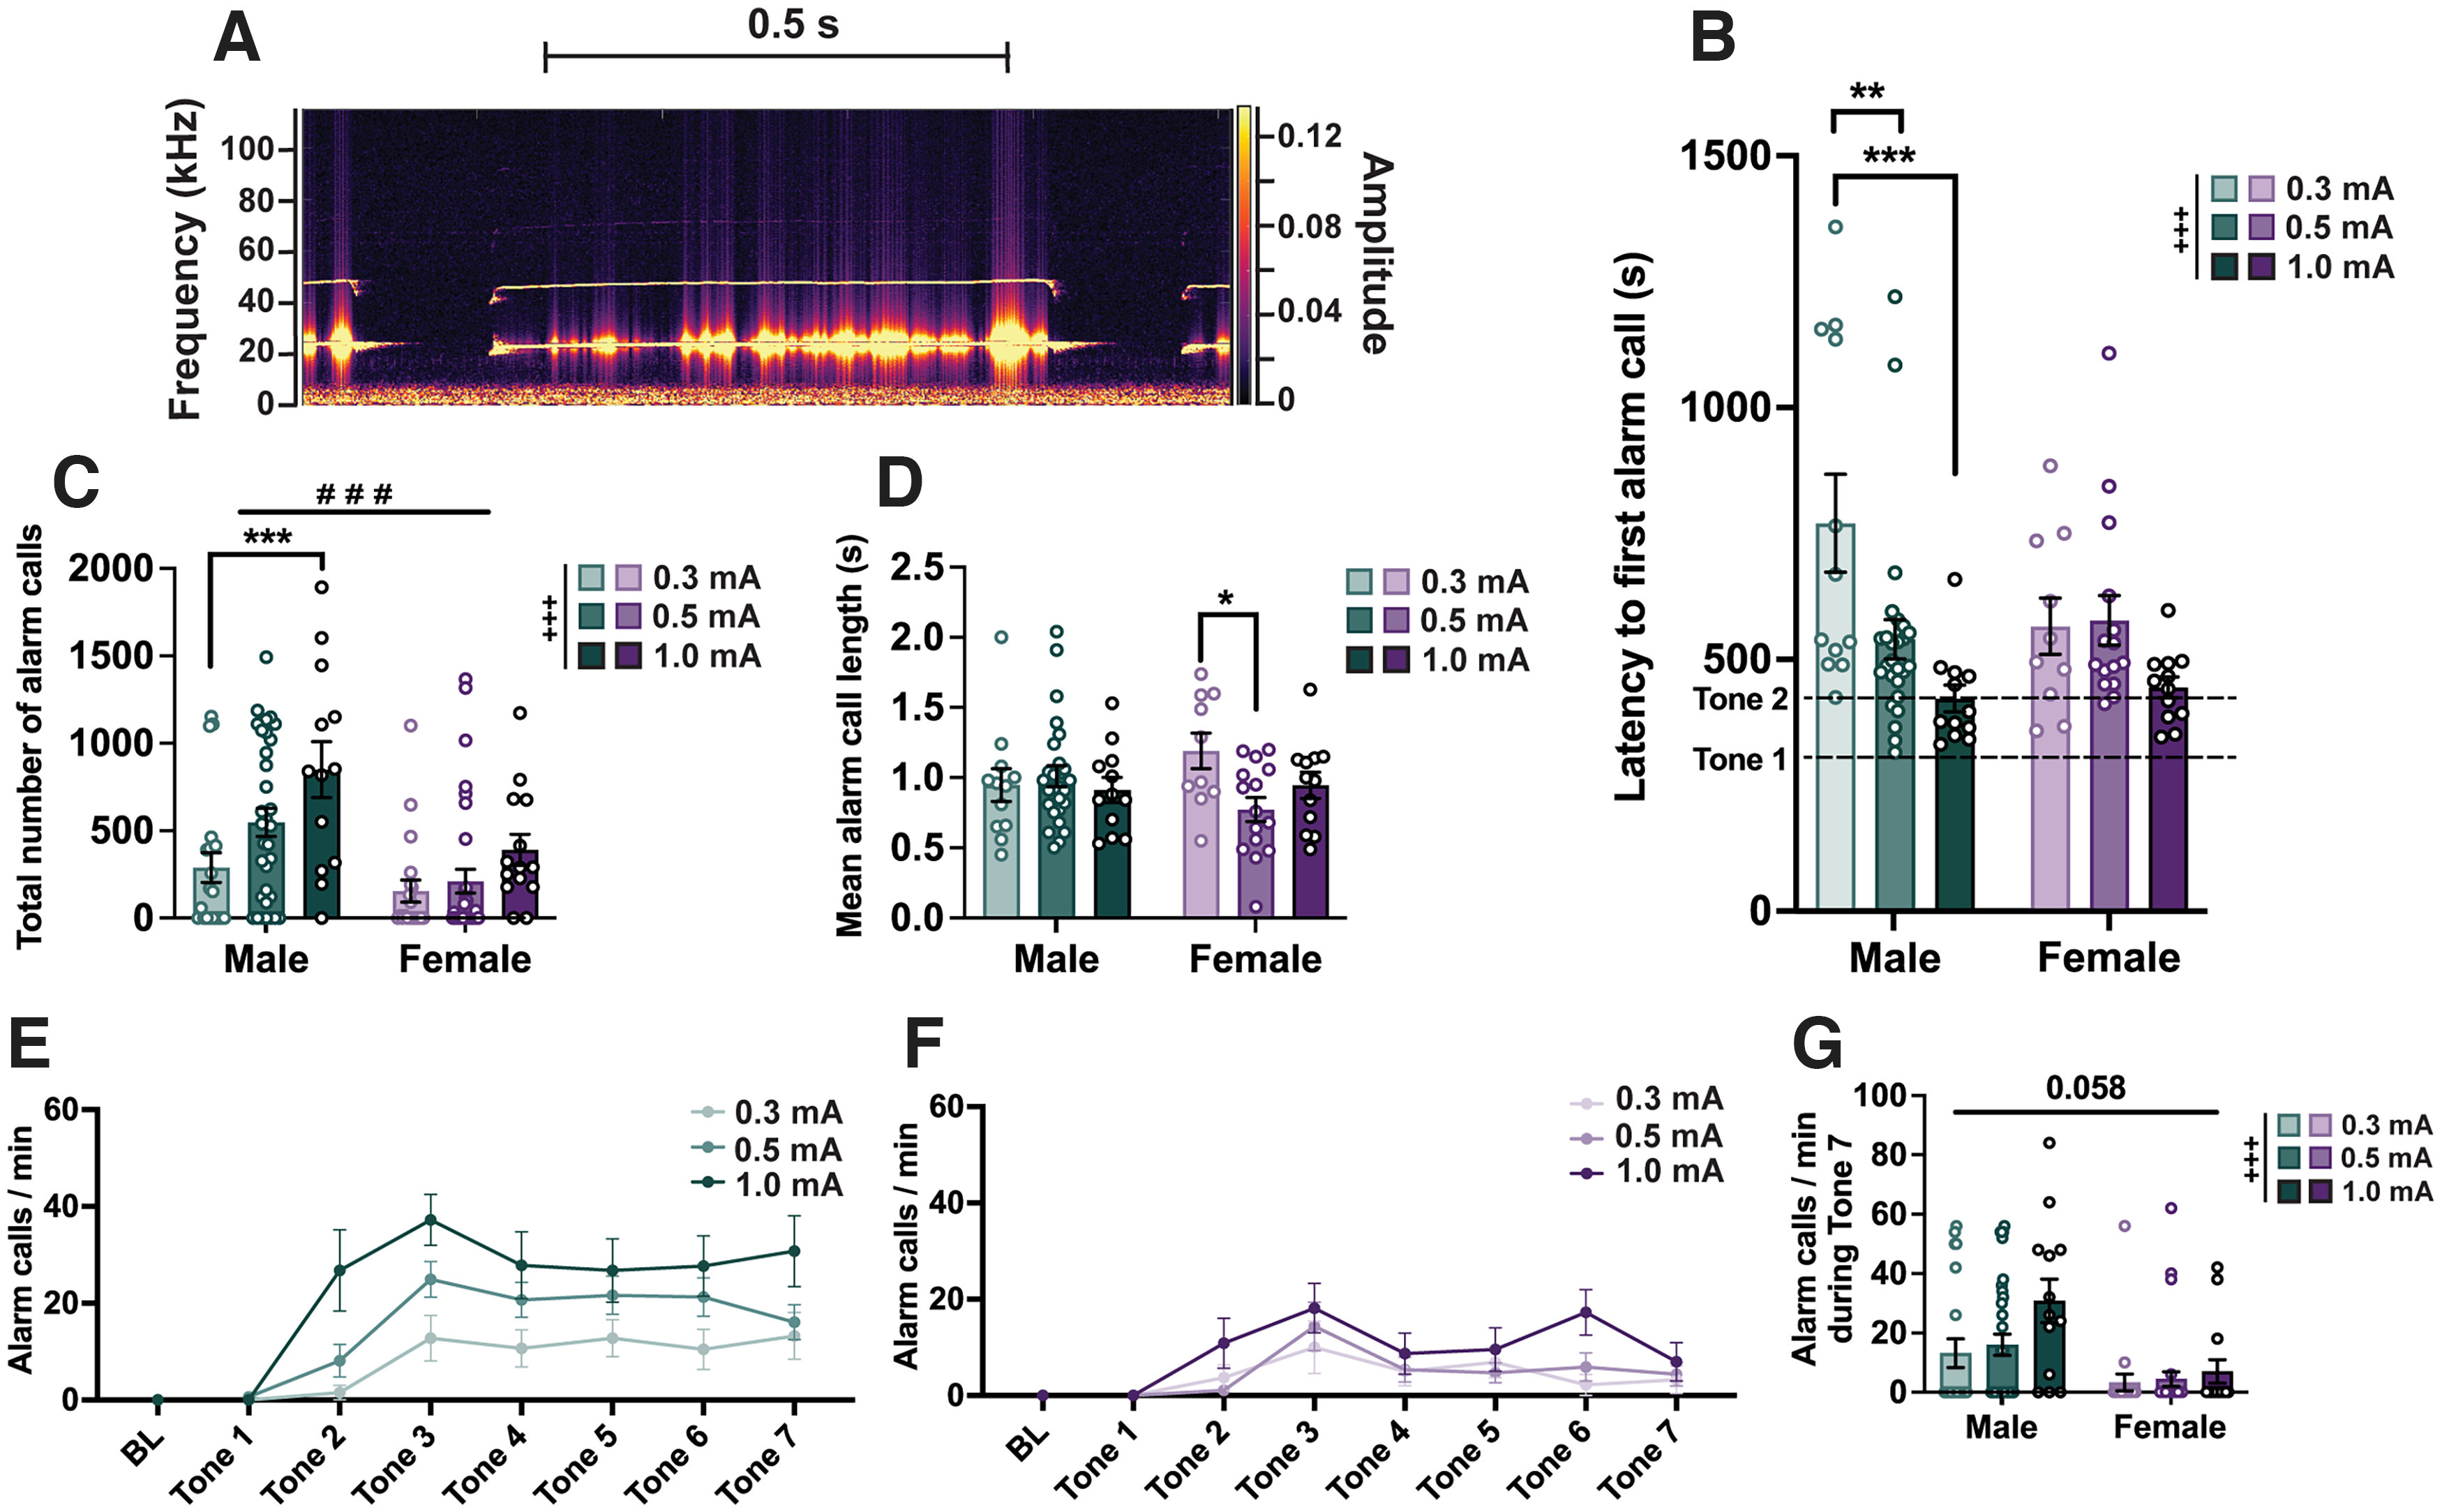
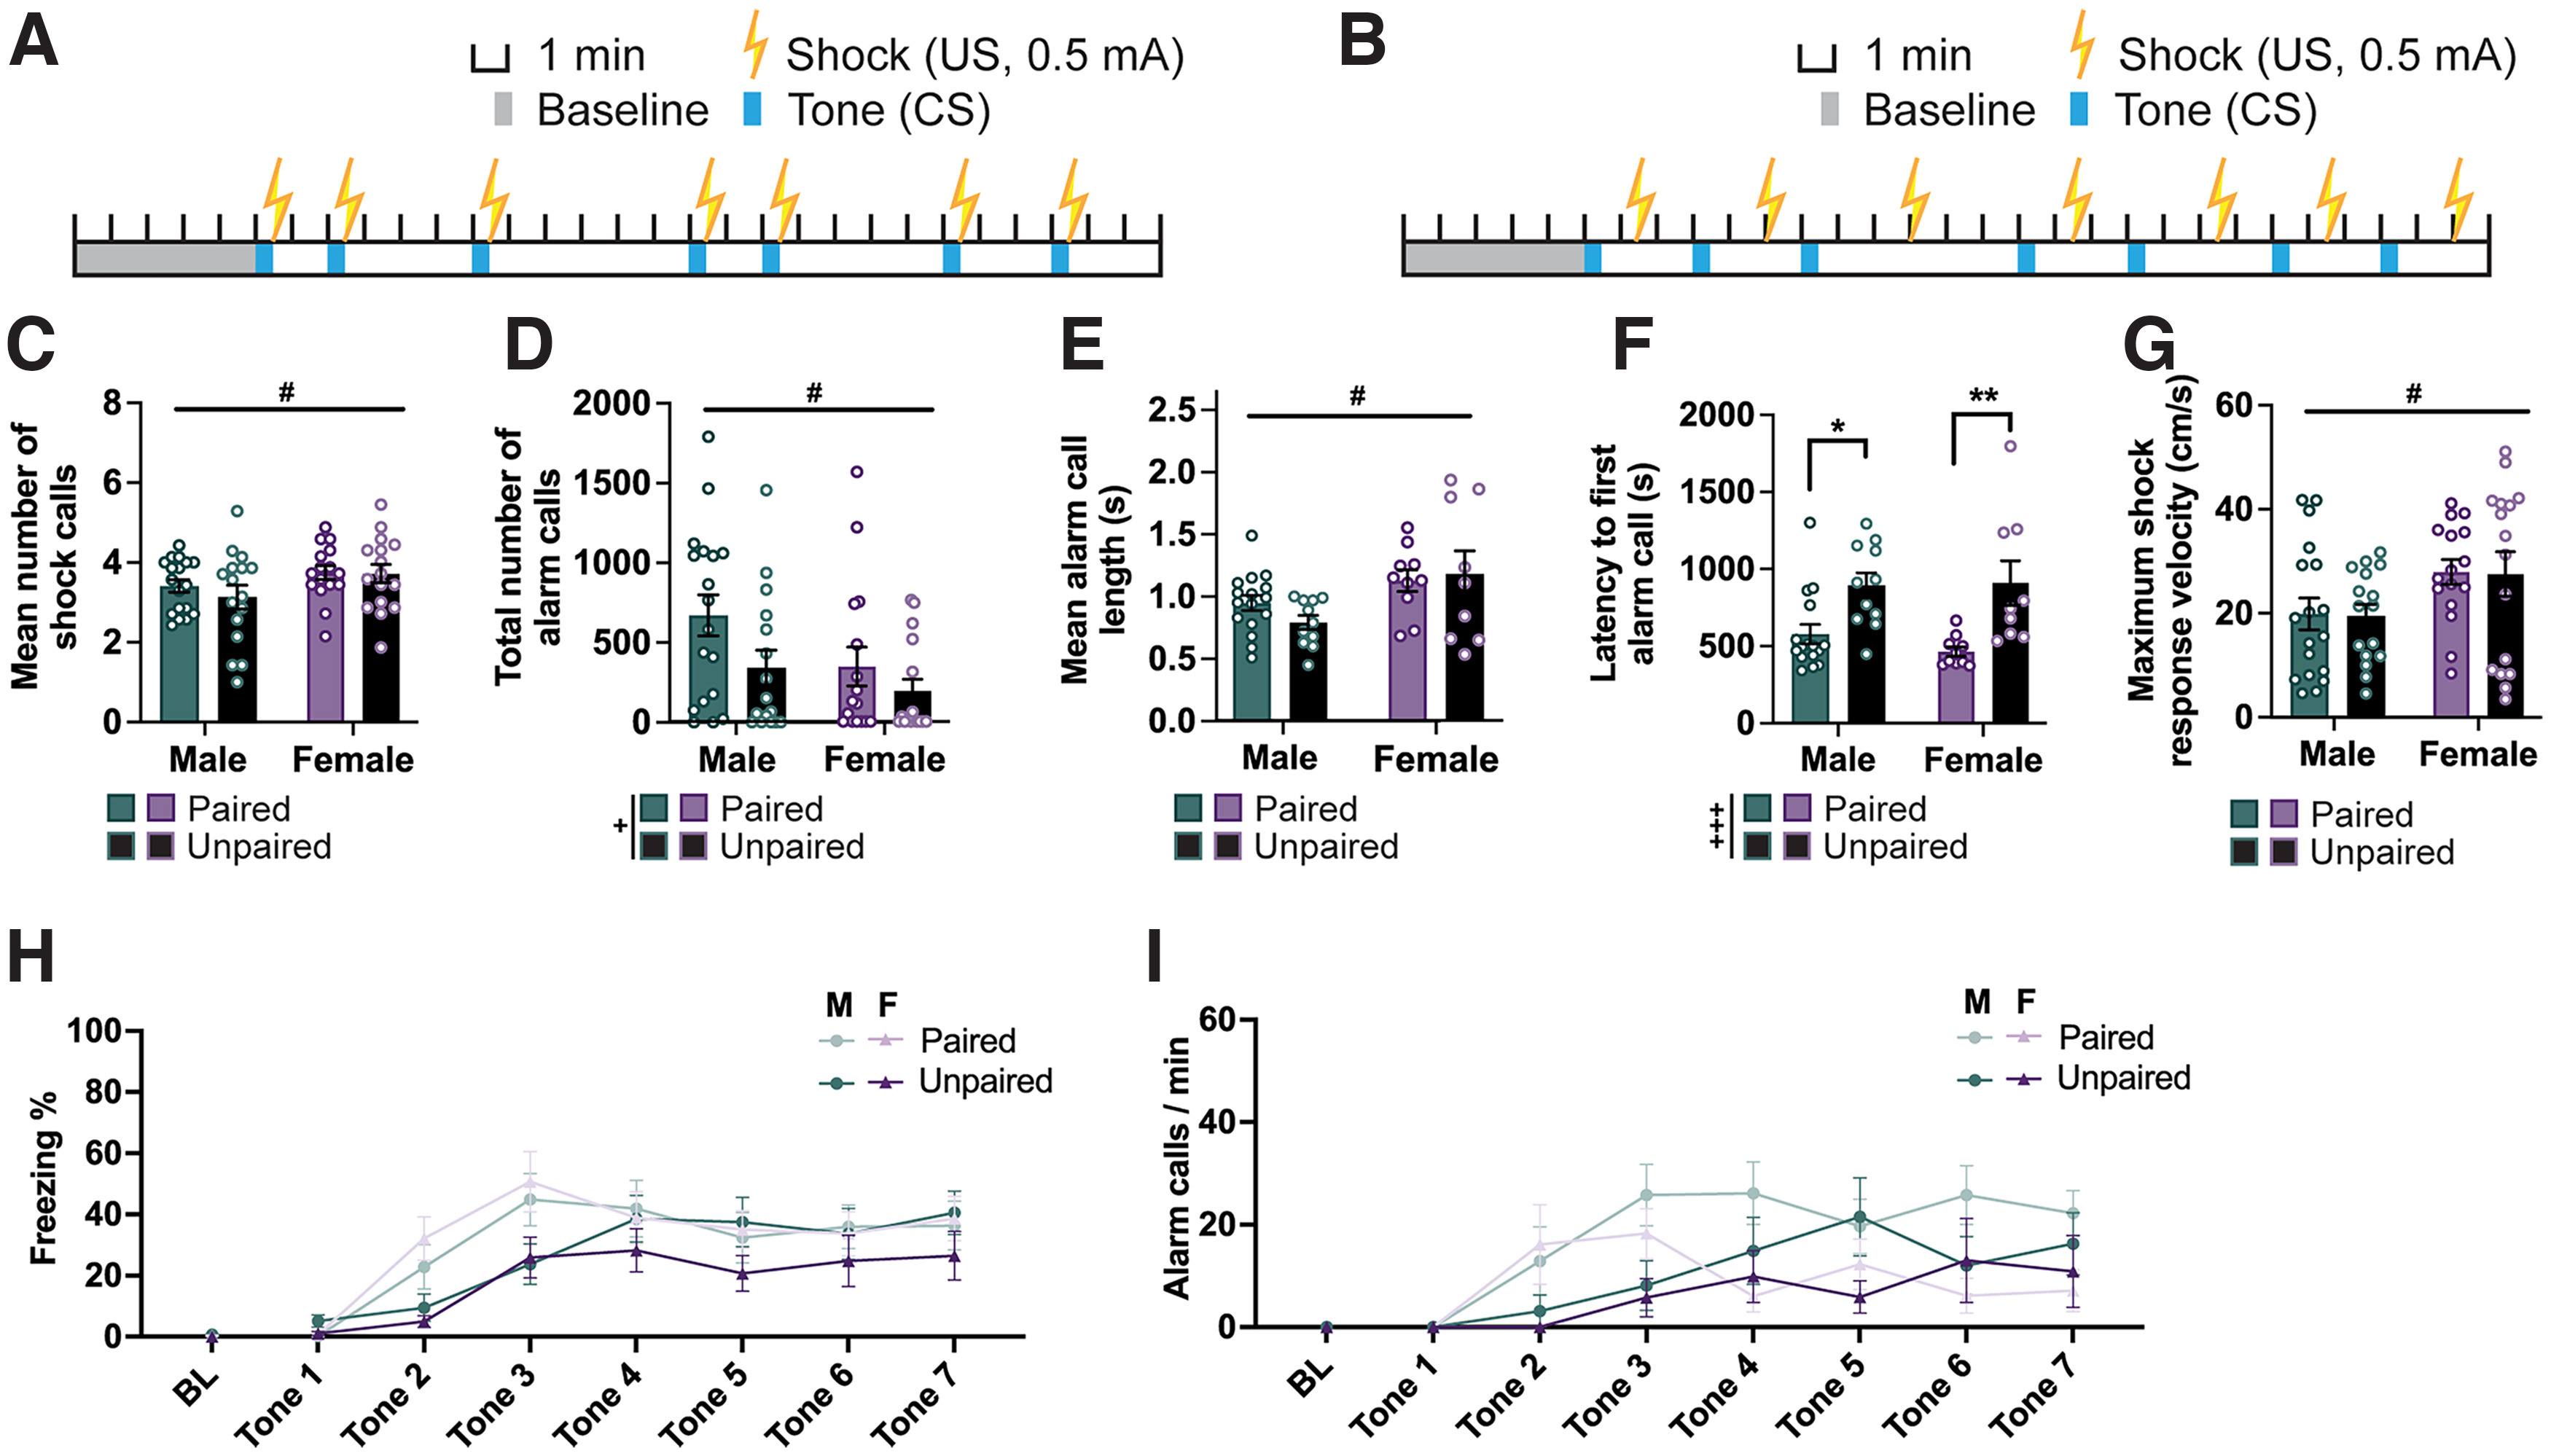
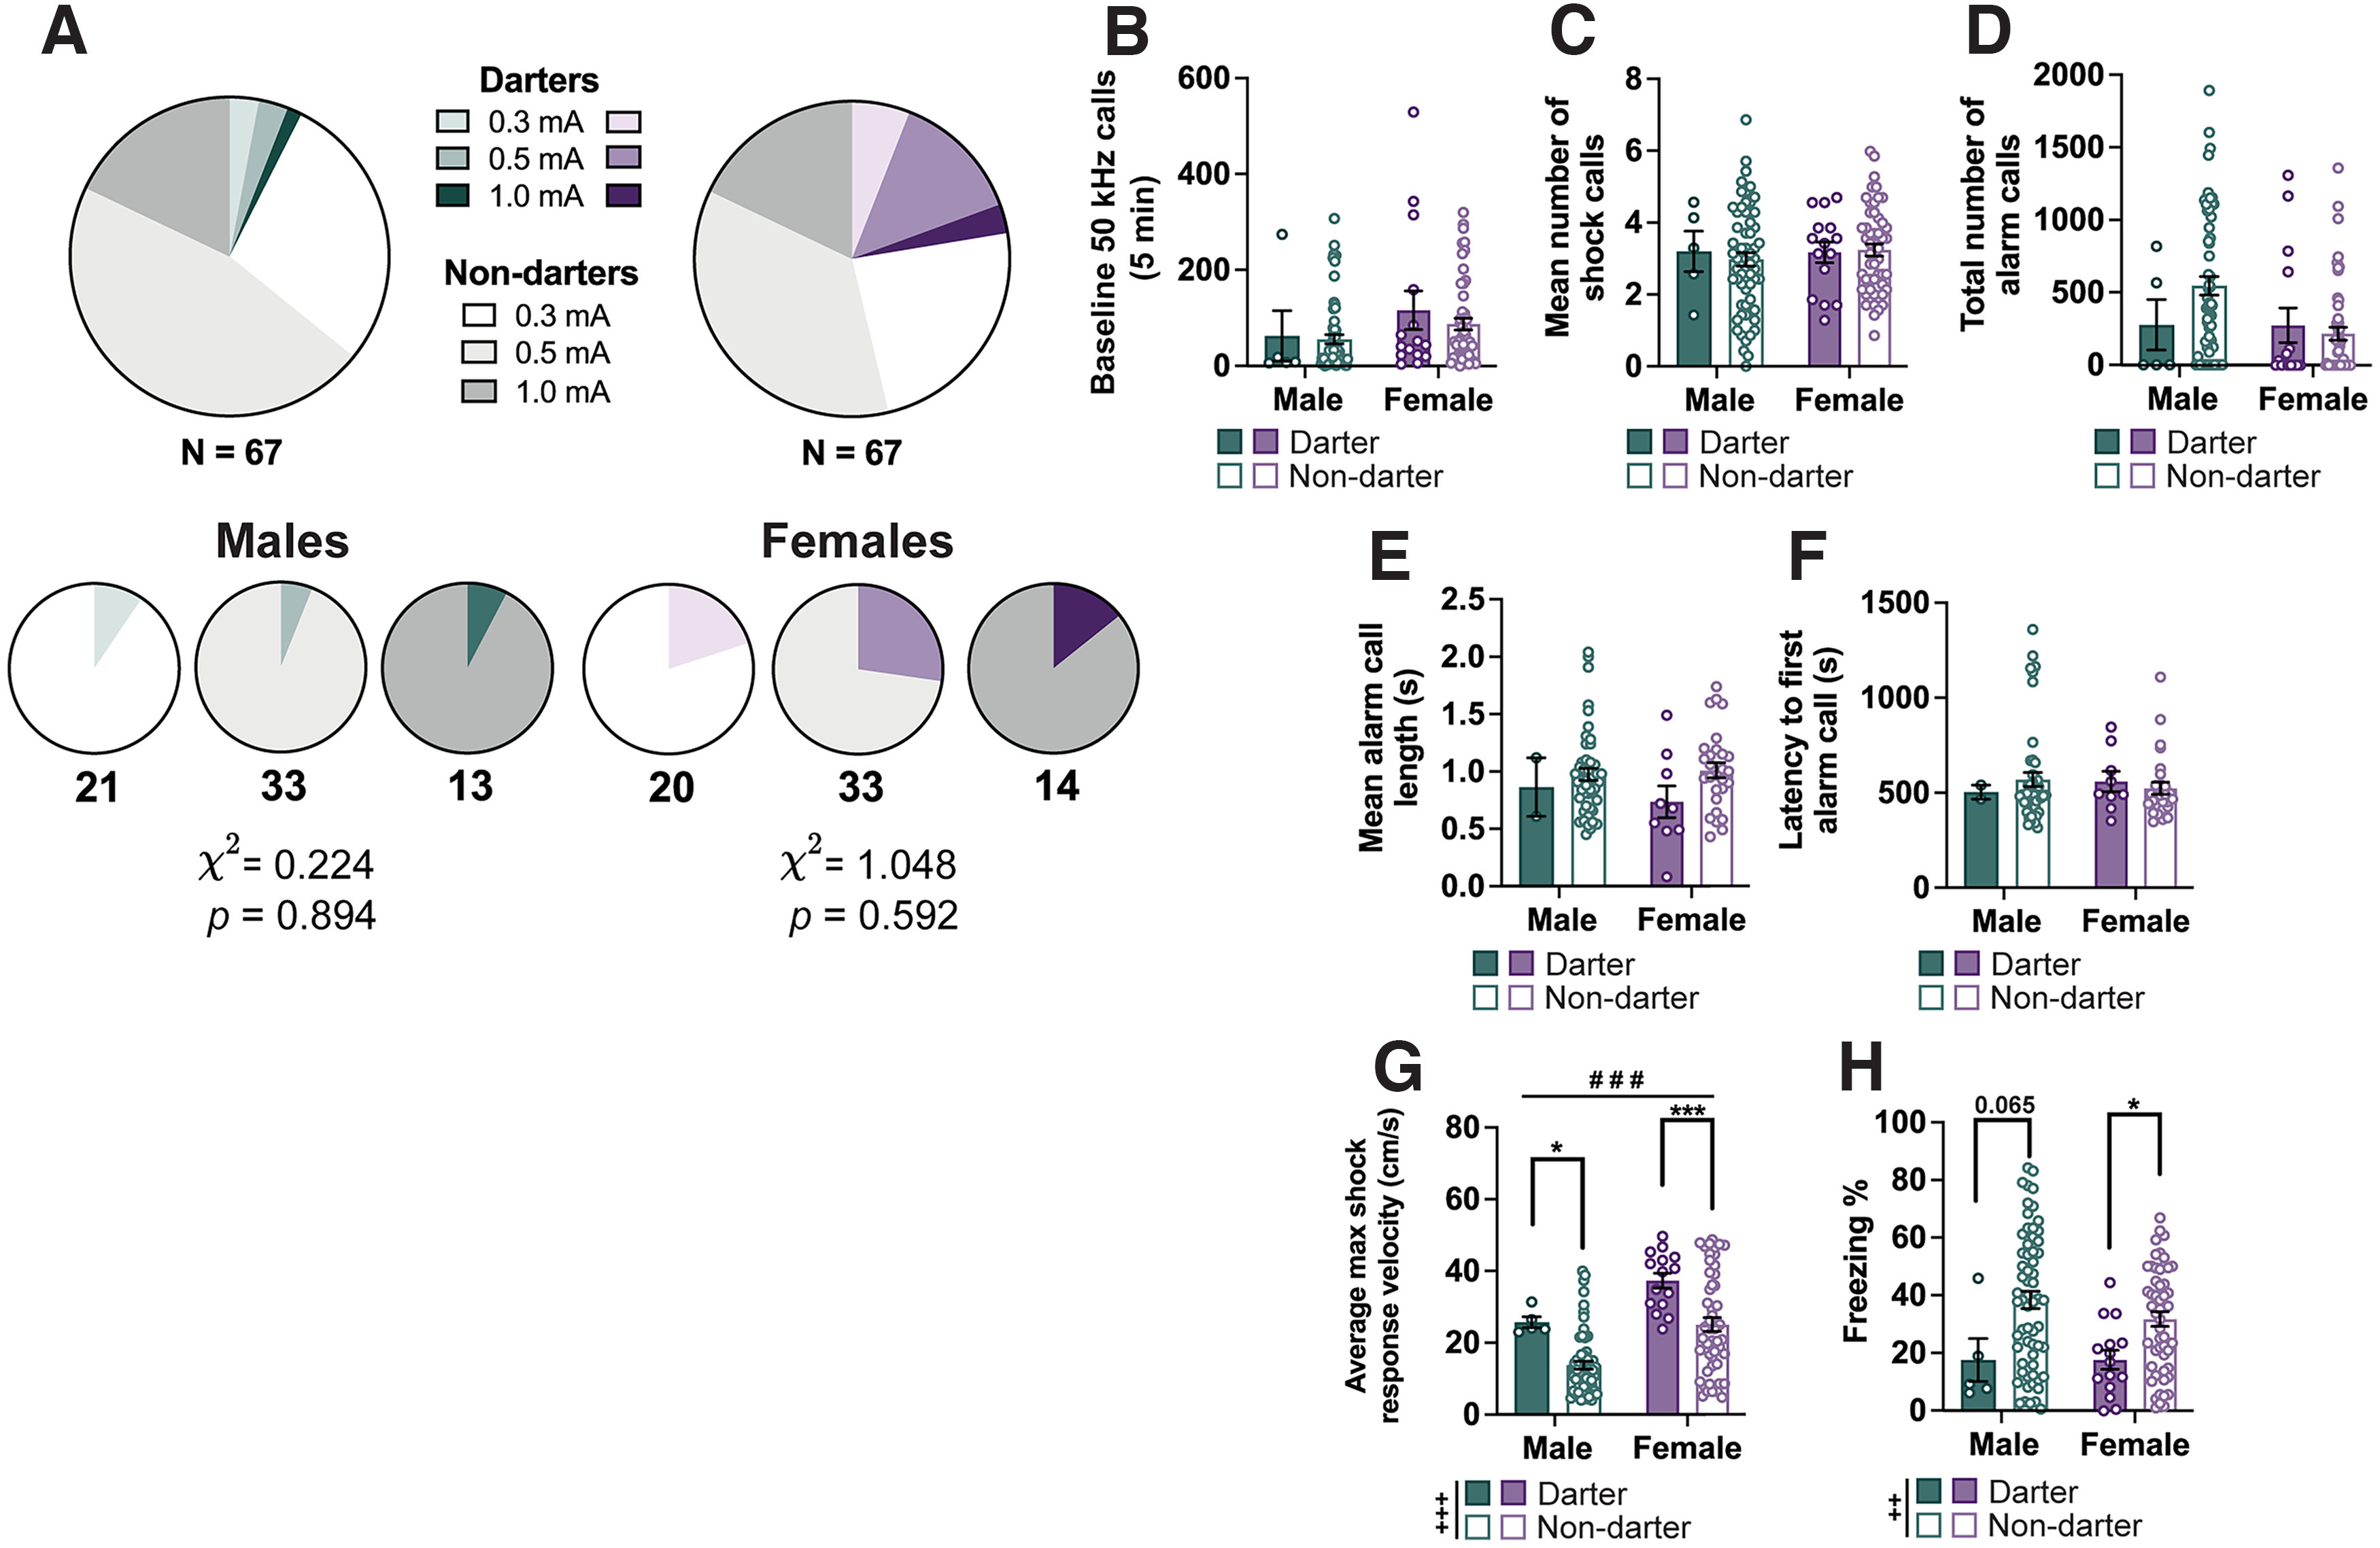
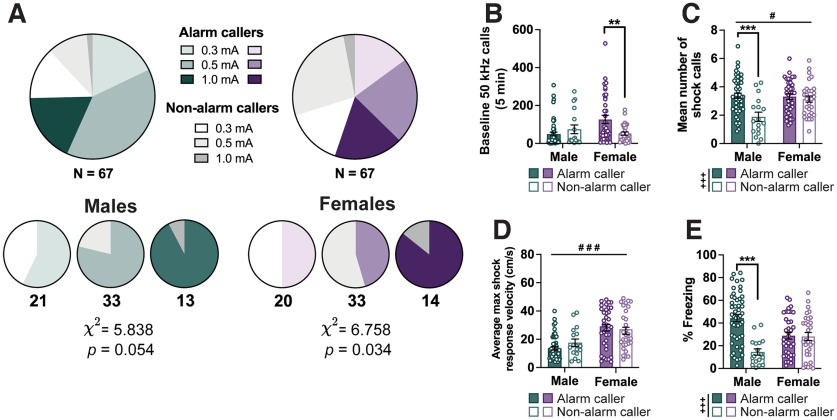
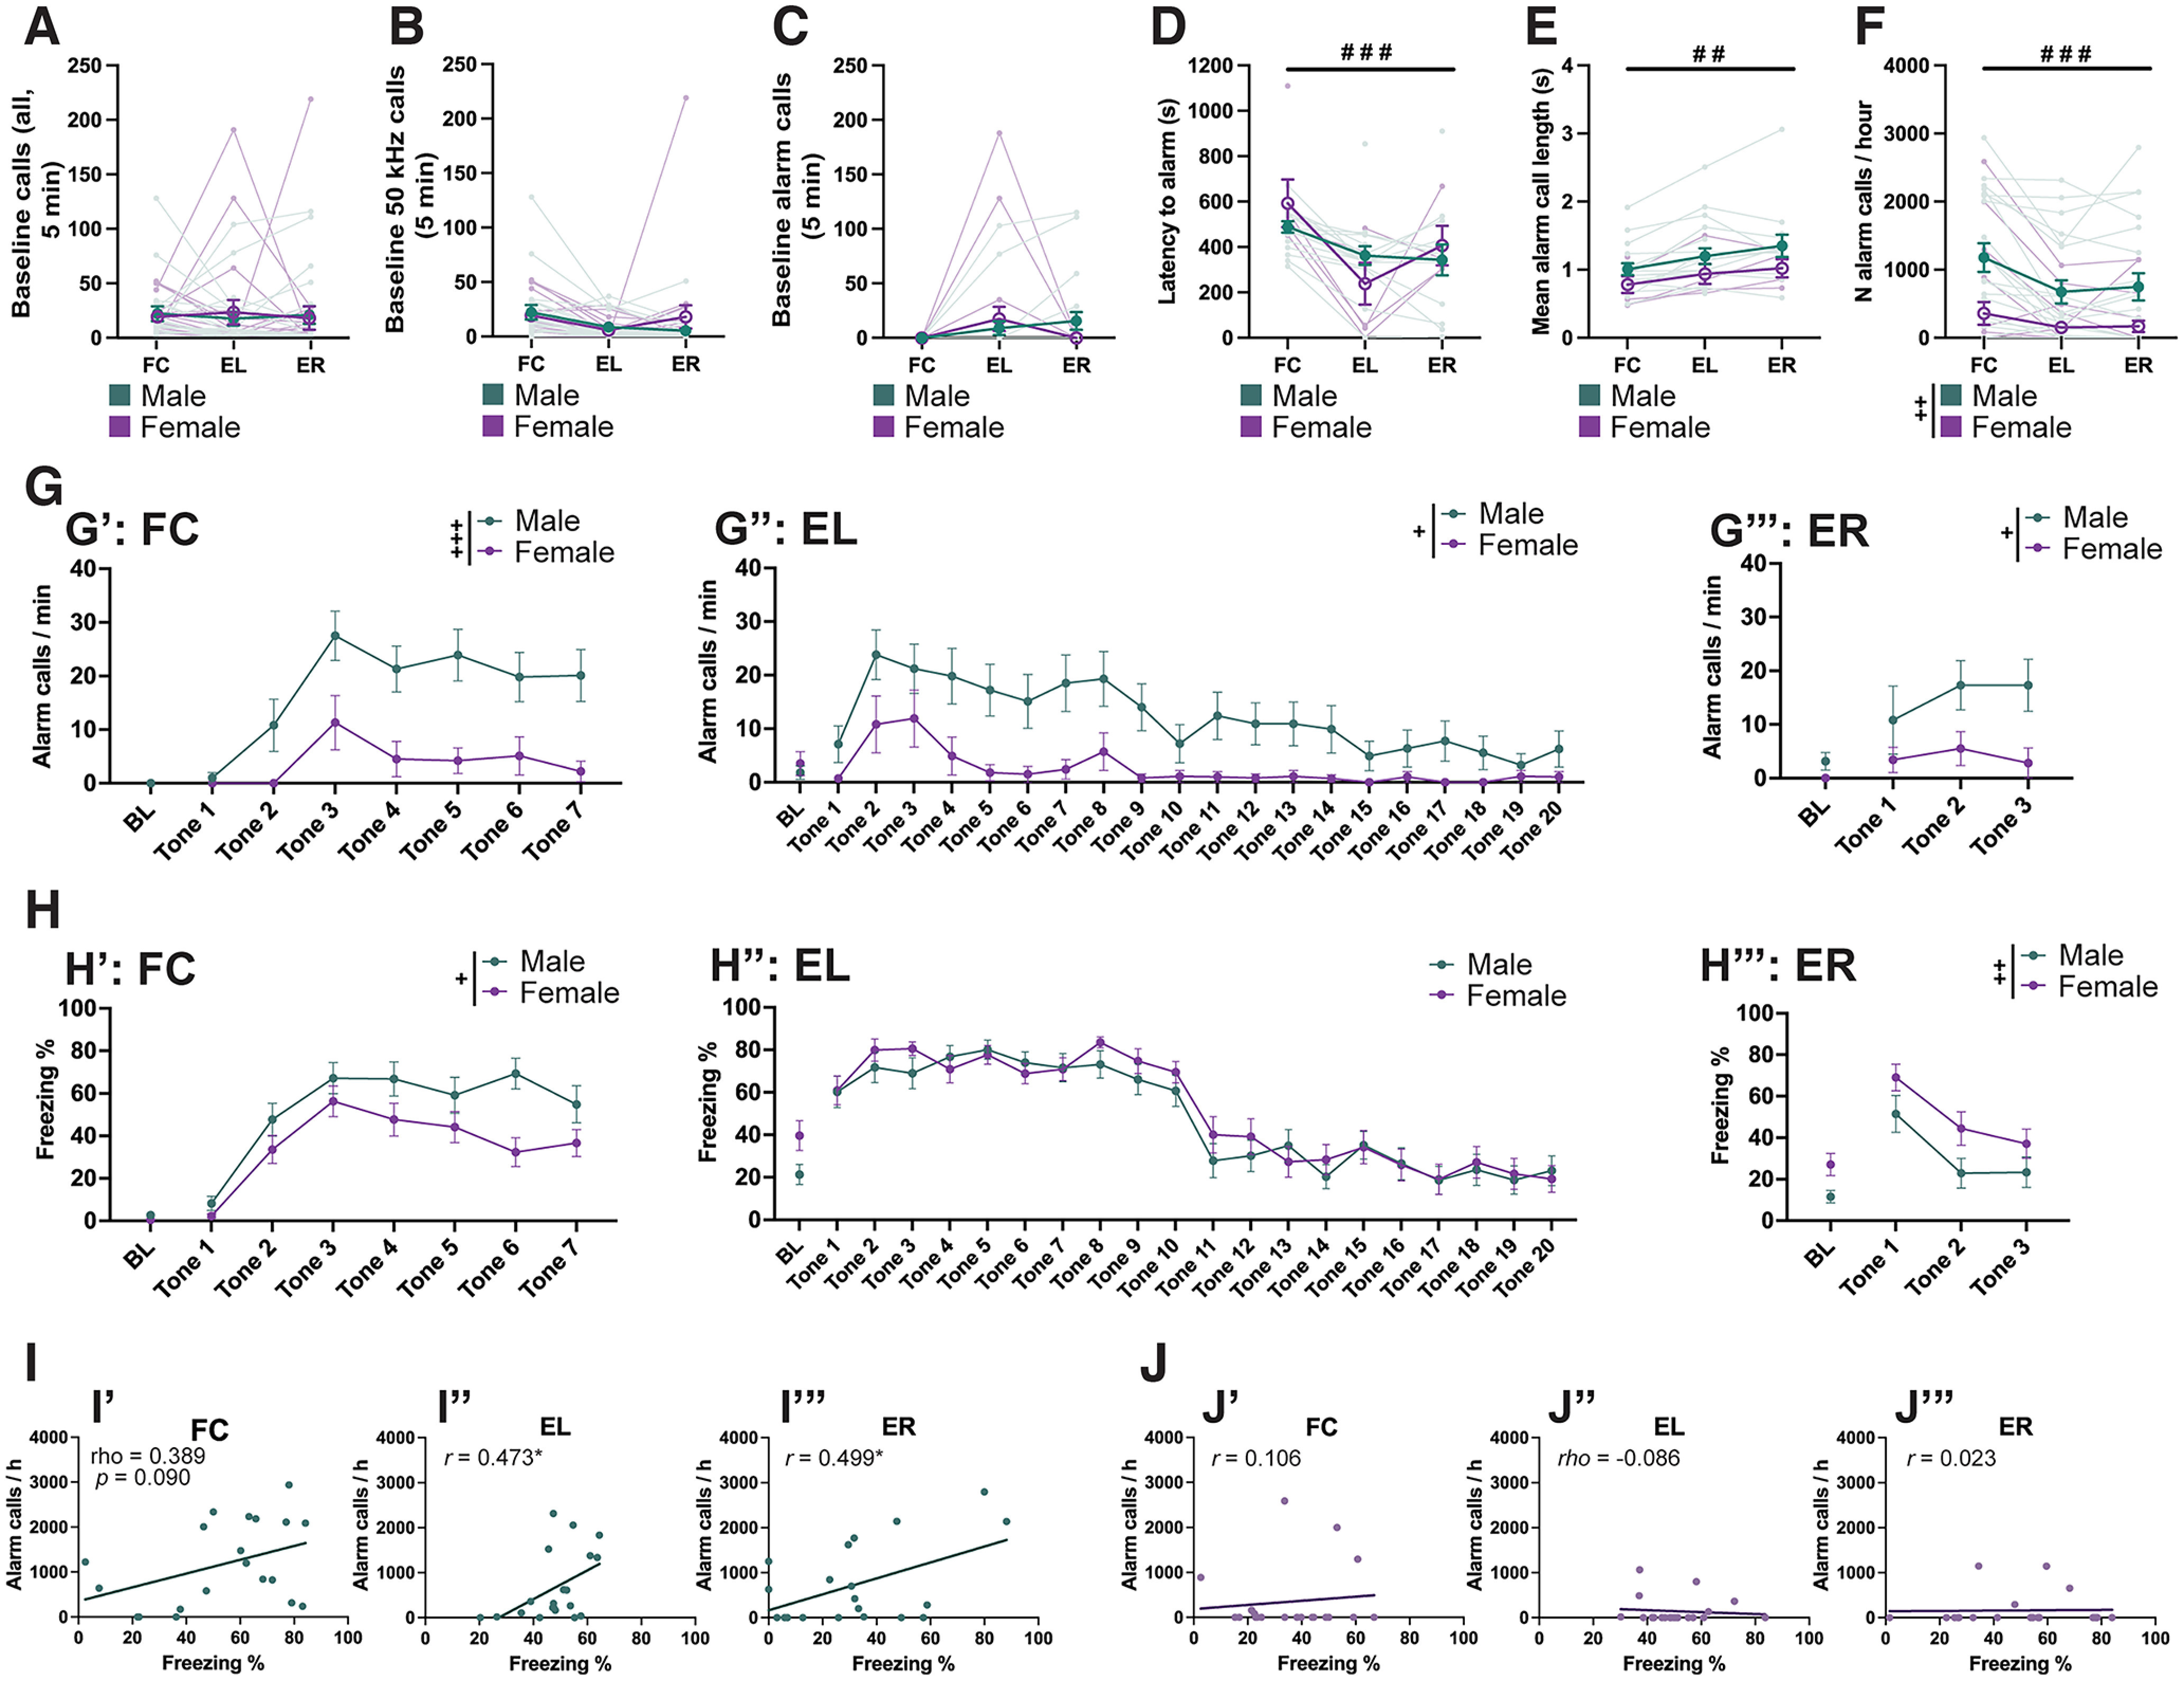
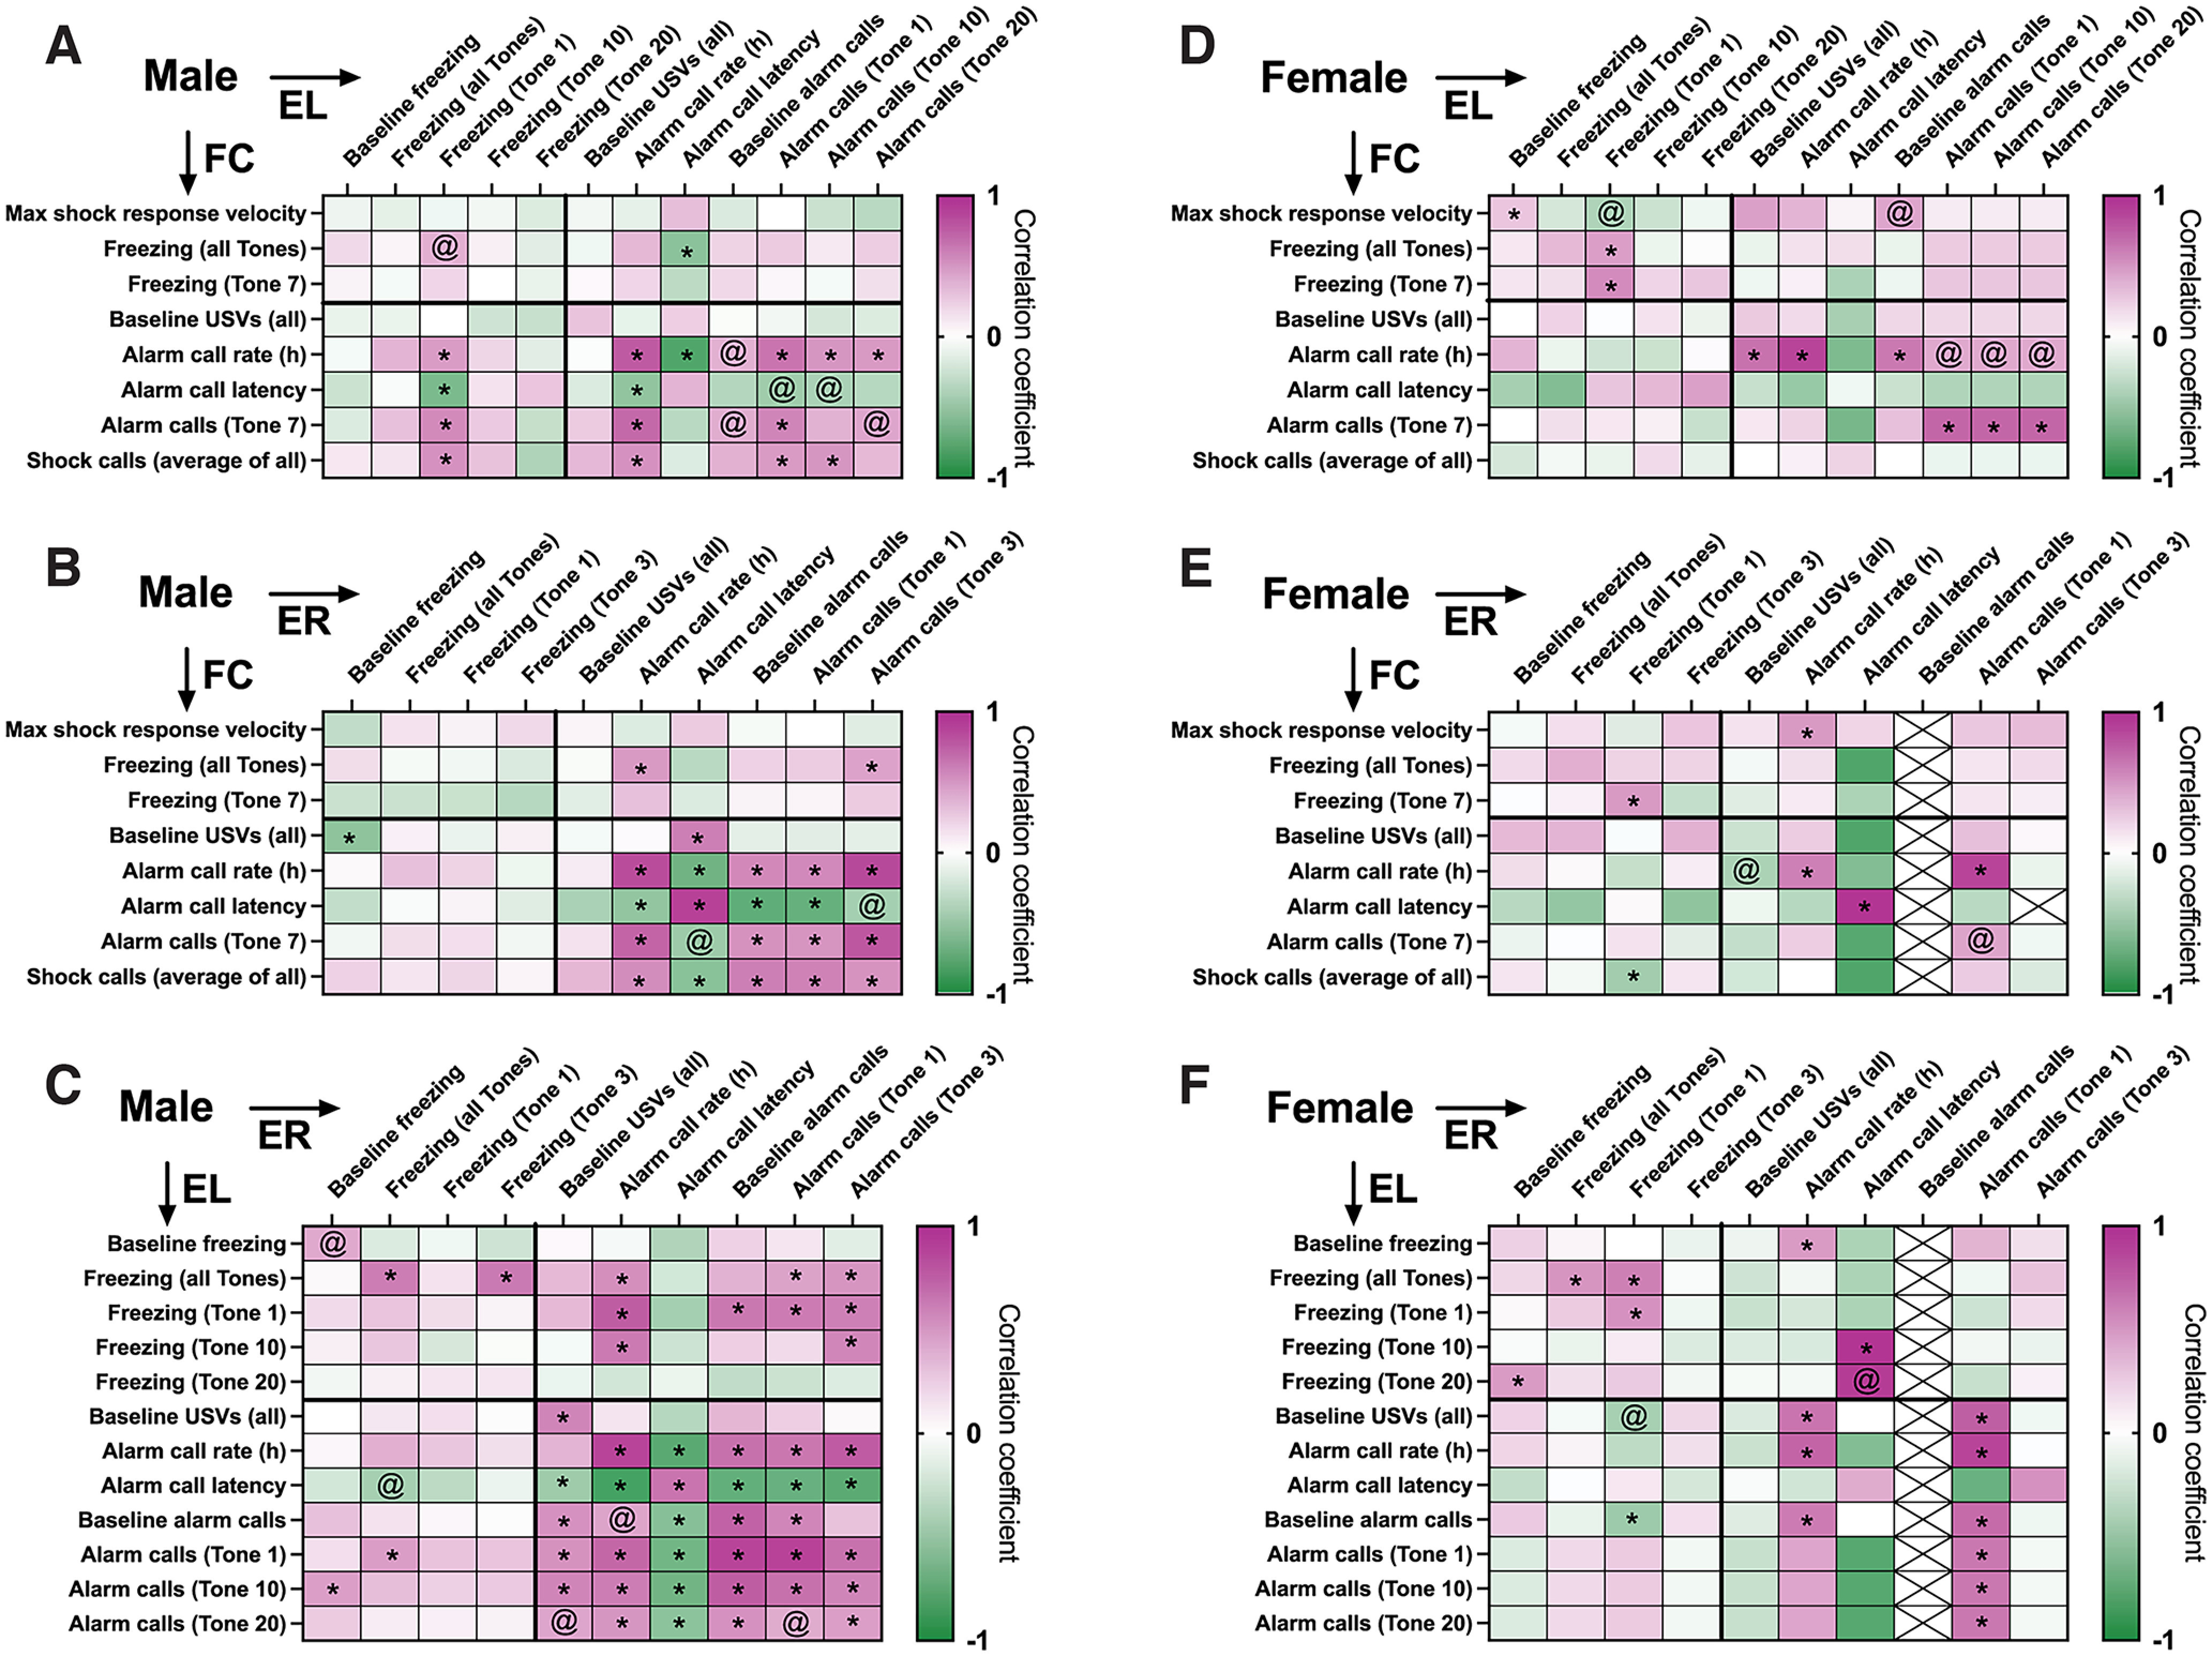
Pavlovian fear conditioning is a prevalent tool in the study of aversive learning, which is a key component of stress-related psychiatric disorders. Adult rats can exhibit various threat-related behaviors, including freezing, motor responses, and ultrasonic vocalizations (USVs). While these responses can all signal aversion, we know little about how they relate to one another. Here we characterize USVs emitted by male and female rats during cued fear acquisition and extinction, and assess the relationship between different threat-related behaviors. We found that males consistently emitted >22 kHz calls (referred to here as "alarm calls") than females, and that alarm call frequency in males, but not females, related to the intensity of the shock stimulus. Interestingly, 25% of males and 45% of females did not emit any alarm calls at all. Males that did make alarm calls had significantly higher levels of freezing than males who did not, while no differences in freezing were observed between female Alarm callers and Non-alarm callers. Alarm call emission was also affected by the predictability of the shock; when unpaired from a tone cue, both males and females started emitting alarm calls significantly later. During extinction learning and retrieval sessions, males were again more likely than females to emit alarm calls, which followed an extinction-like reduction in frequency. Collectively these data suggest sex dependence in how behavioral readouts relate to innate and conditioned threat responses. Importantly, we suggest that the same behaviors can signal sex-dependent features of aversion.

Keywords: SABV; defensive behaviors; fear conditioning; ultrasonic vocalizations.


Conflict of interest statement

The authors declare no competing financial interests.

Figures

Figure 1.
Figure 1.
Sex differences in ultrasonic baseline and shock calls, and freezing during fear conditioning. A, Schematic of cued fear conditioning showing timing and duration of tones (CS) and shocks (US). A subset of animals included here received clozapine-N-oxide (CNO) injections before fear conditioning as part of a different experiment but are analyzed together with other animals because no effect on alarm call parameters was observed (Extended Data Fig. 1-1). B, Representative spectrogram (from DeepSqueak) showing typical high-frequency ultrasonic calls (white arrows) recorded during the baseline period. C, Representative spectrogram showing typical shock calls (white arrows). Yellow lightning symbol denotes shock onset time. D, Bar graph showing the total number of baseline 50 kHz calls emitted by male and female rats before fear conditioning. E, Bar graph showing the mean number of shock calls emitted in response to each shock averaged across the trial (7 shocks) by each animal, split by sex and shock intensity. F, Percentage of time male rats within each shock intensity group spent freezing during baseline (BL; first 2 min) and each tone. G, Percentage of time female rats within each shock intensity group spent freezing during BL (first 2 min) and each tone. H, Comparison of the freezing percentage at the end of fear conditioning (tone 7) between males and females, and across shock intensities. N values: D: 67 males, 67 females; E–H: 67 males (0.3 mA = 21, 0.5 mA = 33, 1 mA = 13), 67 females (0.3 mA = 20, 0.5 mA = 33, 1 mA = 14). Bar graphs depict the mean ± SEM, and each dot represents a single animal. Symbols along line graphs indicate the mean ± SEM. Significant main effects of shock intensity (+) and sex (#), and post hoc/pairwise comparisons (*) are denoted with different symbols, with 1 (p <0.05), 2 (p <0.01), or 3 (p <0.001) symbols depicting the degree of significance.
Figure 2.
Figure 2.
Sex differences in ultrasonic alarm calls during fear conditioning. A, Representative spectrogram (from DeepSqueak) showing an ultrasonic alarm call captured during an intertrial interval, with a principal frequency of ∼22 kHz. Alarm calls were not observed in animals exposed only to the experimental context and tones (Extended Data Fig. 2-1). B, Bar graph depicting the latency of each animal to emit their first alarm call, split across sex and shock intensity. Dashed lines indicate the timing of the first and second tone starts. C, Bar graph depicting the total number of alarm calls emitted during a fear-conditioning trial, split across sex and shock intensity. D, Bar graph depicting the mean alarm call length, split across sex and shock intensity. E, Line graph showing the normalized (per minute) alarm call rate of male rats across shock intensity groups during baseline (BL; 5 min) and each tone. F, Line graph showing the normalized (per minute) alarm call rate of female rats across shock intensity groups during BL (5 min) and each tone. G, Comparison of alarm call rate at the end of fear conditioning (tone 7) between males and females, and across shock intensities. N values: C, E–G: 67 males (0.3 mA = 21, 0.5 mA = 33, 1 mA = 13), 67 females (0.3 mA = 20, 0.5 mA = 33, 1 mA = 14); B, D: 50 males (0.3 mA = 12, 0.5 mA = 26, 1 mA = 12), 37 females (0.3 mA = 10, 0.5 mA = 15, 1 mA = 12; Non-alarm callers excluded; Fig. 5, analysis of Alarm callers vs Non-alarm callers). Bar graphs depict the mean ± SEM, and each dot represents a single animal. Symbols along line graphs indicate the mean ± SEM. Significant main effects of shock intensity (+) and sex (#), and post hoc comparisons (*) are denoted with different symbols, with 1 (p <0.05), 2 (p <0.01), or 3 (p <0.001) symbols depicting the degree of significance.
Figure 3.
Figure 3.
Unpaired CS and US results in delayed latency to alarm call. A, B, Schematics of cued fear conditioning showing timing and duration of tones (CS) and shocks (US) for paired (A) and unpaired (B) protocols. All animals in this cohort received 0.5 mA footshocks. C, Bar graph showing the mean number of shock calls emitted in response to each shock averaged across the trial (7 shocks) by each animal. D, Bar graph depicting the total number of alarm calls emitted during a fear-conditioning trial. E, Bar graph depicting the mean alarm call length. F, Bar graph depicting the latency of each animal to emit their first alarm call. G, Bar graph depicting the maximum velocity reached in response to each shock averaged across all 7 shocks within a trial by each animal. H, Line graph showing the percentage of time male and female rats within each protocol group (paired vs unpaired) spent freezing during baseline (BL; first 2 min) and each tone. I, Line graph showing the normalized (per minute) alarm call rate of male and female rats within each protocol group (paired vs unpaired) during BL (5 min) and each tone. N values: C, D, G–I: paired: 18 males, 16 females; unpaired: 16 males, 16 females; E, F: Paired: 16 males, 10 females; Unpaired, 11 males, 9 females (Non-alarm callers excluded). Bar graphs depict the mean ± SEM, and each dot represents a single animal. Symbols along line graphs indicate the mean ± SEM. Significant main effects of pairing (+) and sex (#), and post hoc comparisons (*) are denoted with different symbols, with 1 (p <0.05), 2 (p <0.01), or 3 (p <0.001) symbols depicting the degree of significance.
Figure 4.
Figure 4.
Darting does not associate with differences in USV features in either sex. A, Pie charts showing the proportion of Darters and Non-darters across the whole male and female cohorts (top row) and separately for each shock intensity group (bottom row). Numbers underneath each chart denote the number of animals included within the chart, and the χ2 statistics for the effect of shock intensity on Darter group separately for males and females. B, Bar graph showing the total number of baseline 50 kHz calls emitted by male and female Darters and Non-darters before fear conditioning. C, Bar graph showing the mean number of shock calls emitted in response to each shock averaged across the trial (7 shocks) by each animal. D, Bar graph depicting the total number of alarm calls emitted during a fear-conditioning trial. Two-way ANOVA suggests no significant main effects or interactions. E, Bar graph depicting the mean alarm call length. F, Bar graph depicting the latency of each animal to emit their first alarm call. G, Bar graph depicting the maximum velocity reached in response to each shock averaged across all 7 shocks within a trial by each animal. H, Bar graphs showing the percentage of time animals spent freezing across all 7 tones of a trial. N values: B–H: Males: 5 Darters, 62 Non-darters; Females: 15 Darters, 52 Non-darters. Bar graphs depict the mean ± SEM, and each dot represents a single animal. Significant main effects of darting (+) and sex (#), and post hoc comparisons (*) are denoted with different symbols, with 1 (p <0.05), 2 (p <0.01), or 3 (p <0.001) symbols depicting degree of significance.
Figure 5.
Figure 5.
Tendency to emit alarm calls as a dichotomous phenotype associates with freezing in males only. A, Pie charts showing the proportion of Alarm callers and Non-alarm callers across the whole male and female cohorts (top row) and separately for each shock intensity group (bottom row). Numbers underneath each chart denote the number of animals included within the chart and the χ2 statistics for the effect of shock intensity on alarm call group separately for males and females. B, Bar graph showing the total number of baseline 50 kHz calls emitted by male and female Alarm callers and Non-alarm callers before fear conditioning. C, Bar graph showing the mean number of shock calls emitted in response to each shock averaged across the trial (7 shocks) by each animal. D, Bar graph depicting the maximum velocity reached in response to each shock averaged across all 7 shocks within a trial by each animal. E, Bar graphs showing the percentage of time animals spent freezing across all 7 tones of a trial. Removing Non-alarm callers did not significantly alter the findings presented in Figure 2 (Extended Data Fig. 5-1). N values: B–E: Males: 50 Alarm callers, 17 Non-alarm callers; Females: 37 Alarm callers, 30 Non-alarm callers. Bar graphs depict the mean ± SEM, and each dot represents a single animal. Significant main effects of alarm caller status (+) and sex (#), and post hoc comparisons (*) are denoted with different symbols, with 1 (p <0.05), 2 (p <0.01), or 3 (p <0.001) symbols depicting the degree of significance.
Figure 6.
Figure 6.
Sex differences in extinction of alarm calling. A–F, Connected scatter plots of the number of all USVs (A), all 50 kHz calls (B) and all alarm calls (C) emitted during baseline, the latency to first alarm (D), the mean alarm call length (E), and the rate of alarm calls normalized to 1 h (F) of male and female rats during fear conditioning (FC), extinction learning (EL), and extinction retrieval (ER). Light colors represent individual animals, while dark colors with error bars represent sex means. G, The rate of alarm calls, normalized per 1 min, during the baseline (BL) and each tone presentation during FC (G), EL (G′′), and ER (G′′′), shown separately for males and females. H, Percentage of time spent freezing during the first 2 min of BL for FC (H), and the first 5 min of BL for EL (H′′) and ER (H′′′). I, J, Scatter plots and regression lines showing the within-trial correlation of freezing (x-axis) and alarm call rate (y-axis) for each trial (′, FC; ′′, EL; ′′′, ER), shown separately for males (I) and females (J). Correlation coefficients (r = Pearson’s r; rho = Spearman’s ρ) are shown inside each panel. N values: A–C, F–J: 20 males, 20 females; D, E: 20 males, 8 females (excluding animals who made no alarm calls in any trial). Dark-toned data points depict the mean ± SEM. Significant main effects of sex (+) and trial type (#) are denoted with different symbols, with 1 (p <0.05), 2 (p <0.01), or 3 (p <0.001) symbols depicting the degree of significance.
Figure 7.
Figure 7.
Correlation patterns of freezing and alarm call rates across fear conditioning (FC), extinction learning (EL), and extinction retrieval (ER). A–F, Heatmaps showing correlation coefficients (Pearson’s or Spearman’s coefficient, depending on the distribution of the data in each variable pair) of motor and vocal behaviors during one of the trials (y-axis) and one of the subsequent trials (x-axis), separately for males (A–C) and females (D, E). Color scale corresponds to correlation coefficient and direction (magenta, positive; green, negative). Significant (uncorrected, p <0.05) correlations are marked by *, trending (uncorrected, p <0.1) correlations are marked by @.

Similar articles

Cited by

References

    1. Bangasser DA, Cuarenta A (2021) Sex differences in anxiety and depression: circuits and mechanisms. Nat Rev Neurosci 22:674–684. 10.1038/s41583-021-00513-0 - DOI - PubMed
    1. Blanchard DC (2022) Sex, defense, and risk assessment: who could ask for anything more? Neurosci Biobehav Rev 144:104931. 10.1016/j.neubiorev.2022.104931 - DOI - PubMed
    1. Blanchard RJ, Flannelly KJ, Blanchard DC (1986) Defensive behavior of laboratory and wild Rattus norvegicus. J Comp Psychol 100:101–107. - PubMed
    1. Blanchard DC, Shepherd JK, Carobrez ADP, Blanchard RJ (1991) Sex effects in defensive behavior: baseline differences and drug interactions. Neurosci Biobehav Rev 15:461–468. 10.1016/S0149-7634(05)80132-0 - DOI - PubMed
    1. Blanchard RJ, Agullana R, McGee L, Weiss S, Blanchard DC (1992) Sex differences in the incidence and sonographic characteristics of antipredator ultrasonic cries in the laboratory rat (Rattus norvegicus). J Comp Psychol 106:270–277. 10.1037/0735-7036.106.3.270 - DOI - PubMed

Publication types

LinkOut - more resources