. 2023 May;91(5):585-592.
doi: 10.1002/prot.26451. Epub 2022 Dec 13.

Oxygen-insensitive nitroreductase E. coli NfsA, but not NfsB, is inhibited by fumarate

Affiliations

Oxygen-insensitive nitroreductase E. coli NfsA, but not NfsB, is inhibited by fumarate

Martin A Day et al. Proteins. 2023 May.

Abstract

Escherichia coli NfsA and NfsB are founding members of two flavoprotein families that catalyze the oxygen-insensitive reduction of nitroaromatics and quinones by NAD(P)H. This reduction is required for the activity of nitrofuran antibiotics and the enzymes have also been proposed for use with nitroaromatic prodrugs in cancer gene therapy and biocatalysis, but the roles of the proteins in vivo in bacteria are not known. NfsA is NADPH-specific whereas NfsB can also use NADH. The crystal structures of E. coli NfsA and NfsB and several analogs have been determined previously. In our crystal trials, we unexpectedly observed NfsA bound to fumarate. We here present the X-ray structure of the E. coli NfsA-fumarate complex and show that fumarate acts as a weak inhibitor of NfsA but not of NfsB. The structural basis of this differential inhibition is conserved in the two protein families and occurs at fumarate concentrations found in vivo, so impacting the efficacy of these proteins.

Keywords: FMN; Nitroreductase; flavoprotein; fumarate; nitrofuran; prodrug.


Conflict of interest statement

No commercial interest.

Figures
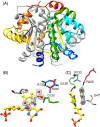
FIGURE 1
FIGURE 1
X‐ray structure of fumarate bound to NfsA. (A) Ribbon diagram of NfsA dimer, with bound fumarate. One subunit is in gray and the other is in rainbow colors blue to red from N‐ to C‐ terminus. The FMN cofactor is shown as ball and stick, with C atoms in yellow, N blue, oxygen red, and phosphorus orange. The side chains that interact with the bound fumarate are shown as sticks, with carbon atoms colored as the ribbon backbone, and heteroatoms as for FMN. The ligand is shown in tan, with oxygen atoms in red. (B,C) Two orientations of fumarate bound to NfsA. The FMN and fumarate are shown in ball and stick, colored as in A. The side chains that interact with fumarate are shown as sticks, labeled and colored as in A, with Ser 41, from the opposite subunit to the other interacting residues, given a prime notation. Cyan lines show the hydrogen bonding to the ligand. The mesh shows the electron density within a radius of 2 Å from the fumarate (level 0.53 e) at 1 sigma.
FIGURE 2
FIGURE 2
Steady‐state kinetics of NfsA with fumarate. Left: Steady‐state kinetics of NfsA with 100 μM NADPH, varying nitrofurazone, in the presence and absence of fumarate. Right: Steady‐state kinetics of NfsA with nitrofurazone at 75 μM, varying NADPH concentration in the presence or absence of fumarate. The reaction was done in a 10 mM Tris pH 7 buffer, 4.5% DMSO, with total ionic strength 50 mM, at 25°C. The symbols show the data, the lines show the simulated curves to Equation 1, mixed inhibition, with k cat 25 s−1, K m NADPH 29 μM, K m NFZ 27 μM, Ki NADPH 145 μM, Ki NFZ 960 μM.
FIGURE 3
FIGURE 3
Steady‐state kinetics of NfsA with succinate. Left: Steady‐state kinetics of NfsA with 100 μM NADPH, varying nitrofurazone, in the presence and absence of succinate. Right: Steady state kinetics of NfsA with nitrofurazone at 30 μM, varying NADPH concentration in the presence or absence of succinate. The reactions were done in a 10 mM Tris pH 7 buffer, 4.5% DMSO, with total ionic strength 150 mM, at 25°C. The symbols show the data, the lines show the simulated curves to Equation 1, with k cat 51 s−1, K m NADPH 69 μM, K m NFZ 58 μM, K i NADPH 4.3 mM.
FIGURE 4
FIGURE 4
Steady‐state kinetics of NfsB with fumarate and succinate. Left: Steady‐state kinetics of NfsB with NADH at 100 μM, varying the nitrofurazone concentration in the presence or absence of 1 mM succinate or 1 mM fumarate. The line shows the Michaelis–Menten curve with k cat 16.7  s−1 and K m NADH 32 μM. Right: Steady state kinetics of NfsB with 300 μM nitrofurazone , varying the concentration of NADH, in the presence and absence of 1 mM succinate or 1 mM fumarate. The line shows the Michaelis–Menten curve with k cat 36 s−1 and K m NFZ 20 μM. The reactions were done in a 10 mM Tris pH 7 buffer, 4.5% DMSO, with total ionic strength 50 mM, at 25°C. The symbols show the data, black circles – no inhibitor, white circles‐ 1 mM fumarate, inverted triangles‐ 1 mM succinate.
FIGURE 5
FIGURE 5
Comparison of the X‐ray structures of NfsB and NfsA. (A) Ribbon diagram of NfsB dimer with bound nicotinate, from 1ICR, in the same orientation as NfsA in Figure 1. The core residues of the two subunits are in gray and blue, with residues 95–132, not found in NfsA, in in gold and magenta, respectively. The FMN cofactor is shown as ball and stick, with C atoms in yellow, N blue, O red, and P orange. The side chains that interact with the bound nicotinate are labeled and shown as sticks, with carbon atoms colored as the ribbon backbone, and heteroatoms as for FMN. The nicotinate ligand is shown in ball and stick with C atoms in gray and others in CPK colors. (B) Ribbon diagram of NfsA dimer with bound fumarate, in the same orientation as NfsB. One subunit is in tan and the other in cyan, with residues 180–240, not found in NfsB, in gold and magenta, respectively. The side chains that interact with the bound fumarate are labeled and shown as sticks, with carbon atoms colored as the ribbon backbone, and heteroatoms as for FMN. The FMN is colored as in A with the fumarate in ball and stick with C atoms in gray and oxygen in red. (C,D) Coulombic surface representation of NfsB, and NfsA respectively, in the same orientation as in A and B. The FMN and ligands are shown as ball and stick, colored as in A and B. The surface is colored red through white to blue corresponding to negative, through uncharged to positive charge.

References

    1. Roldan MD, Perez‐Reinado E, Castillo F, Moreno‐Vivian C. Reduction of polynitroaromatic compounds: the bacterial nitroreductases. FEMS Microbiol Rev. 2008;32(3):474‐500. - PubMed
    1. Williams EM, Little RF, Mowday AM, et al. Nitroreductase gene‐directed enzyme prodrug therapy: insights and advances toward clinical utility. Biochem J. 2015;471:131‐153. - PubMed
    1. Clark AJ, Iwobi M, Cui W, et al. Selective cell ablation in transgenic mice expressing E. coli nitroreductase. Gene Ther. 1997;4:101‐110. - PubMed
    1. Kaya F, Mannioui A, Chesneau A, et al. Live imaging of targeted cell ablation in xenopus: a new model to study demyelination and repair. J Neurosci. 2012;32(37):12885‐12895. - PMC - PubMed
    1. Curado S, Anderson RM, Jungblut B, Mumm J, Schroeter E, Stainier DYR. Conditional targeted cell ablation in zebrafish: a new tool for regeneration studies. Dev Dyn. 2007;236(4):1025‐1035. - PubMed

Publication types

MeSH terms

LinkOut - more resources