. 2022 Nov 28;13(1):7212.
doi: 10.1038/s41467-022-34295-5.

Active DNA damage response signaling initiates and maintains meiotic sex chromosome inactivation

Affiliations

Active DNA damage response signaling initiates and maintains meiotic sex chromosome inactivation

Hironori Abe et al. Nat Commun. .

Abstract

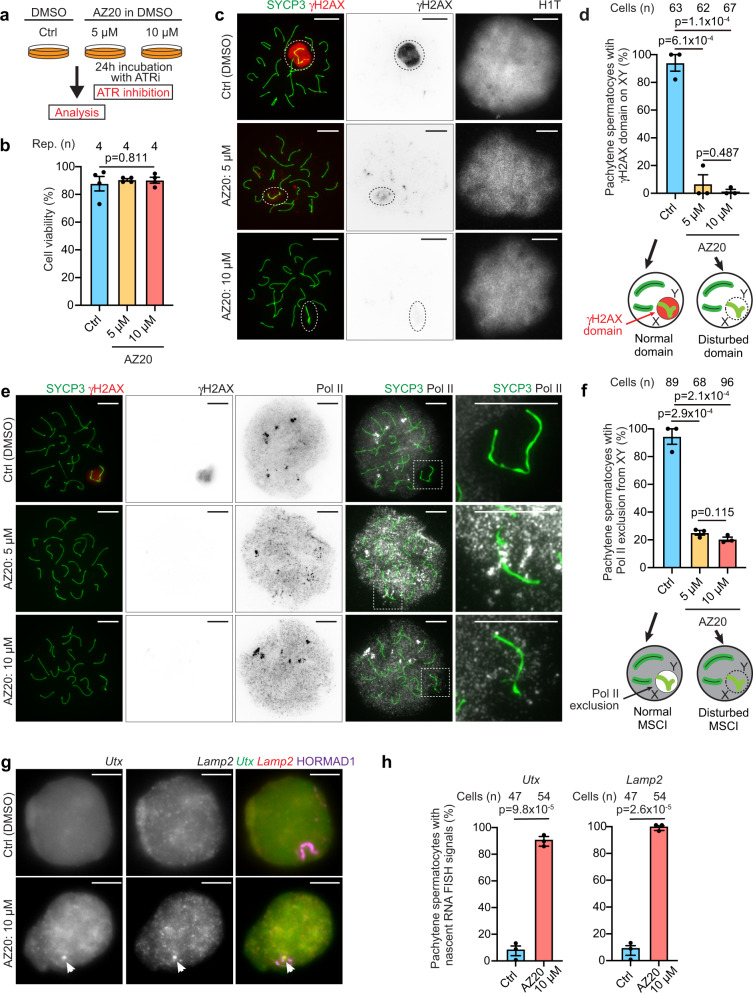
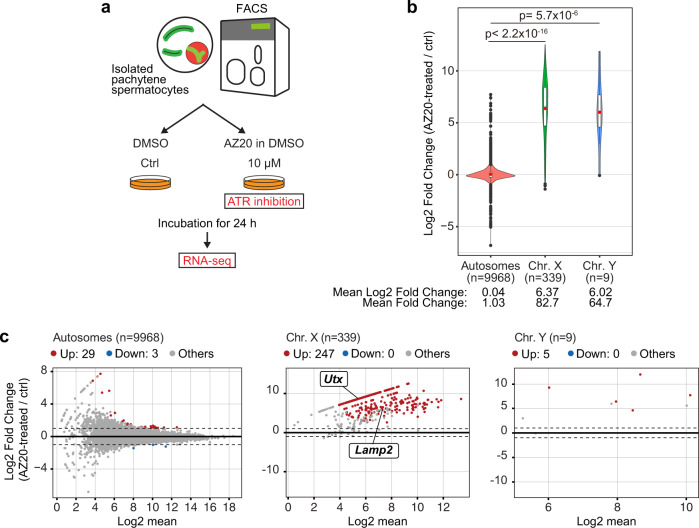
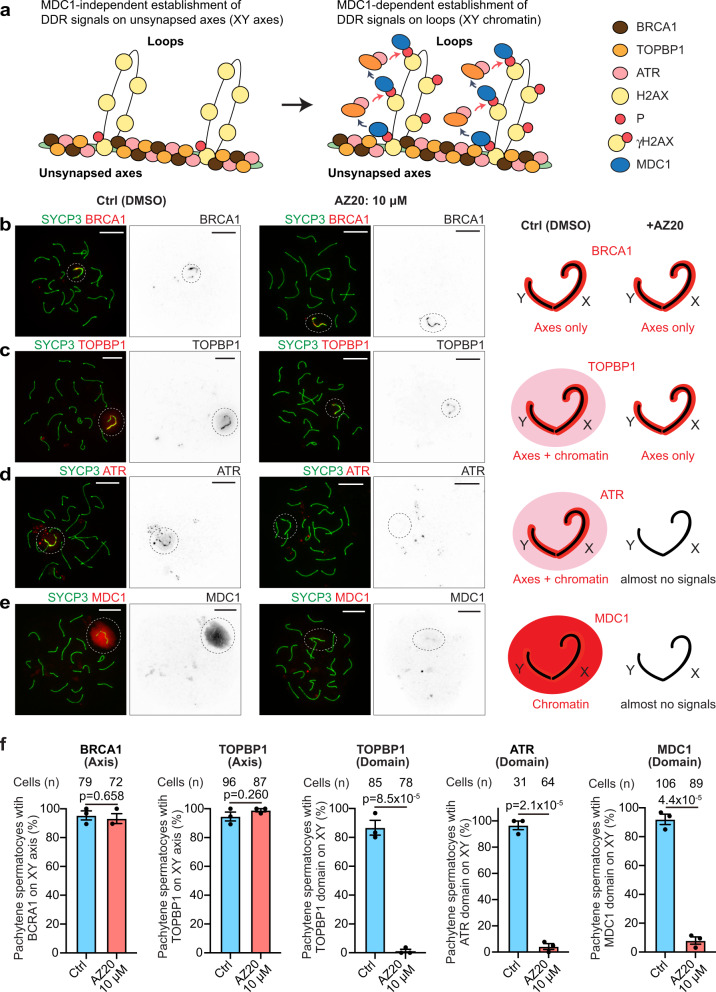
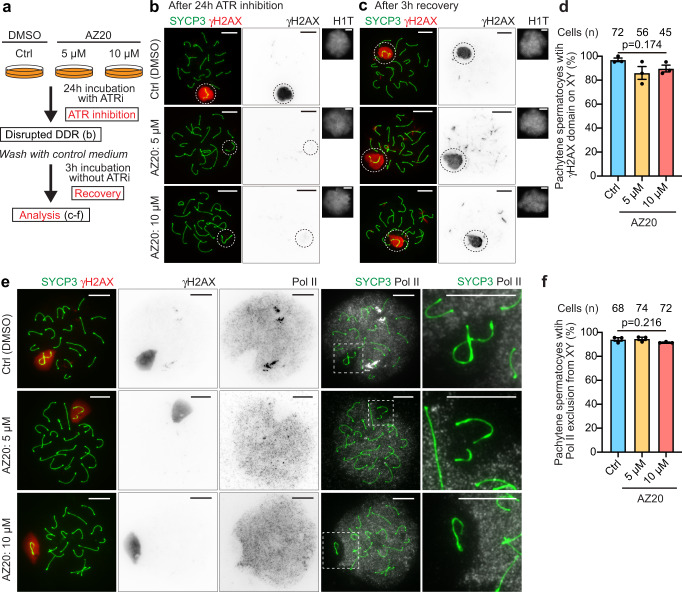
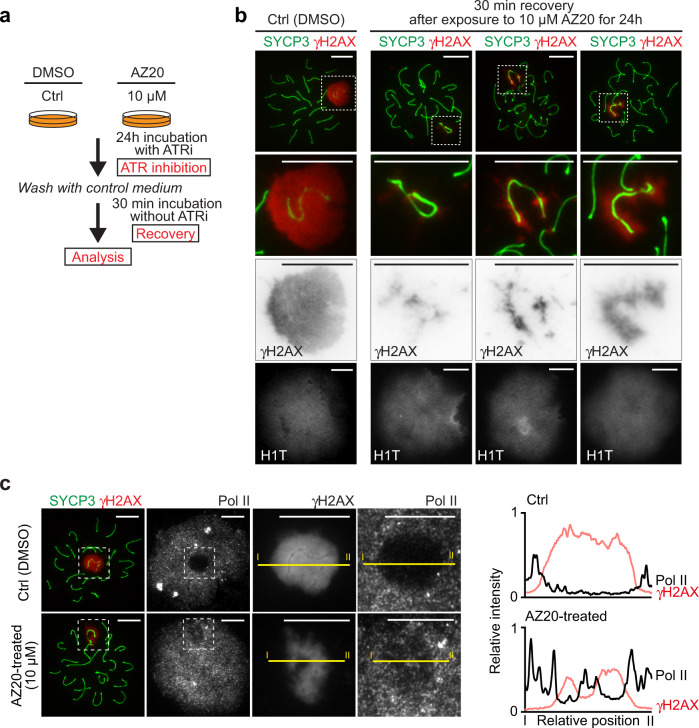
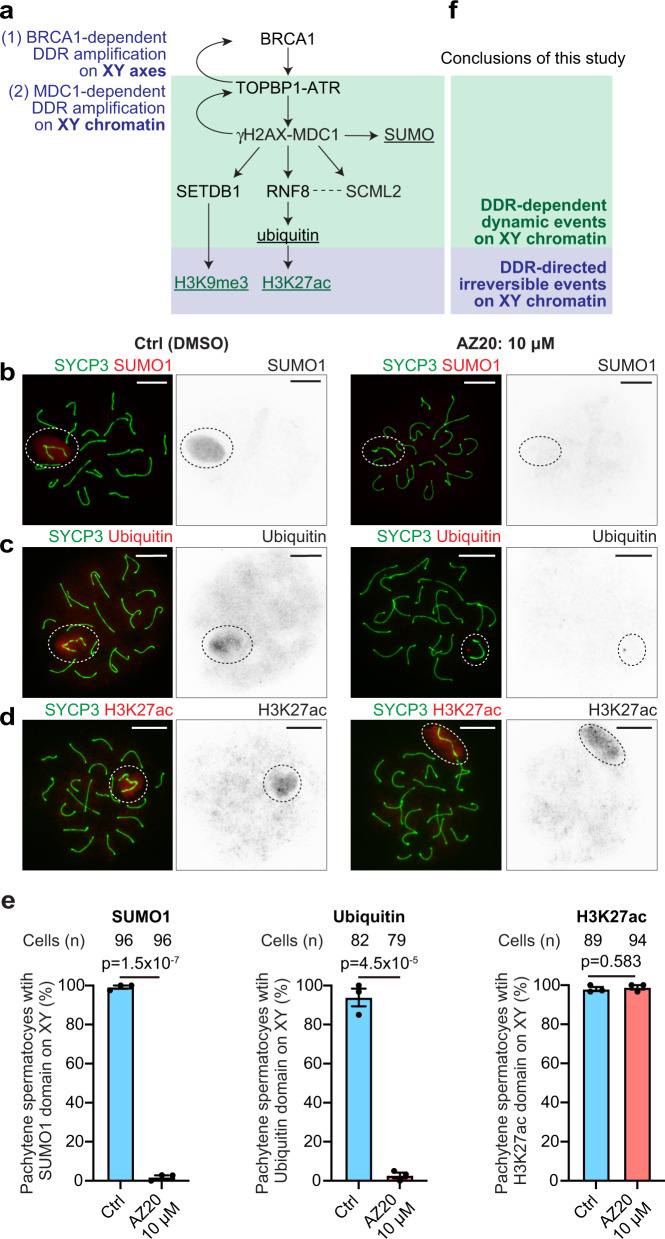
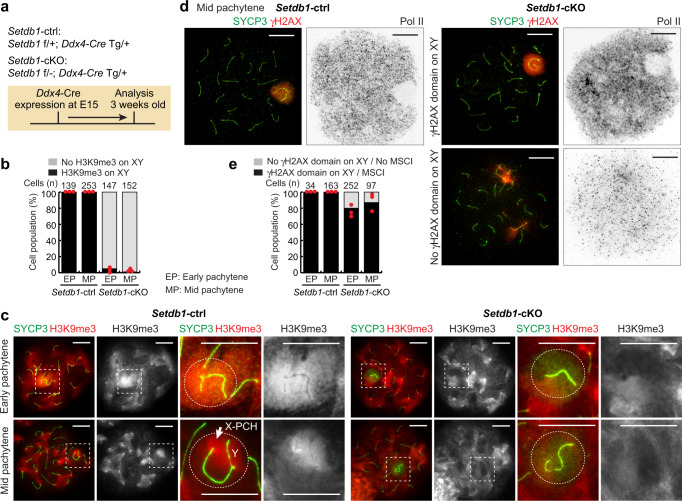
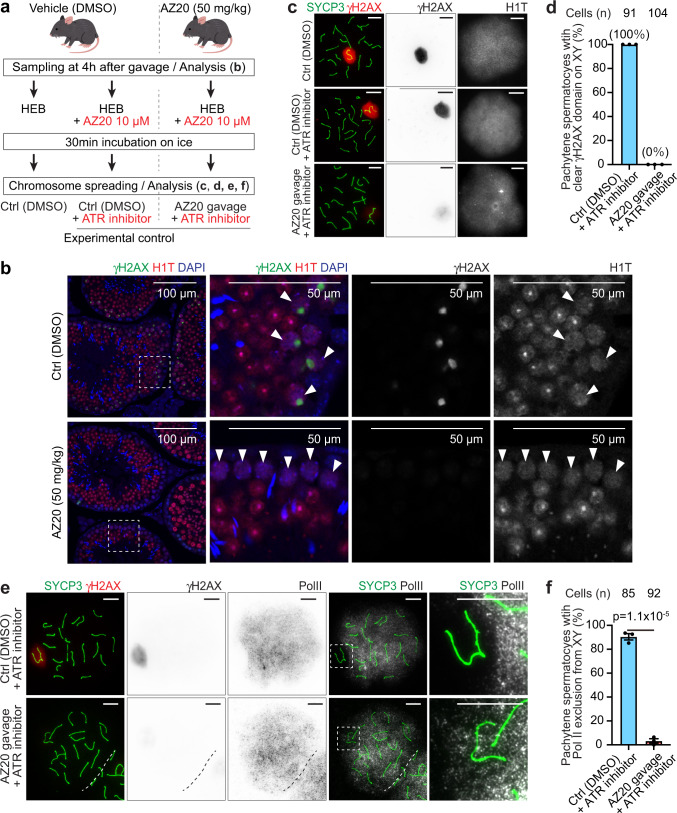
Meiotic sex chromosome inactivation (MSCI) is an essential process in the male germline. While genetic experiments have established that the DNA damage response (DDR) pathway directs MSCI, due to limitations to the experimental systems available, mechanisms underlying MSCI remain largely unknown. Here we establish a system to study MSCI ex vivo, based on a short-term culture method, and demonstrate that active DDR signaling is required both to initiate and maintain MSCI via a dynamic and reversible process. DDR-directed MSCI follows two layers of modifications: active DDR-dependent reversible processes and irreversible histone post-translational modifications. Further, the DDR initiates MSCI independent of the downstream repressive histone mark H3K9 trimethylation (H3K9me3), thereby demonstrating that active DDR signaling is the primary mechanism of silencing in MSCI. By unveiling the dynamic nature of MSCI, and its governance by active DDR signals, our study highlights the sex chromosomes as an active signaling hub in meiosis.


Conflict of interest statement

The authors declare no competing interests.

Figures

Fig. 1
Fig. 1. Active ATR-dependent DDR signaling is required for the maintenance of MSCI.
a Schematic of the experimental design (ATRi: ATR inhibitor). b Viability of cultured cells after 24 h incubation shown as the mean ± s.e.m. for 4 independent experiments. c Chromosome spreads of mid-late pachytene spermatocytes immunostained with antibodies raised against SYCP3, which is a marker of meiotic chromosome axes, γH2AX, and H1T. XY chromosomes are indicated with dashed circles. d Quantification of mid-late pachytene spermatocytes with a normal γH2AX domain on the XY shown as the mean ± s.e.m. for 3 independent experiments. e Chromosome spreads of mid-late pachytene spermatocytes immunostained with antibodies raised against SYCP3, Pol II, and γH2AX. XY chromosomes are indicated with dashed squares and are magnified in the panels to the right. f Quantification of mid-late pachytene spermatocytes with normal MSCI defined by Pol II exclusion shown as the mean ± s.e.m. for 3 independent experiments. g Gene-specific RNA FISH for X-linked Utx and Lamp2 genes. XY axes were detected by immunostaining with antibodies raised against HORMAD1. RNA FISH signals (nascent transcripts) are indicated with arrowheads. h Quantification of mid-late pachytene spermatocytes with nascent RNA FISH signals for Utx (left panel) and Lamp2 genes (right panel) shown as the mean ± s.e.m. for 3 independent experiments. Total numbers of analyzed nuclei are indicated in the panels (d, f, h). One-way ANOVA (b), two-tailed unpaired t-test (d, f, h). XY: XY chromosomes. Scale bars: 10 μm. Source data are provided as a Source Data file.
Fig. 2
Fig. 2. Gene suppression under MSCI is directed by ATR-dependent DDR signaling.
a Schematic of the experimental design for RNA-seq analyses. b Violin plot with a Box plot overlay of the gene expression log2 fold change between AZ20-treated and ctrl spermatocytes. The central lines represent medians. The upper and lower hinges correspond to the 25th and 75th percentiles. The upper and lower whisker are extended from the hinge to the largest value no further than the 1.5x inter-quartile range (IQR) from the hinge. Log2 fold changes exceeding 1.5x IQR are shown by black dots. Red dots in the Box plot are the average of the log2 fold change. The two-sided p-values were calculated using a Wilcoxon rank sum test. The total gene numbers analyzed are shown in the panel. c Scatter plots showing differentially expressed genes between AZ20-treated and ctrl spermatocytes. Differentially expressed genes, indicated as “Up” and “Down”, were defined as those with a ≥ 2-fold change and Padj < 0.05 using DESeq2. The log2 mean (x-axis) was calculated using the value of the baseMean from the DESeq2 analysis. The Utx and Lamp2 genes shown in Fig. 1g, h were detected as derepressed genes by AZ20 treatment. Total numbers of genes analyzed are shown in each panel. Source data are provided as a Source Data file.
Fig. 3
Fig. 3. The localization of critical DDR factors on the XY chromosomes, including TOPBP1, ATR and MDC1, is disrupted by inhibition of ATR.
a Schematic of the machinery for γH2AX domain formation in pachytene spermatocytes. The unsynapsed XY axis is recognized by BRCA1, TOBP1, and ATR. Further, γH2AX signals are established by ATR along the XY axis. γH2AX formation on the entire XY chromatin is mediated by a MDC1-dependent feedforward mechanism. be Chromosome spreads of mid-late pachytene spermatocytes immunostained with antibodies raised against SYCP3, BRCA1 (b), TOPBP1 (c), ATR (d), and MDC1 (e). XY chromosomes are indicated with dashed circles. Localization patterns of DDR factors on the sex chromosomes with or without exposure to ATRi are depicted in the panels to the right. See Supplementary Fig. 5 for 5 μM data. f Quantification of mid-late pachytene spermatocytes with the indicated DDR factors on the XY chromosomes shown as the mean ± s.e.m. for 3 independent experiments. Total numbers of analyzed nuclei are indicated in the panels. Two-tailed unpaired t-test. Scale bars: 10 μm. Source data are provided as a Source Data file.
Fig. 4
Fig. 4. DDR-dependent MSCI is reversible.
a Schematic of the experimental design. Spermatocytes were incubated for 3 h without ATRi, which was removed after a 24 h incubation with the ATRi AZ20. b, c Chromosome spreads of mid-late pachytene spermatocytes immunostained with antibodies raised against SYCP3, γH2AX, and H1T; after treatment with 5 or 10 mM AZ20 for 24 h (b), and after an additional 3 h without ATRi (c). XY chromosomes are indicated with dashed circles. Representative images of 3 independent experiments are shown. d Quantification of mid-late pachytene spermatocytes with normal γH2AX domains on the XY after recovery from ATRi, as determined in comparison to untreated spermatocytes, shown as the mean ± s.e.m. for 3 independent experiments. e Chromosome spreads of mid-late pachytene spermatocytes immunostained with antibodies raised against SYCP3, Pol II, and γH2AX, demonstrating that Pol II is excluded from XY chromosomes after release from treatment with the ATRi AZ20. XY chromosomes are indicated with dashed squares and are magnified in the panels to the right. f Quantification of mid-late pachytene spermatocytes with normal MSCI defined by Pol II exclusion shown as the mean ± s.e.m. for 3 independent experiments. Total numbers of analyzed nuclei are indicated in the panels (c, e). One-way ANOVA (c, e). Scale bars: 10 μm. Source data are provided as a Source Data file.
Fig. 5
Fig. 5. ATR-dependent reestablishment of MSCI from unsynapsed axes.
a Schematic of the experimental design. Following 24 h incubation with the ATRi AZ20, spermatocytes were additionally incubated for 30 min without ATRi. b, c Chromosome spreads of mid-late pachytene spermatocytes harvested 30 min after release from a 24 h incubation with ATRi and immunostained with antibodies raised against SYCP3, γH2AX, and H1T (b) and SYCP3, Pol II, and γH2AX (c). Representative images of 3 independent experiments are shown. XY chromosomes are indicated with dashed squares and are magnified at the bottom (b) and the middle right and right (c). c Intensities of γH2AX and Pol II on yellow lines, marked with “I–II”, were measured and are shown in the right-hand panels; the upper panel shows control and the bottom panel shows a spermatocyte harvested 30 min after release from a 24 h incubation with ATRi. Red: γH2AX, Black: RNA Pol II. Source data are provided as a Source Data file.
Fig. 6
Fig. 6. Both dynamic and irreversible epigenetic states are established on the XY chromatin in a manner dependent on ATR-mediated signaling during pachytene.
a Schematic of the molecular pathways that establish various epigenetic states on the sex chromosomes. Post-translational modifications are underlined. bd Chromosome spreads of mid-late pachytene spermatocytes immunostained with antibodies raised against SYCP3, SUMO1, ubiquitin, and H3K27ac. XY chromosomes are indicated with dashed circles. See Supplementary Fig. 7 for 5 μM data. Scale bars: 10 μm. e Quantification of mid-late pachytene spermatocytes with indicated histone modifications on the XY shown as the mean ± s.e.m. for 3 independent experiments. Two-tailed unpaired t-test. Total numbers of analyzed nuclei are indicated in the panels. f Schematic of the conclusions of this study. DDR-dependent dynamic events are shown in the green box, and DDR-directed irreversible events are shown in the blue box. Source data are provided as a Source Data file.
Fig. 7
Fig. 7. SETDB1-dependent H3K9me3 is dispensable for the initiation of MSCI.
a Schematic of the strategy for generating Setdb1-cKO mice. b Evaluation of the efficiency of SETDB1 deletion shown as the mean and individual values for 3 independent samples. c Chromosome spreads of early and mid pachytene spermatocytes, distinguished by the absence (early) or the presence (mid) of H1T, respectively (not shown), immunostained with antibodies raised against SYCP3 and H3K9me3. XY chromosomes are indicated with dashed squares and are magnified in the panels to the right. Putative regions of XY chromatin are indicated by dashed circles. d Chromosome spreads of mid pachytene spermatocytes immunostained with antibodies raised against SYCP3, γH2AX, and Pol II. e A population of pachytene spermatocytes with a normal γH2AX domain and normal MSCI, as defined by γH2AX and Pol II, respectively. The mean and individual values for 3 independent samples are shown. EP early pachytene, MP mid pachytene, X-PCH X-pericentromeric heterochromatin. Scale bars: 10 μm. Source data are provided as a Source Data file.
Fig. 8
Fig. 8. Active DDR signaling is required for the maintenance of MSCI in spermatogenesis in vivo.
a Schematic of the experimental design. See Materials and Methods for more details. HEB hypotonic extraction buffer. b Testis sections immunostained with antibodies raised against γH2AX and H1T. Representative images of 3 independent experiments are shown. Dashed squares are magnified in the panels to the right. White arrowheads indicate H1T-positive spermatocytes. c Chromosome spreads of mid-late pachytene spermatocytes immunostained with antibodies raised against SYCP3, γH2AX, and H1T. d Quantification of mid-late pachytene spermatocytes with a clear γH2AX domain on the XY in chromosome spreads shown as the mean ± s.e.m. for 3 independent experiments. Mid-late spermatocytes with a clear γH2AX domain on the XY were not found in AZ20 gavage plus ATR inhibitor, while all control spermatocytes (DMSO plus ATR inhibitor) presented a clear γH2AX domain on the XY. e Chromosome spreads of mid-late pachytene spermatocytes immunostained with antibodies raised against SYCP3, γH2AX, and Pol II. XY chromosomes are indicated with dashed squares and are magnified in the panels to the right. f Quantification of mid-late pachytene spermatocytes with normal MSCI defined by Pol II exclusion shown as the mean ± s.e.m. for 3 independent experiments. Two-tailed unpaired t-test. Total numbers of analyzed nuclei are indicated in the panels (d, f). Scale bars: 10 μm unless otherwise noted in the panels. Source data are provided as a Source Data file. The copyright of the mouse illustration is attributed to Takashi Mifune (https://www.irasutoya.com/). All rights reserved.

References

    1. Payer B, Lee JT, Namekawa SH. X-inactivation and X-reactivation: epigenetic hallmarks of mammalian reproduction and pluripotent stem cells. Hum. Genet. 2011;130:265–280. doi: 10.1007/s00439-011-1024-7. - DOI - PMC - PubMed
    1. Jégu T, Aeby E, Lee JT. The X chromosome in space. Nat. Rev. Genet. 2017;18:377–389. doi: 10.1038/nrg.2017.17. - DOI - PubMed
    1. Dossin, F. & Heard, E. The molecular and nuclear dynamics of X-chromosome inactivation. Cold Spring Harb. Perspect. Biol. 14, a040196 (2021). - PMC - PubMed
    1. Strehle M, Guttman M. Xist drives spatial compartmentalization of DNA and protein to orchestrate initiation and maintenance of X inactivation. Curr. Opin. Cell Biol. 2020;64:139–147. doi: 10.1016/j.ceb.2020.04.009. - DOI - PubMed
    1. Turner JM. Meiotic sex chromosome inactivation. Development. 2007;134:1823–1831. doi: 10.1242/dev.000018. - DOI - PubMed

Publication types