. 2022 Nov 28;13(1):7333.
doi: 10.1038/s41467-022-34538-5.

Experimental evidence for temporal uncoupling of brain Aβ deposition and neurodegenerative sequelae

Affiliations

Experimental evidence for temporal uncoupling of brain Aβ deposition and neurodegenerative sequelae

Christine Rother et al. Nat Commun. .

Abstract

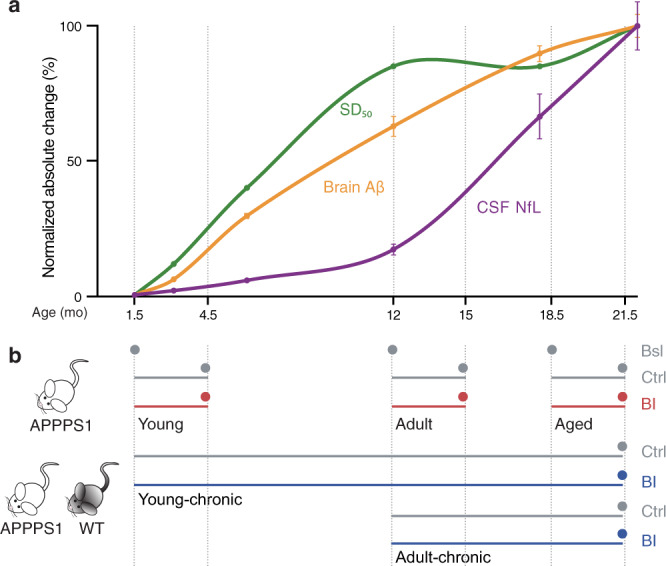
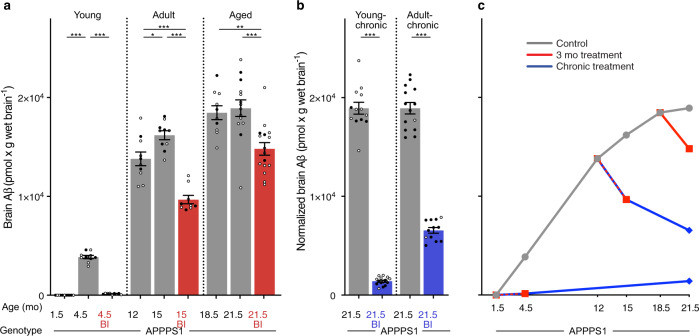
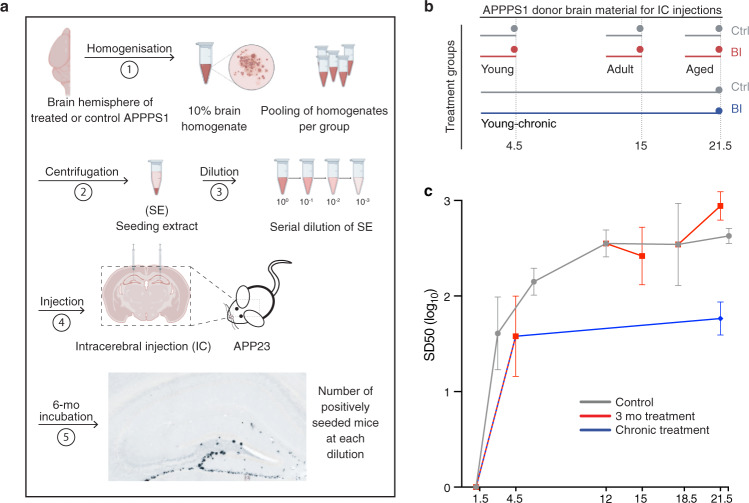
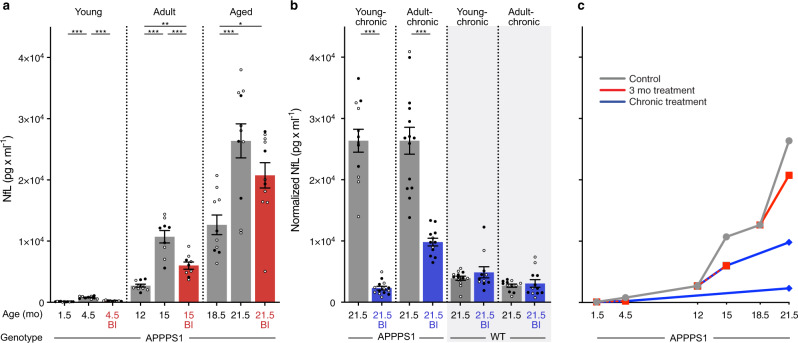
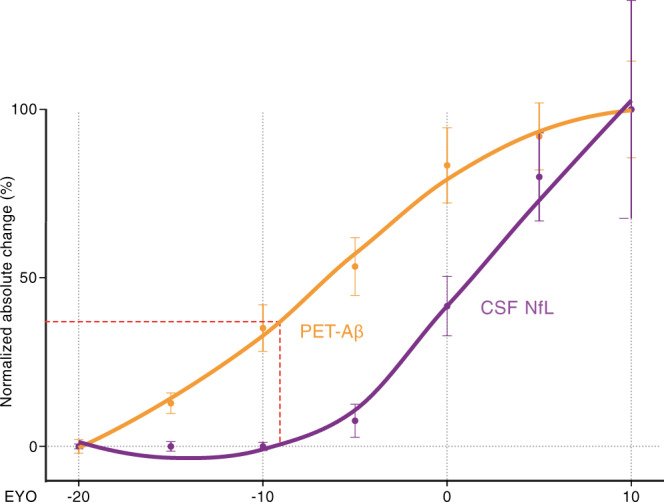
Brain Aβ deposition is a key early event in the pathogenesis of Alzheimer´s disease (AD), but the long presymptomatic phase and poor correlation between Aβ deposition and clinical symptoms remain puzzling. To elucidate the dependency of downstream pathologies on Aβ, we analyzed the trajectories of cerebral Aβ accumulation, Aβ seeding activity, and neurofilament light chain (NfL) in the CSF (a biomarker of neurodegeneration) in Aβ-precursor protein transgenic mice. We find that Aβ deposition increases linearly until it reaches an apparent plateau at a late age, while Aβ seeding activity increases more rapidly and reaches a plateau earlier, coinciding with the onset of a robust increase of CSF NfL. Short-term inhibition of Aβ generation in amyloid-laden mice reduced Aβ deposition and associated glial changes, but failed to reduce Aβ seeding activity, and CSF NfL continued to increase although at a slower pace. When short-term or long-term inhibition of Aβ generation was started at pre-amyloid stages, CSF NfL did not increase despite some Aβ deposition, microglial activation, and robust brain Aβ seeding activity. A dissociation of Aβ load and CSF NfL trajectories was also found in familial AD, consistent with the view that Aβ aggregation is not kinetically coupled to neurotoxicity. Rather, neurodegeneration starts when Aβ seeding activity is saturated and before Aβ deposition reaches critical (half-maximal) levels, a phenomenon reminiscent of the two pathogenic phases in prion disease.


Conflict of interest statement

I.B., D.S., U.N. were employees of Novartis at the time the study was conducted. M.J. has received consulting fees from Papiling GmbH. All the other authors declare no competing interests.

Figures

Fig. 1
Fig. 1. Age-dependent biomarker changes in APPPS1 mice and experimental group design.
a Normalized absolute changes (%) in brain Aβ levels, brain Aβ seeding activity (SD50), and CSF NfL as a function of age in APPPS1 mice. Data were largely taken from previous publications (for brain Aβ measured by immunoassays; for in vivo Aβ seeding activity (Reed-Muench method); for CSF NfL and from in-house mouse bio-/databank (see Supplementary Table 1; note that, from each of the NfL values of APPPS1 mice, the mean of the NfL values of age-matched wild-type mice was subtracted since wild-type mice also show an age-related increase). Means and ± s.e.m. are shown and curves were generated in Numbers (Apple Inc., Cupertino, CA) using the “curved connection line” option. Results reveal a steady increase in brain Aβ until it slows down at a late age, whereas Aβ seeding activity increases more rapidly and reaches a plateau as early as ~12-mo of age (see also Fig. 3c where log SD50 data are plotted using the curve-fitting method). CSF NfL increases slowly until ~10–11-mo of age, after which a more rapid increase takes place. b Experimental treatment groups cover distinct time-points of decisive biomarker changes. Mice were treated either with BACE1 inhibitor- (BI) containing food pellets (red) or control (Ctrl) food pellets (gray). Three-month treatment periods (short-term) started when animals were 1.5 (young), 12 (adult), or 18.5 (aged) mo of age, and mice were analyzed at the end of each 3-month treatment period (dots). To assess baseline levels (Bsl), untreated mice were also collected at 1.5, 12, and 18.5 mo of age (dots). Chronic BI treatments (blue) started at 1.5 or 12 months of age and lasted until 21.5 months (young-chronic and adult-chronic, respectively) when the animals were sacrificed. Chronic BI treatments were also administered to control wildtype (WT) mice. Number of mice per group was n = 9–16; for exact numbers see Supplementary Fig. 1a.
Fig. 2
Fig. 2. Brain Aβ after short-term and chronic BACE1 inhibition.
Brain Aβ (human Aβx–40 and Aβx–42 assessed by immunoassays) in APPPS1 mice. a Brain Aβ at baseline and after short-term BI treatment in ‘young’, ‘adult’, and ‘aged’ mice (see Fig. 1 and Supplementary Fig. 1a for treatment groups and number of mice per group). Short-term BI treatment caused a significant decrease in brain Aβ compared to the respective age-matched control groups, and was below baseline in the ‘adult’ and ‘aged’ groups (ANOVA, ‘young’: F(2, 27) = 547.1; ‘adult’: F(2, 26) = 35.31; ‘aged’: F(2, 37) = 10.33, all P < 0.001; post hoc Tukey’s multiple comparisons, *P < 0.05, **P < 0.01, ***P < 0.001). b Brain Aβ levels in the young-chronic and adult-chronic groups were normalized to the 21.5 mo-old control mice in the 3-month treatment group shown in a. Two-tailed unpaired t-tests revealed significantly lower brain Aβ levels in the BI-treated mice (‘young-chronic’: t(26)=30.69; ‘adult-chronic’: t(24) = 17.99, both ***P < 0.001). c Cross-sectional curves of the means of brain Aβ from a and b show the increase of brain Aβ in the control mice (gray line), consistent with previous studies shown in Fig. 1a. When initiated before Aβ deposition was present (i.e., at 1.5 mo of age), BI treatment markedly (>90%) inhibited the deposition of Aβ for both the short-term and chronic treatments. When initiated in amyloid-laden mice, the BI treatment led to an Aβ reduction below baseline. Since the chronic treatments are, in a sense, an extension of the 3-month treatments, the lines are drawn from the 3-month treatments to the end of the chronic treatments. All data are represented as group means ± s.e.m. Open circles are males, filled circles females; no effect of sex was found (see Methods). Similar data were obtained when Aβ deposition was assessed by immunostaining, see Supplementary Fig. 2.
Fig. 3
Fig. 3. Brain Aβ seeding activity after short-term and chronic BACE1 inhibition.
a Brain extracts from all mice within a group were pooled, serially diluted, and intracerebrally (IC) injected into the hippocampus of young, pre-depositing 2- to 3-mo old female APP23 host mice (n = 4–6 per extract; for exact numbers see Supplementary Fig. 1b). APP23 host mice were analyzed for Aβ deposition using immunohistochemistry (CN6 and Congo Red) 6 months later. Illustrations were partly created with BioRender.com. b Treatment groups for which SD50 was determined (short-term for young, adult, aged; young-chronic). c SD50 (defined as the log 10 of the brain extract dilution at which 50% of the host mice showed induced Aβ deposition) was computed for each treatment group and complemented with the trajectories of SD50 from a former study (see Supplementary Fig. 1b, c and Methods). BI treatments in amyloid-laden adult and aged mice did not consistently affect the seeding activity. When BI treatment was initiated before appreciable Aβ deposition was present (i.e., at 1.5 mo of age) SD50 almost reached control levels after the 3-month treatment. After chronic treatment, SD50 was about 1 log (10-fold dilution) below the control (i.e., below the saturated seeding activity). Since the chronic treatment is, in a sense, an extension of the 3-month treatment, the line is drawn from the 3-month treatments to the end of the chronic treatment, suggesting that the SD50 remains at this level when Aβ generation is continuously blocked.
Fig. 4
Fig. 4. NfL in CSF after short-term and chronic BACE1 inhibition.
a CSF NfL was measured at baseline and after short-term BI treatment in ‘young’, ‘adult’, and ‘aged’ mice (see Fig. 1 and Supplementary Fig. 1a for treatment groups and number of mice per group; note insufficient CSF amount and/or measurement errors for APPPS1 ‘adult control’, n = 1; ‘aged control’, n = 3; ‘aged BI’, n = 5; ‘young-chronic‘ control, n = 1; young-chronic’ BI, n = 1; and for WT ‘young-chronic’ control, n = 2). BI treatment in the young group prevented the NfL increase, while in the adult and aged groups, NfL still increased compared to baseline levels, albeit less than in the control groups (ANOVA, ‘young’ (F(2, 27) = 80.58; ‘adult’ F(2, 25)= 36.51; ‘aged’ F(2, 29)= 9.254, all P < 0.001; post hoc Tukey’s multiple comparisons, *P < 0.05, **P < 0.01, ***P < 0.001). b CSF NfL in the young-chronic and adult-chronic groups were normalized to the 21.5 mo-old control mice of the 3-month treatment group shown in a. Two-tailed unpaired t tests revealed significantly lower CSF NfL levels in the BI-treated APPPS1 mice (‘young chronic’: t(24) = 13.64; ‘adult-chronic’: t(24) = 6.754, both ***P < 0.001). The same chronic treatment was also undertaken in WT mice (see Fig. 1b for treatment details), but BI treatment had no effect on CSF NfL. c Cross-sectional curve of the group means from a and b shows the slow initial increase of CSF NfL followed by a steep increase of NfL in adult and aged APPPS1 mice (gray line) as predicted by previous studies and shown in Fig. 1a. Although BI treatments in amyloid-laden mice slowed the NfL increase (at least in the adult group), there was still a significant increase compared to the baseline groups. Only when BI treatment was initiated before any amyloid-deposition (i.e., in the young group) could the increase of NfL be blocked. Note the similar NfL levels in chronically treated APPPS1 mice and WT mice at 21.5 months, indicating that the NfL increase in APPPS1 could in fact be completely blocked by the chronic BI treatment. Since the chronic treatments are, in a sense, an extension of the 3-month treatments, the lines are drawn from the 3-month treatments to the end of the chronic treatment. All data are represented as group means ± s.e.m. Open circles are males, filled circles females; no effect of sex was found (see Methods).
Fig. 5
Fig. 5. Trajectories of brain Aβ deposition and CSF NfL in familial Alzheimer´s disease.
Normalized absolute changes (%) in brain Aβ-PET (using Pittsburgh Compound B; orange) and CSF NfL (purple) as a function of the estimated years to clinical symptom onset (EYO). To generate the curves, cross-sectional data from previous Dominantly Inherited Alzheimer’s Network (DIAN) publications were used (for Aβ-PET; for CSF NfL). For better comparison of biomarker trajectories between familial AD and the APPPS1 mouse model (see Fig. 1), Aβ-PET and CSF NfL (between EYO −20 and 10) were binned in increments of 5 years (n = 29, 29, 26, 31, 45, and 19 for −20 to −15, −15 to −10, −10 to −5, −5 to 0, 0 to 5, 5 to 10, respectively, for Aβ-PET; n = 8, 15, 13, 18, 17, and 8 for −20 to −15, −15 to −10, −10 to −5, −5 to 0, 0 to 5, 5 to 10, respectively, for CSF NfL). The relative percent change across EYO for each biomarker was calculated, and locally weighted estimated scatter plot smoothing (LOESS) was used for illustrations. Mean ± s.e.m for normalized absolute change of biomarker within each EYO bin are displayed. As in the mouse studies, the increase of CSF NfL in mutation carriers is plotted as the increase over that of non-mutation carriers, i.e., the mean NfL values of non-carrier patients were subtracted from those of the mutation carriers within each EYO bin. Of note, CSF NfL started to increase around EYO −10 when Aβ-PET reached less than half-maximal changes (red dotted line). These curves are based on cross-sectional data; if longitudinal data are used, both curves shift to lower EYO to similar degrees,.

References

    1. Jucker M, Walker LC. Propagation and spread of pathogenic protein assemblies in neurodegenerative diseases. Nat. Neurosci. 2018;21:1341–1349. doi: 10.1038/s41593-018-0238-6. - DOI - PMC - PubMed
    1. McDade E, et al. The case for low-level BACE1 inhibition for the prevention of Alzheimer disease. Nat. Rev. Neurol. 2021;17:703–714. doi: 10.1038/s41582-021-00545-1. - DOI - PubMed
    1. McDade E, et al. Longitudinal cognitive and biomarker changes in dominantly inherited Alzheimer disease. Neurology. 2018;91:1295–1306. doi: 10.1212/WNL.0000000000006277. - DOI - PMC - PubMed
    1. Villemagne VL, Doré V, Burnham SC, Masters CL, Rowe CC. Imaging tau and amyloid-beta proteinopathies in Alzheimer disease and other conditions. Nat. Rev. Neurol. 2018;14:225–236. doi: 10.1038/nrneurol.2018.9. - DOI - PubMed
    1. Hardy J, Selkoe D. The amyloid hypothesis of Alzheimer’s disease: progress and problems on the road to therapeutics. Science. 2002;297:353–356. doi: 10.1126/science.1072994. - DOI - PubMed

Publication types

Substances