. 2022 Nov 28;13(1):7324.
doi: 10.1038/s41467-022-34162-3.

Low-dose IL-2 reduces IL-21+ T cell frequency and induces anti-inflammatory gene expression in type 1 diabetes

Affiliations

Low-dose IL-2 reduces IL-21+ T cell frequency and induces anti-inflammatory gene expression in type 1 diabetes

Jia-Yuan Zhang et al. Nat Commun. .

Abstract

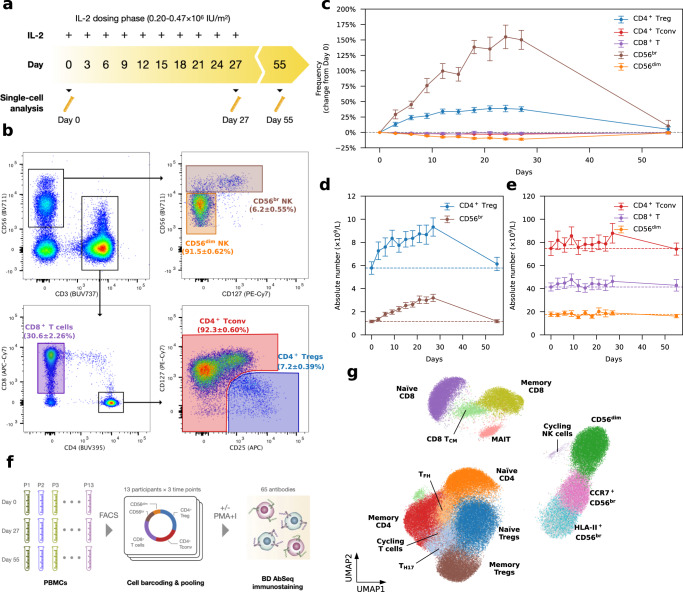
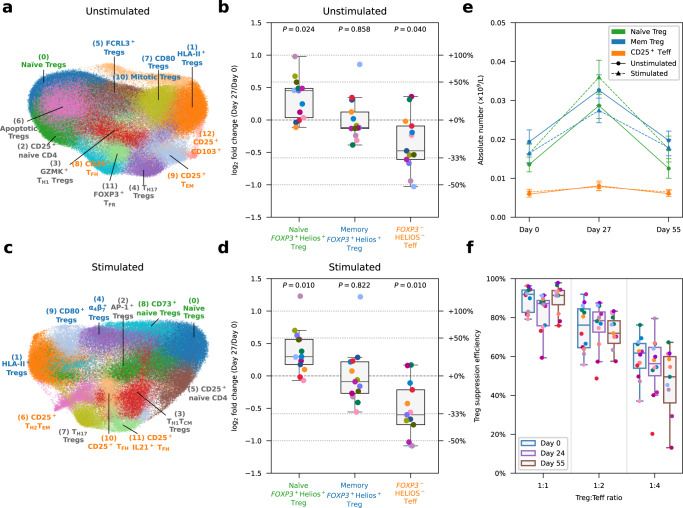
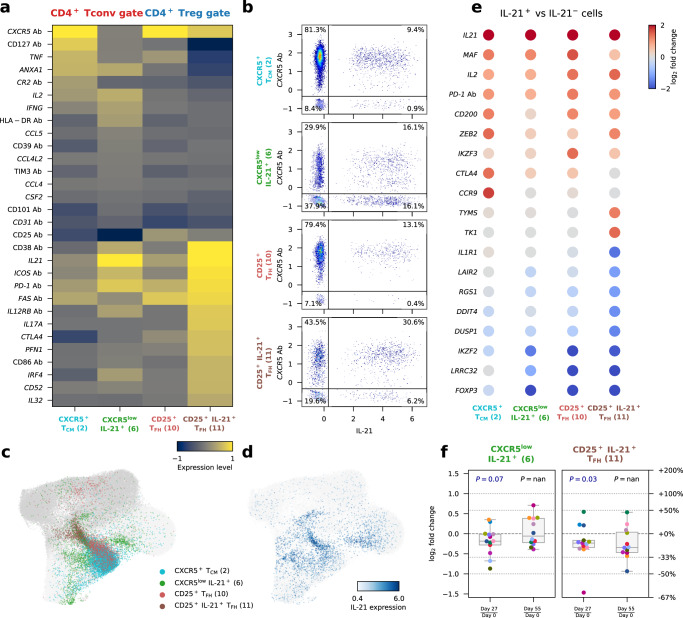
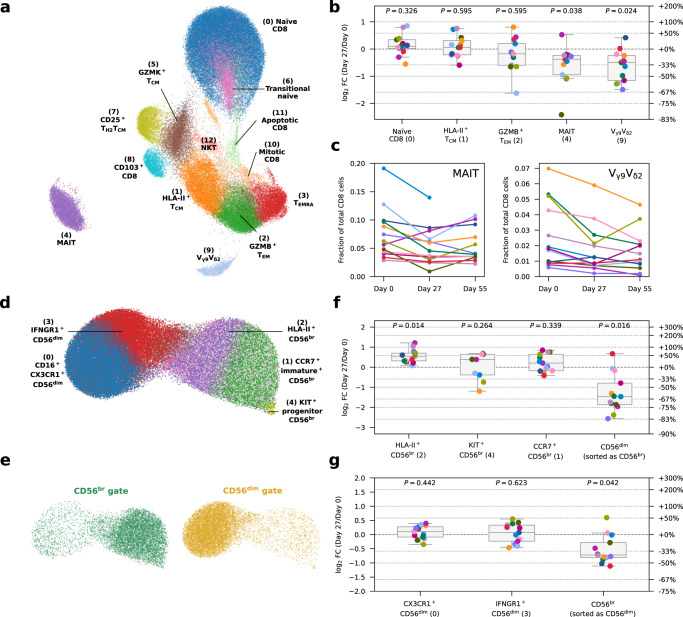
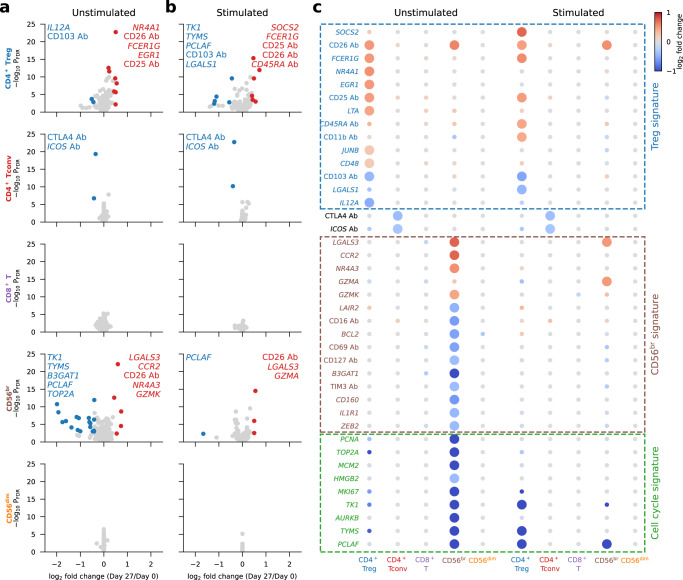
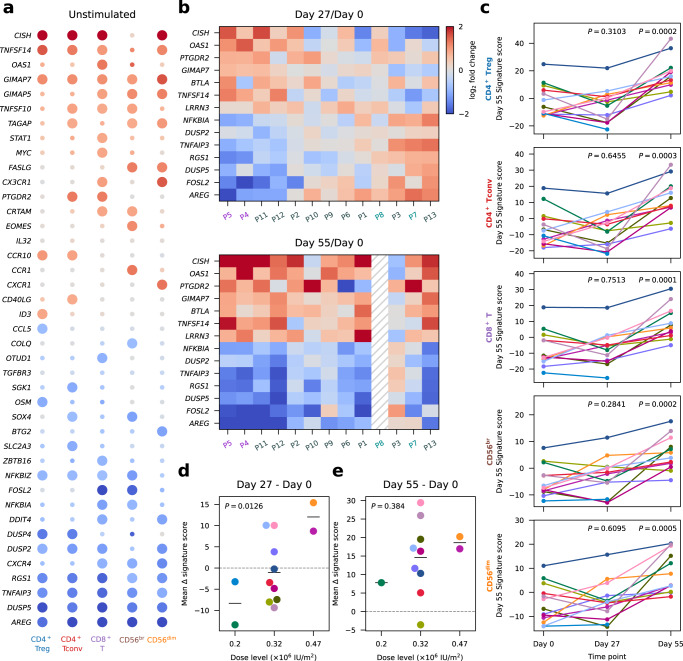
Despite early clinical successes, the mechanisms of action of low-dose interleukin-2 (LD-IL-2) immunotherapy remain only partly understood. Here we examine the effects of interval administration of low-dose recombinant IL-2 (iLD-IL-2) in type 1 diabetes using high-resolution single-cell multiomics and flow cytometry on longitudinally-collected peripheral blood samples. Our results confirm that iLD-IL-2 selectively expands thymic-derived FOXP3+HELIOS+ regulatory T cells and CD56bright NK cells, and show that the treatment reduces the frequency of IL-21-producing CD4+ T cells and of two innate-like mucosal-associated invariant T and Vγ9Vδ2 CD8+ T cell subsets. The cellular changes induced by iLD-IL-2 associate with an anti-inflammatory gene expression signature, which remains detectable in all T and NK cell subsets analysed one month after treatment. These findings warrant investigations into the potential longer-term clinical benefits of iLD-IL-2 in immunotherapy.


Conflict of interest statement

F.W-L. is employed by Vertex Pharmaceuticals; J.A.T. is a member of the GSK Human Genetics Advisory Board. The remaining authors declare no competing interests.

Figures

Fig. 1
Fig. 1. Interval low-dose IL-2 administered every three days sustained an increased frequency of CD4+ regulatory T cells and CD56br NK cells in blood.
a Schematic representation of the IL-2 dosing regimen used in this study. b Gating strategy for the delineation of the five T and NK cell populations assessed by flow cytometry in the 18 DILfrequency study participants treated with the 3-day interval dosing interval. The frequency of each cell population at baseline (Day 0) is presented as the mean value ± SEM. c Variation (depicted as the % change from baseline levels) in the frequency of the five assessed immune subsets in blood (denominator is total CD3+ T cells for T cell subsets, CD4+ T cells for the CD4+ Treg subset and total CD56+ NK cells for NK subsets). Data are presented as mean values ± SEM (n = 18 participants). Absolute numbers of the assessed CD4+ CD127lowCD25hi (Tregs) and CD56br NK cell (d), as well as the broader CD4+and CD8+ T and CD56+ NK cell (e) subsets in blood. Data are presented as mean values ± SEM in n = 18 participants treated with either 0.2 (n = 4), 0.32 (n = 12) or 0.47 (n = 2) ×106 IU/m2 IL-2. Dotted lines indicate the average baseline numbers of each subset. Individual-level data, as shown in (c–e), are included in ref. . f Experimental design employed in this study. Equal proportions of flow-sorted cells subsets (30% CD4+ Tregs; 25% CD4+ Tconv and CD8+ T; 12% CD56br NK and 8% CD56dim NK cells) from n = 13 selected DILfrequency participants treated with the 3-day dosing interval were profiled by single-cell multiomics. g Uniform Manifold Approximation and Projection (UMAP) plot depicting the 15 clusters identified from the clustering of n = 482,531 unstimulated cells. Clusters were manually annotated based on the expression of key mRNA and protein markers. Light grey cells correspond to CD56br NK cells without sorting gate information. Source data for (c, d, e) are provided as a Source Data file.
Fig. 2
Fig. 2. Interval low-dose IL-2 immunotherapy selectively expands FOXP3+HELIOS+ Tregs.
a UMAP plot depicting n = 149,202 unstimulated cells sorted from the CD127lowCD25hi Treg gate. Clusters were manually annotated based on the expression of key mRNA and protein markers. Clusters corresponding to: (i) naïve Tregs (defined as CD45RA+ FOXP3+HELIOS+); (ii) memory Tregs (defined as CD45RA FOXP3+HELIOS+); or (iii) CD25+ FOXP3HELIOS Teffs (defined as CD45RA FOXP3HELIOS) are annotated in green, blue and orange, respectively. All other clusters not conforming to this definition are annotated in black. b Relative frequency changes of naïve FOXP3+HELIOS+ Treg, memory FOXP3+HELIOS+ Treg, and CD25+ FOXP3HELIOS Teff clusters on Day 27 compared to baseline (Day 0) levels, for unstimulated cells. c, d Corresponding UMAP plot (c) and relative frequency of the identified subsets (d) for n = 115,153 stimulated CD4+ T cells sorted from the CD127lowCD25hi Treg gate. e Absolute cell numbers of naïve FOXP3+HELIOS+ Tregs, memory FOXP3+HELIOS+ Tregs, and CD25+ FOXP3HELIOS Teffs on Day 0, Day 27 and Day 35, for unstimulated and stimulated cells. Absolute cell numbers of the Treg subsets were calculated by multiplying the absolute number of Tregs measured by FACS by the relative frequency of the respective subset measured by single-cell multiomics. Data are presented as mean values ± SEM. f Per-cell Treg suppression efficiency for each time point, assessed in vitro by culturing CD4+CD25hiCD127low Tregs with autologous CD4+CD25−/lowCD127+ Teffs at various ratios (x axis). n = 12 participants. In (b) and (d), P values were calculated using two-sided Wilcoxon signed-rank tests comparing the relative frequency of the subsets between Day 27 and Day 0. In (b, d and f), each dot represents cells from a single participant. Dots with the same colour represent the same participant. Each box ranges from the first quartile (Q1) to the third quartile (Q3), with a central line indicating the median. The bottom and top whiskers extend to the most extreme data points within Q1 − 1.5 × (Q3 − Q1) and Q3 + 1.5 × (Q3 − Q1), respectively. In (b, d, and e), n = 13 participants. Source data for (b, d, e, f) are provided as a Source Data file.
Fig. 3
Fig. 3. Low-dose IL-2 treatment inhibits the differentiation of IL-21-producing CD4+ T cells.
a Expression levels of 30 differentially expressed markers in the four assessed IL-21-producing CD4+ T cell subsets from in vitro stimulated CD4+ T cells: CXCR5+ TCM and CXCR5lowIL-21+ sorted from the CD25–/low Tconv gate; and CD25+ TFH and CD25+IL-21+ TFH sorted from the CD127lowCD25hi Treg gate. b Expression of CXCR5 (AbSeq) and IL21 in the four assessed IL-21+ CD4+ T cell subsets. c, d UMAP plots depicting the clustering of in vitro stimulated CD4+ T cells (n = 209,543 cells). Cells are coloured according to the respective IL-21+ cluster assignment (c); or by normalised and scaled IL-21 expression levels (d). Dark and light grey denote cells sorted from the CD127lowCD25hi Treg gate and CD25–/low Tconv gate, respectively, that are not in IL-21+ clusters. e Gene expression changes between IL-21+ and IL-21 cells within each of the four assessed IL-21+ CD4+ T cell clusters. Genes with absolute log2 fold change >= 1.2 and FDR-adjusted P values <0.01 in at least one cluster were selected. Fold change and P values were calculated using a generalized linear model implemented in DESeq2 (see “Methods”). f Relative frequency changes of IL-21+ cells within the two CD4+ T cell subsets displaying higher expression levels of IL-21: the CXCR5lowIL-21+ subset (left panel) and the CD25+IL-21+ TFH subset (right panel), comparing Day 27 and Day 55 with Day 0, respectively. Each dot represents cells from a single participant. Dots with the same colour represent the same participant. n = 13 participants. Each box ranges from the first quartile (Q1) to the third quartile (Q3), with a central line indicating the median. The bottom and top whiskers extend to the most extreme data points within Q1−1.5 × (Q3 − Q1) and Q3 + 1.5 × (Q3 − Q1), respectively. P values were calculated by comparing the relative frequency values between the two time points using a two-sided Wilcoxon signed-rank test. Source data for (a, e, f) are provided as a Source Data file.
Fig. 4
Fig. 4. IL-2 treatment reduces the frequency of innate-like CD8+ MAIT and Vγ9Vδ2 T cells in circulation and selectively expands the IL-2 sensitive CD56br NK cell subset.
a UMAP plot depicting the clustering of n = 93,379 unstimulated CD8+ T cells. Clusters were manually annotated based on the expression of key mRNA and protein markers. b Relative frequency changes of five selected CD8+ T cell clusters on Day 27 compared to the baseline (Day 0) levels, for unstimulated cells. c Relative frequency of the innate-like mucosal-associated invariant T cell (MAIT; left panel) and Vγ9Vδ2 T cell (right panel) clusters on Day 0, Day 27, and Day 55. Each line represents cells from a participant. Lines with the same colour represent the same participant. n = 13 participants. d UMAP plot depicting the clustering of n = 118,625 unstimulated NK cells. Clusters were manually annotated based on the expression of key mRNA and protein markers. e UMAP plot as in (d), split and coloured by FACS sorting gates of origin. f, g Relative frequency changes of five selected CD56br (f) or CD56dim (g) NK cell clusters on Day 27 compared to the baseline pre-treatment (Day 0) levels, for unstimulated cells. The relative frequency of each cluster is calculated as the number of cells in that cluster divided by the total number of cells sorted from the CD8 (b), CD56br (f) or CD56dim (g) NK cell gate. Each dot represents cells from a single participant. Dots with the same colour represent the same participant. n = 13 participants. Each box ranges from the first quartile (Q1) to the third quartile (Q3), with a central line indicating the median. The bottom and top whiskers extend to the most extreme data points within Q1 − 1.5 × (Q3 − Q1) and Q3 + 1.5 × (Q3 − Q1), respectively. P values were calculated using two-sided Wilcoxon signed-rank tests based on cell population frequencies between Day 27 and Day 0, followed by Benjamini–Hochberg FDR adjustment. Source data for (b, c, f, g) are provided as a Source Data file.
Fig. 5
Fig. 5. IL-2 treatment selectively modulates gene expression of CD25hi Tregs and CD56br NK cells at Day 27.
a, b Volcano plots depicting gene expression changes between Day 0 and Day 27 for the five assessed immune populations, for unstimulated (a) and stimulated (b) cells. Significantly differentially expressed genes are coloured in red (upregulated genes) or blue (downregulated genes). Names of the top five up- and downregulated genes as defined by fold change are labelled on each panel. c Differential expression of Day 27 signature genes. Day 27 signature genes are defined as the 40 genes that are significantly differentially expressed in at least one cell population comparing Day 27 with Day 0. Dot colours represent log2 fold change between Day 0 and Day 27. Larger dots represent genes that are significantly differentially expressed in the respective cell population. Manually annotated signature gene subsets are labelled with dashed boxes. In (ac), fold change and P values were calculated using a generalized linear model implemented in DESeq2 (see Methods). Source data for (a, b, c) are provided as a Source Data file.
Fig. 6
Fig. 6. Interval low-dose IL-2 immunotherapy induces a long-lasting anti-inflammatory gene expression signature.
a Differential expression of Day 55 signature genes. Day 55 signature genes were defined as the 41 genes significantly differentially expressed in at least one cell population comparing Day 55 with Day 0. Dot colours represent log2 fold-change between Day 0 and Day 55. Larger dots represent significantly differentially expressed genes. Fold change and P values were calculated using a generalized linear model implemented in DESeq2 (see “Methods”). b Participant-specific differential expression in CD8+ T cells comparing Day 27 (top panel) or Day 55 (bottom panel) with Day 0. Top 5 up- and downregulated genes as defined by Day 55/Day 0 fold-change in CD8+ T cells. Participant labels are coloured by their respective IL-2 dose (×106 IU/m2): 0.2 (cyan), 0.32 (grey), 0.47 (purple). c Day 55 signature scores by participant for each time point and cell type. Each participant is represented by a different colour. P values were calculated using a two-tailed paired t test comparing Day 27 or Day 55 with Day 0, respectively. d, e Variation in the mean expression scores of Day 55 signature genes across the five major cell types (mean Δ signature score) between Day 27 and Day 0 (d) and between Day 55 and Day 0 (e) for each participant. Participants were stratified by IL-2 dose. P values were calculated using linear regression, without multiple-comparison adjustments. In (d and e), average values of the Day 55 signature in all five cell types are shown for each participant. n = 13 participants. Source data for (a–e) are provided as a Source Data file.

References

    1. Koreth J, et al. Interleukin-2 and regulatory T cells in graft-versus-host disease. N. Engl. J. Med. 2011;365:2055–2066. doi: 10.1056/NEJMoa1108188. - DOI - PMC - PubMed
    1. Saadoun D, et al. Regulatory T-cell responses to low-dose interleukin-2 in HCV-induced vasculitis. N. Engl. J. Med. 2011;365:2067–2077. doi: 10.1056/NEJMoa1105143. - DOI - PubMed
    1. Castela E, et al. Effects of low-dose recombinant interleukin 2 to promote T-regulatory cells in alopecia areata. JAMA Dermatol. 2014;150:748–751. doi: 10.1001/jamadermatol.2014.504. - DOI - PubMed
    1. von Spee-Mayer C, et al. Low-dose interleukin-2 selectively corrects regulatory T cell defects in patients with systemic lupus erythematosus. Ann. Rheum. Dis. 2016;75:1407–1415. doi: 10.1136/annrheumdis-2015-207776. - DOI - PubMed
    1. Zhao TX, et al. Low-dose interleukin-2 in patients with stable ischaemic heart disease and acute coronary syndromes (LILACS): protocol and study rationale for a randomised, double-blind, placebo-controlled, phase I/II clinical trial. BMJ Open. 2018;8:e022452. doi: 10.1136/bmjopen-2018-022452. - DOI - PMC - PubMed