. 2022 Nov 28;13(1):7319.
doi: 10.1038/s41467-022-34804-6.

The fate of early perichondrial cells in developing bones

Affiliations

The fate of early perichondrial cells in developing bones

Yuki Matsushita et al. Nat Commun. .

Abstract

In endochondral bone development, bone-forming osteoblasts and bone marrow stromal cells have dual origins in the fetal cartilage and its surrounding perichondrium. However, how early perichondrial cells distinctively contribute to developing bones remain unidentified. Here we show using in vivo cell-lineage analyses that Dlx5+ fetal perichondrial cells marked by Dlx5-creER do not generate cartilage but sustainably contribute to cortical bone and marrow stromal compartments in a manner complementary to fetal chondrocyte derivatives under the regulation of Hedgehog signaling. Postnatally, Dlx5+ fetal perichondrial cell derivatives preferentially populate the diaphyseal marrow stroma with a dormant adipocyte-biased state and are refractory to parathyroid hormone-induced bone anabolism. Therefore, early perichondrial cells of the fetal cartilage are destined to become an adipogenic subset of stromal cells in postnatal diaphyseal bone marrow, supporting the theory that the adult bone marrow stromal compartments are developmentally prescribed within the two distinct cells-of-origins of the fetal bone anlage.


Conflict of interest statement

The authors declare no competing interests.

Figures
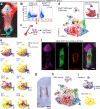
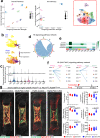
Fig. 1
Fig. 1. Single-cell RNA-seq identifies a perichondrial cluster as a putative cell origin in the fetal cartilage.
ae Single-cell RNA-seq analysis of Col2a1-cre-marked chondrocytes and perichondrial cells at E13.5. a: Col2a1-cre; R26RtdTomato femur immunostained for SOX9. R round layer, F flat layer, PH prehypertrophic layer, PC perichondrium, Grey DIC. Scale bar: 200 µm. n = 3 mice. b, c FACS (b) and scRNA-seq (c) strategy for Col2a1cre-tdTomato+ cells (red box). Shown are cells isolated from Col2a1-cre; R26RtdTomato limbs (left) or R26RtdTomato control limbs (right). d UMAP plot of major classes of Col2a1cre-tdTomato+ cells (Cluster 0 – 9, 7,889 cells). Pooled from n = 5 mice. Dotted box: Feature plot of tdTomato. e Feature plots of representative genes enriched in each cluster. Cluster 0,1,2: Sox9+ (green dotted contour), Cluster 1: Col2a1+, Acan+, Fgfr3+, Cluster 1,5: Sp7+, Cluster 4,5: Prrx1+, Dlx5+, Cluster 5: Runx2+. Violet: high expression, yellow: low expression. f Fgfr3-GFP; Osx-mCherry femur immunostained for SOX9. Scale bar: 200 µm. n = 4 mice. g RNAScope analyses of Dlx5. Scale bar: 200 µm. n = 4 mice. h RNA velocity analysis. Dynamical model-based RNA velocity vectors superimposed on the UMAP plot. The origins of black arrows represent the inferred initial states, namely Cluster 1 (blue arrowhead) and Cluster 5 (red arrowhead). i Initial state and root cell inference. Top: colored by GPCCA-based, CellRank-computed initial state probability. Violet indicates low probability while yellow indicates high probability. Bottom: Cluster 5 is the inferred root cell population.
Fig. 2
Fig. 2. Dlx5-creER marks early perichondrial cells of the fetal cartilage.
ad Localization of Dlx5-creER+, Osx-creER+, or Fgfr3-creER+ cells at E13.5 (pulsed at E12.5), visualized by cre-inducible R26RtdTomato reporter, with Col1a1(2.3kb)-GFP reporters to mark osteoblasts. a E13.5 cartilage template immunostained for SOX9. Left panels: Scale bar: 200 µm. Right panels: magnified view of the boxed areas (1–3). n = 4 mice per each group. b Col1a1(2.3kb)-GFP; Dlx5-creER; R26RtdTomato perichondria at E13.5, immunostained for MYH3 (skeletal muscles, left) or EMCN (endothelial cells, right). Grey: DAPI. Scale bar: 20 µm. n = 4 mice per each group. c Quantification of Dlx5-creER+, Osx-creER+, or Fgfr3-creER+tdTomato+ cells. Left: percentage of tdTomato+ cells among Col1a1-GFPneg perichondrial cells. Center: percentage of Col1a1-GFP+tdTomato+ cells among Col1a1-GFP+ osteogenic perichondrial cells. Right: percentage of SOX9+tdTomato+ cells among SOX9+ chondrocytes. n = 4 mice per each group. Two-tailed, one-way ANOVA followed by Tukey’s post-hoc test. Data are presented as mean ± s.d. Exact P value is indicated in the figures. d Dlx5-creER and Fgfr3-creER can mark mutually exclusive cell populations in the fetal perichondrium and cartilage template, respectively, whereas Osx-creER marks cells that overlap with those two cell types. Source data are provided as a Source Data file.
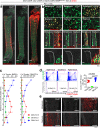
Fig. 3
Fig. 3. Dlx5-creER+ early perichondrial cells contribute to both cortical and marrow stromal compartment.
ac Cell-fate analysis of Dlx5-creER+, Osx-creER+, or Fgfr3-creER+ cells at E15.5 (pulsed at E12.5), visualized by cre-inducible R26R-tdTomato reporter, with Col1a1(2.3kb)-GFP reporters for osteoblasts. a E15.5 whole femurs. Scale bar: 200 µm. Right panels: magnified view of the boxed areas. n = 4 mice per each group. b E18.5 whole femurs. Right panels: magnified view of the boxed areas showing perichondrium, growth plate and bone collar. Arrowhead: groove of Ranvier and periosteum. Scale bar: 500 µm. n = 4 mice per each group. c Quantification of lineage-marked tdTomato+ cells. Upper left: percentage of tdTomato+ cells among total periosteal cells. Upper center: percentage of Col1a1-GFP+tdTomato+ cells among Col1a1-GFP+ cortical osteoblasts. Upper right: percentage of Col1a1-GFP+tdTomato+ cells among Col1a1-GFP+ trabecular osteoblasts. Lower left: number of tdTomato+ BMSCs. Lower right: percentage of SOX9+tdTomato+ cells among SOX9+ growth plate chondrocytes. n = 4 mice per each group. Two-tailed, one-way ANOVA followed by Tukey’s post-hoc test. Data are presented as mean ± s.d. Exact P value is indicated in the figures. d Diagram depicting lineage contribution of Dlx5-creER+, Osx-creER+, and Fgfr3-creER+ cells in fetal endochondral bone development, at E15.5 and E18.5. Source data are provided as a Source Data file.
Fig. 4
Fig. 4. Dlx5-creER+ early perichondrial cells regulate marrow formation in response to Hedgehog signaling.
af CellChat intercellular communication analysis of the E13.5 Col2a1-cre-marked chondrocyte and perichondrial cell scRNA-seq dataset. a Outgoing and incoming interaction strength of signaling pathways. Each circle represents the number of interactions a cluster participates in. (Left): Cluster 1 has a low tendency to send signals but a high tendency to receive signals in overall pathways. (Right): Cluster 1 exhibits a high propensity to both send and receive signals via the Hh pathways. Dotted box: UMAP-based plot and cluster labels of the E13.5 scRNA-seq data. b Feature plots of Ihh and Ptch1. Violet: high expression, yellow: low expression. c Violin plots displaying the expression distribution of Ihh and Ptch1 in each cluster. d Chord diagram shows the signals linking Cluster 1 and other clusters via the Hh pathway. e Heatmap represents the relative importance of each cluster. Dark green: higher importance, white: lower importance. Cluster 1 is scored as the dominant sender, receiver, and influencer of the Ihh-Ptch1 signaling pathway. Cluster 5 is measured as a dominant receiver. f Hierarchical plot showing the intercellular interactions of the chondrocyte-perichondrial cell lineage via the Ihh-Ptch1 signaling pathway. g Functional analysis of Hedgehog signaling in Dlx5-creER+ early perichondrial cells and Fgfr3-creER+ fetal chondrocytes in bone marrow development. Left panels: Histological images of Dlx5-creER; Ptch1fl/+; R26RtdTomato (Dlx5-Control), Dlx5-creER; Ptch1fl/fl; R26RtdTomato (Dlx5-Ptch1 cKO), Fgfr3-creER; Ptch1fl/+; R26RtdTomato (Fgfr3-Control), Fgfr3-creER; Ptch1fl/fl; R26RtdTomato (Fgfr3-Ptch1 cKO), femur at E18.5 (pulsed at E12.5). Scale bar: 500 μm. n = 8 (Dlx5-Control), n = 11 (Dlx5-Ptch1 cKO), n = 10 (Fgfr3-Control), n = 8 (Dlx5-Ptch1 cKO) mice per each group. Right panels: quantification of whole femur length (top left), bone marrow length per total bone length (middle left), distal cartilage length per total bone length (bottom left), Col1a1-GFP+ trabecular area per total bone marrow area (top right), number of chondrocytes per column (middle right) and total number of columns in growth plate (bottom right). n = 8 (Dlx5-Control), n = 11 (Dlx5-Ptch1 cKO), n = 10 (Fgfr3-Control), n = 8 (Dlx5-Ptch1 cKO) mice per group. Two-tailed, Mann–Whitney’s U test. Data are presented as mean ± s.d. Exact P value is indicated in the figures. Source data are provided as a Source Data file.
Fig. 5
Fig. 5. Dlx5-creER+ perichondrial cells contribute postnatally to diaphyseal bone marrow stroma.
ad Contribution of fetal (E12.5) Dlx5-creER+, Osx-creER+ or Fgfr3-creER+ cells to postnatal (P21) skeletal compartments. Cxcl12GFP/+; Dlx5-creER; R26RtdTomato ((a): left, (b): upper left), Cxcl12GFP/+; Osx-creER; R26RtdTomato ((a): center, (b): upper center), Cxcl12GFP/+; Fgfr3-creER; R26RtdTomato ((a): right, (b): upper right), Col1a1(2.3kb)-GFP; Dlx5-creER; R26RtdTomato ((b): middle left, lower left), Osteocalcin (Ocn) -GFP; Osx-creER; R26RtdTomato ((b): middle center, lower center) or Col1a1(2.3kb)-GFP; Fgfr3-creER; R26RtdTomato femurs ((b):middle right, lower right). n = 4 mice per group. (a): Whole femurs with growth plates on top. Scale bar: 500 µm. n = 4 mice per group. (b): (Upper panels): metaphyseal bone marrow (top), diaphyseal bone marrow (bottom). Scale bar: 20 µm. (Middle panels): metaphyseal cortical bone (left), diaphyseal cortical bone (right). Scale bar: 20 µm. Lower panels: groove of Ranvier. Scale bar: 50 µm. (c): Quantification of tdTomato+ bone marrow stromal cells (left) and osteoblasts/cytes (right), based on distance from growth plate. Red: Dlx5-creER+, Green: Osx-creER+, Blue: Fgfr3-creER+ cell-derivatives. n = 4 mice per each group. (d): Flow cytometry analysis of CD45/Ter119/ CD31neg cells at P21. Bone marrow cells isolated from Cxcl12GFP/+; Dlx5-creER; R26RtdTomato femurs (pulsed at E12.5), Cxcl12GFP/+; Osx-creER; R26RtdTomato femurs (pulsed at E12.5) and Cxcl12GFP/+; Fgfr3-creER; R26RtdTomato femurs (pulsed at E12.5). n = 5 (Dlx5-E12.5), n = 5 (Osx-E12.5), n = 10 (Fgfr3-E12.5) mice per group. Two-tailed, One-way ANOVA followed by Tukey’s post-hoc test. Data are presented as mean ± s.d. Exact P value is indicated in the figures. e Contribution of fetal (E12.5) Dlx5-creER+, Osx-creER+ or Fgfr3-creER+ cells to adult (3 M) skeletal compartments. Upper panels: metaphysis. Lower panels: diaphysis. Scale bar: 500 µm. n = 4 mice per each group. Source data are provided as a Source Data file.
Fig. 6
Fig. 6. Adipocyte-biased state of Dlx5-creER+ perichondrial cell-derived marrow stromal cells.
a Diagram of comparative bulk RNA-seq analysis of Cxcl12-GFPhigh stromal cells at P21 that are derived from fetal Dlx5+ perichondrial cells and Fgfr3 + chondrocytes. GFPhightdTomato+ (Dlx5CE-E12.5 and Fgfr3CE-E12.5) cells were isolated from P21 Cxcl12GFP/+; Dlx5-creER; R26RtdTomato and Cxcl12GFP/+; Fgfr3-creER; R26RtdTomato femurs (pulsed at E12.5) by FACS. n = 3 (Dlx5CE-E12.5: pooled from n = 4 mice), n = 2 (Fgfr3CE-E12.5: pooled from n = 4 mice) biologically independent samples. b Principal component analysis (PCA) plot of five biologically independent samples. Circles: Cxcl12-GFPhighDlx5-E12.5 cells, Triangles: Cxcl12-GFPhighFgfr3-E12.5 cells. x-axis: PC1, 96.4% variance, y-axis: PC2, 2.1% variance. c Volcano plot for differentially expressed genes (DEGs). x-axis: log2fold-change, y-axis: -log10adjusted p-value. Total of 10,524 genes (excluding known pseudogenes). 1379 and 1854 genes upregulated in Dlx5CE-E12.5 (blue) and Fgfr3CE-E12.5 (red) cells, respectively. Two-sided exact test for difference in means of the negative binomial distribution, followed by Benjamini-Hochberg (B-H) method adjusted for multiple comparisons. d Heatmap of representative DEGs associated with chondrocyte, osteoblast or adipocyte differentiation. Star: statistically significant DEGs between Dlx5CE-E12.5 and Fgfr3CE-E12.5. e Gene Ontology enrichment analysis based on 1379 and 1854 genes upregulated in Dlx5CE-E12.5 and Fgfr3CE-E12.5 cells, respectively. Top 20 GO terms ranked by B-H adjusted p-value. x-axis: number of genes enriched in the corresponding GO term. Color indicates adjusted p-value. One-sided Fisher’s exact test, followed by B-H adjustment for multiple testing. f Colony-forming unit fibroblast (CFU-F) assay of E12.5-pulsed Dlx5-creER; R26RtdTomato (upper left panels) and Fgfr3-creER; R26RtdTomato (lower left panels) bone marrow cells. MB: Methylene blue staining. Scale bar: 5 mm. Right panel: Percentage of tdTomato+ colonies among total CFU-Fs. Dlx5CE-E12.5: n = 4, Fgfr3CE-E12.5: n = 7 mice. Two-tailed, Mann–Whitney’s U-test. Data are presented as mean ± s.d. Exact P value is indicated in the figures. g Dlx5+ fetal outer perichondrial cells contribute to diaphyseal adipogenic marrow stromal cells, while Fgfr3+ fetal chondrocytes contribute to osteogenic metaphyseal stromal cells. Source data are provided as a Source Data file.
Fig. 7
Fig. 7. Anabolic and injury responses of Dlx5-creER+ perichondrial cell-derived marrow stromal cells.
ac Differential responses of marrow stromal cells derived from Dlx5+ perichondrial cells and Fgfr3+ chondrocytes to intermittent administration of parathyroid hormone (PTH) (iPTH). (b): Col1a1(2.3kb)-GFP; Dlx5-creER; R26RtdTomato (Dlx5CE-E12.5, left), Col1a1(2.3kb)-GFP; Fgfr3-creER; R26RtdTomato (Fgfr3CE-E12.5, center), and Col1a1(2.3kb)-GFP; R26RtdTomato (Control, right) distal femurs, with iPTH or Vehicle for 3 weeks from P21 to P42. Scale bar: 500 µm. (c): Quantification of Col1a1(2.3 kb)-GFP+ cells (left) and Col1a1(2.3 kb)-GFP+tdTomato+ cells (right) in the metaphysis. n = 6 (Dlx5CE-E12.5), n = 5 (Fgfr3CE-E12.5), n = 4 (Control) mice. Two-tailed, One-way ANOVA followed by Tukey’s post-hoc test (left). Two-tailed, Mann-Whitney’s U-test (right). Data are presented as mean ± s.d. Exact P value is indicated in the figures. df Injury-responsive osteogenesis of marrow stromal cells derived from fetal perichondrial cells (Dlx5CE-E12.5) and chondrocytes (Fgfr3CE-E12.5) cells. (e): Reactive osteogenesis induced by bone marrow ablation in Col1a1(2.3kb)-GFP; Dlx5-creER; R26RtdTomato (left panels) and Fgfr3-creER; R26RtdTomato (right panels) femurs at P28 (pulsed at E12.5). These mice underwent surgery at P21. Metaphyseal (upper) and diaphyseal (lower) marrow space after one week of surgery. Scale bar: 500 µm. (f): Quantification of Col1a1-GFP+tdTomato+ cells in the metaphyseal and diaphyseal bone marrow. Percentage of Col1a1-GFP+tdTomato+ osteoblasts within Col1a1-GFP+ osteoblasts in the metaphysis (left) and diaphysis (right). n = 5 (Dlx5CE-E12.5), n = 4 (Fgfr3CE-E12.5) mice. Two-tailed, Mann-Whitney’s U-test. Data are presented as mean ± s.d. Exact P value is indicated in the figures. Source data are provided as a Source Data file.
Fig. 8
Fig. 8. Dlx5+ fetal perichondrial cells are important cell-of-origin for distal bone marrow stroma.
Dlx5+ fetal outer perichondrial cells translocate into the nascent marrow space and directly differentiate into marrow stromal cells by bypassing a Sox9+ state (chondrocyte-independent pathway). These early perichondrial skeletal cells continue to provide osteoblasts and bone marrow stromal cells well into the postnatal stage, unlike Osx+ perichondrial cells that have a limited life span. As a result, postnatal bone narrow is characterized by transitional mosaicism composed of both chondrocyte-derived and perichondrium-derived stromal cells.

References

    1. Zhou BO, Yue R, Murphy MM, Peyer JG, Morrison SJ. Leptin-receptor-expressing mesenchymal stromal cells represent the main source of bone formed by adult bone marrow. Cell Stem Cell. 2014;15:154–168. doi: 10.1016/j.stem.2014.06.008. - DOI - PMC - PubMed
    1. Yang L, Tsang KY, Tang HC, Chan D, Cheah KS. Hypertrophic chondrocytes can become osteoblasts and osteocytes in endochondral bone formation. Proc. Natl Acad. Sci. USA. 2014;111:12097–12102. doi: 10.1073/pnas.1302703111. - DOI - PMC - PubMed
    1. Shi Y, et al. Gli1 identifies osteogenic progenitors for bone formation and fracture repair. Nat. Commun. 2017;8:2043. doi: 10.1038/s41467-017-02171-2. - DOI - PMC - PubMed
    1. Maes C, et al. Osteoblast precursors, but not mature osteoblasts, move into developing and fractured bones along with invading blood vessels. Dev. Cell. 2010;19:329–344. doi: 10.1016/j.devcel.2010.07.010. - DOI - PMC - PubMed
    1. Zhou X, et al. Chondrocytes transdifferentiate into osteoblasts in endochondral bone during development, postnatal growth and fracture healing in mice. PLoS Genet. 2014;10:e1004820. doi: 10.1371/journal.pgen.1004820. - DOI - PMC - PubMed

Publication types

Substances