. 2022 Nov 28;13(1):7338.
doi: 10.1038/s41467-022-34632-8.

Lysosomal damage drives mitochondrial proteome remodelling and reprograms macrophage immunometabolism

Affiliations

Lysosomal damage drives mitochondrial proteome remodelling and reprograms macrophage immunometabolism

Claudio Bussi et al. Nat Commun. .

Abstract

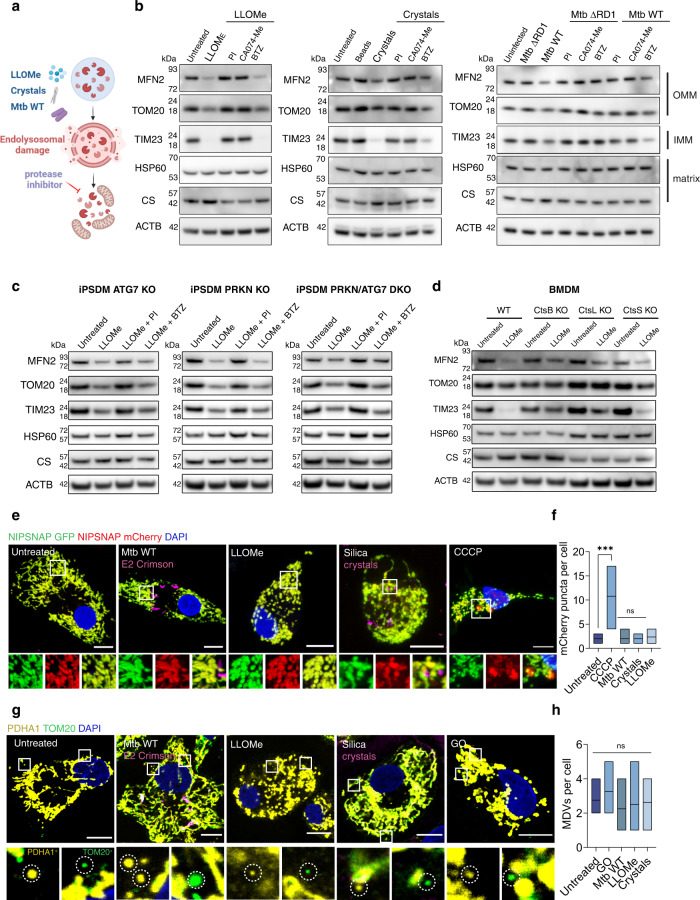
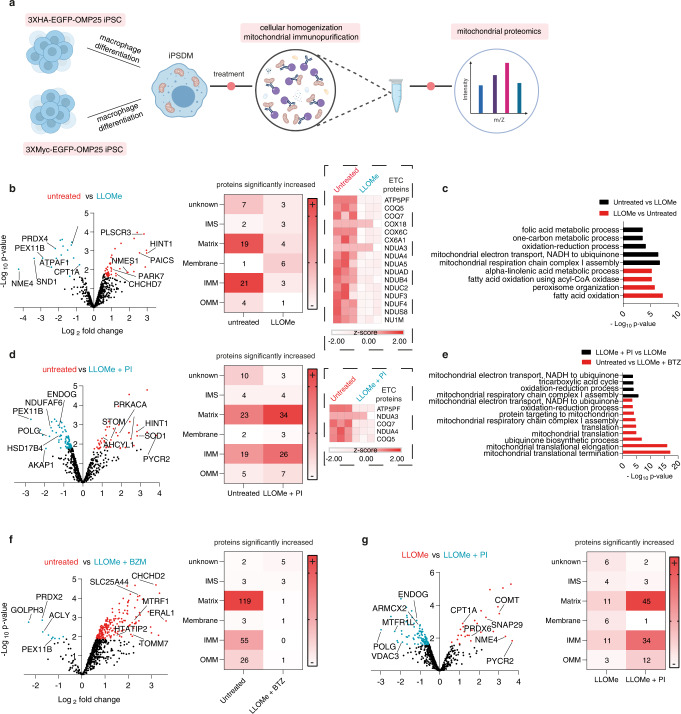
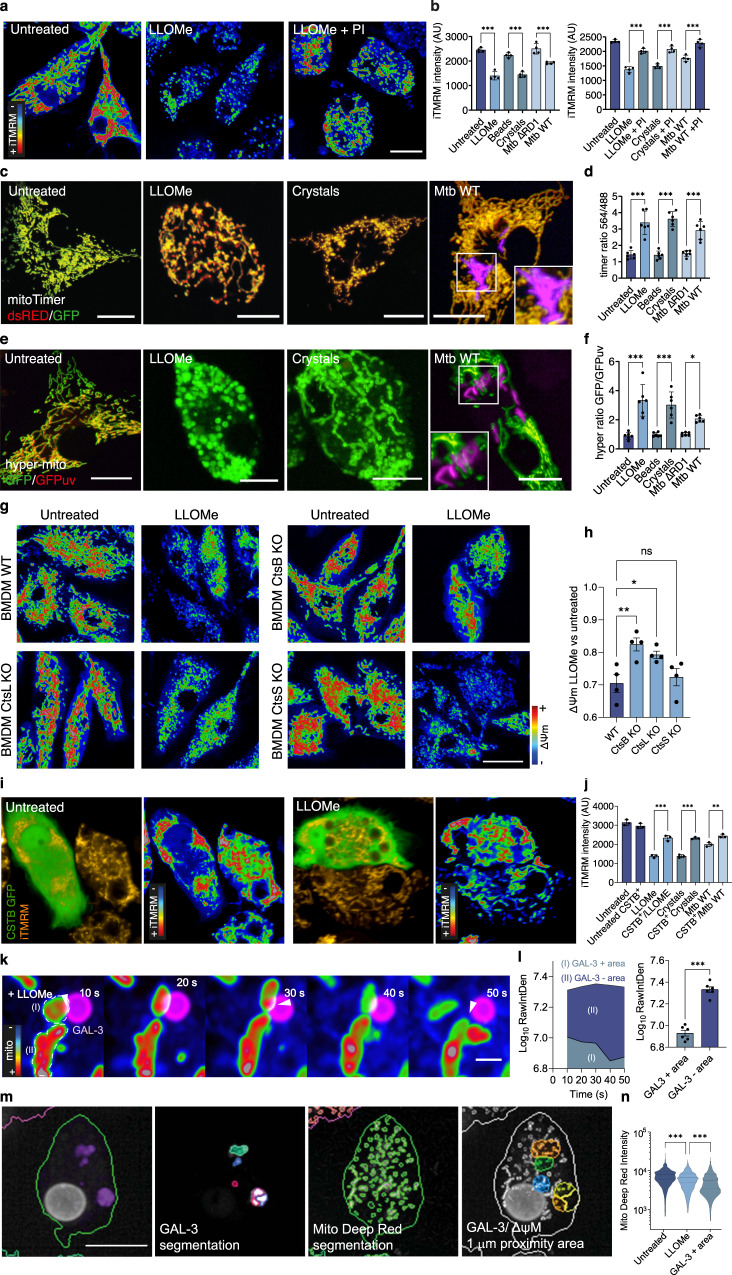
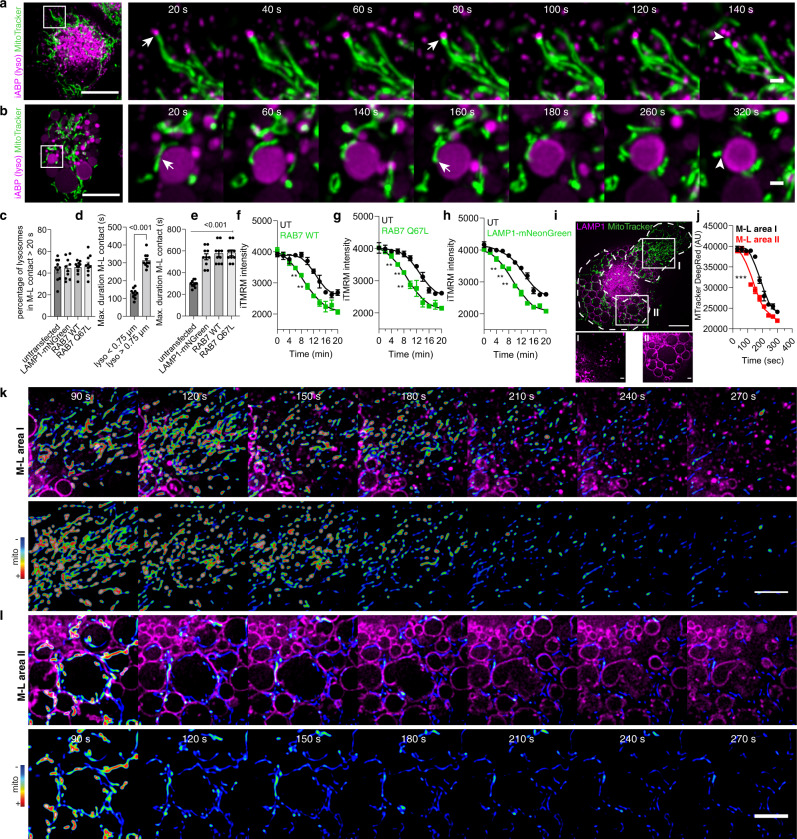
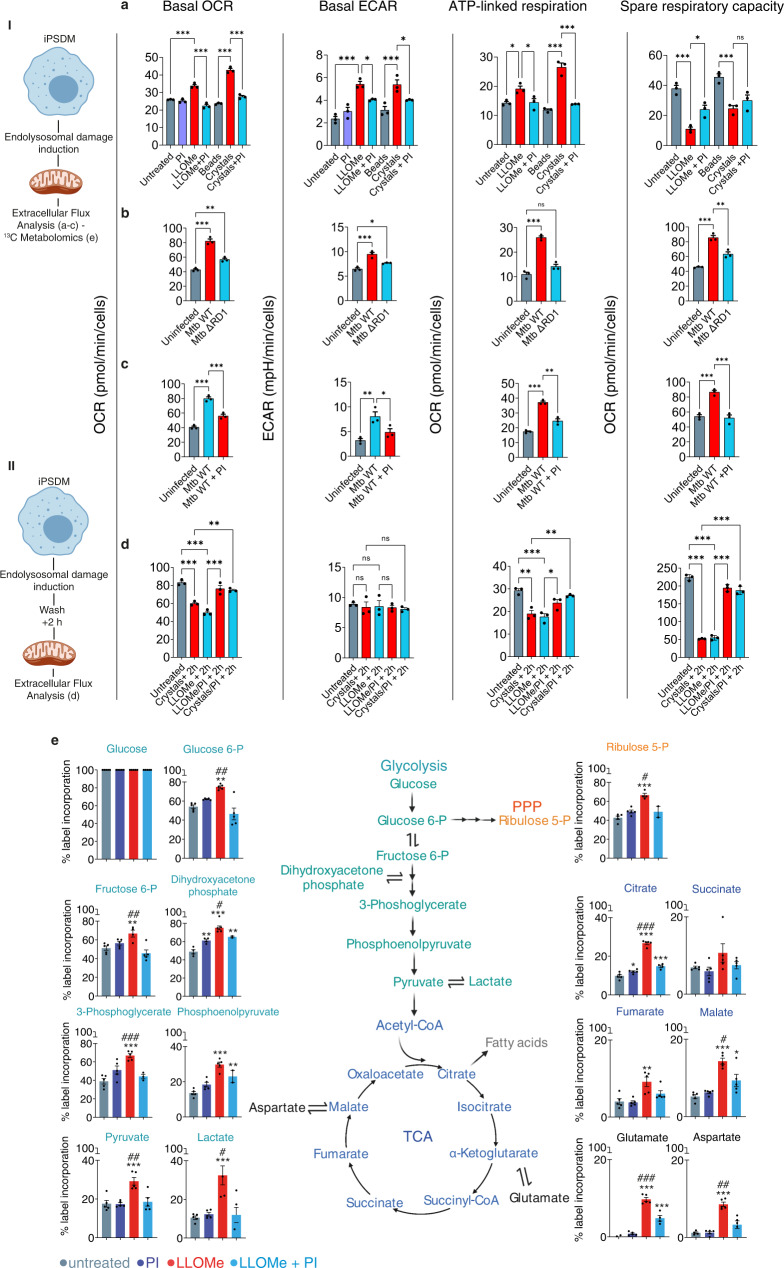
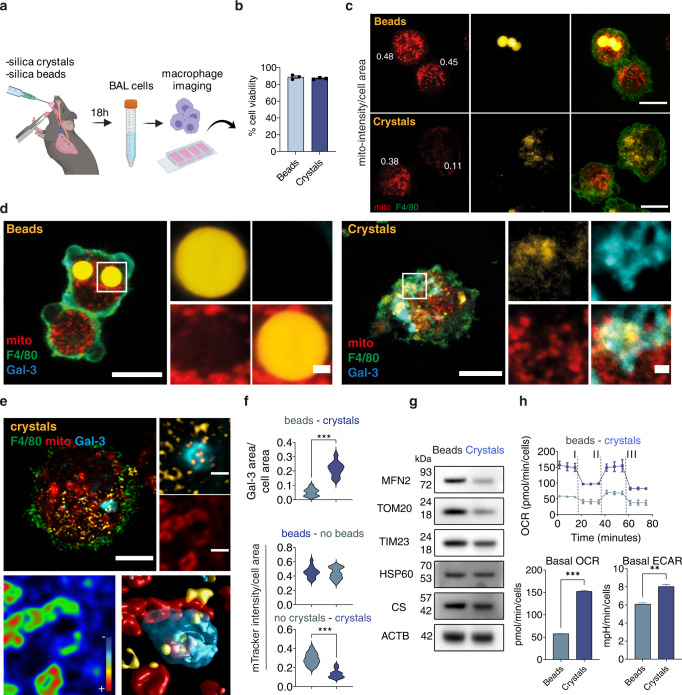
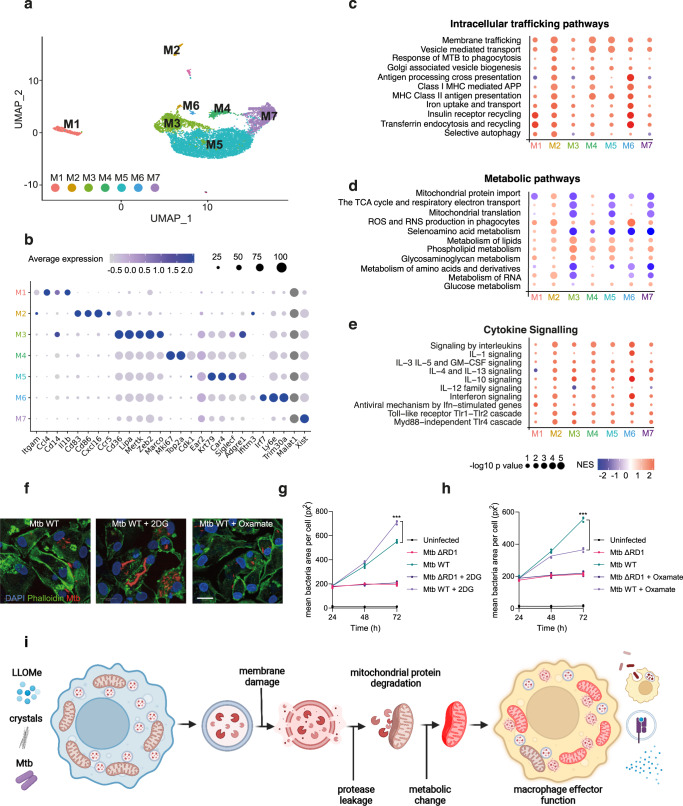
Transient lysosomal damage after infection with cytosolic pathogens or silica crystals uptake results in protease leakage. Whether limited leakage of lysosomal contents into the cytosol affects the function of cytoplasmic organelles is unknown. Here, we show that sterile and non-sterile lysosomal damage triggers a cell death independent proteolytic remodelling of the mitochondrial proteome in macrophages. Mitochondrial metabolic reprogramming required leakage of lysosomal cathepsins and was independent of mitophagy, mitoproteases and proteasome degradation. In an in vivo mouse model of endomembrane damage, live lung macrophages that internalised crystals displayed impaired mitochondrial function. Single-cell RNA-sequencing revealed that lysosomal damage skewed metabolic and immune responses in alveolar macrophages subsets with increased lysosomal content. Functionally, drug modulation of macrophage metabolism impacted host responses to Mycobacterium tuberculosis infection in an endomembrane damage dependent way. This work uncovers an inter-organelle communication pathway, providing a general mechanism by which macrophages undergo mitochondrial metabolic reprograming after endomembrane damage.


Conflict of interest statement

The authors declare no competing interests.

Figures

Fig. 1
Fig. 1. Lysosomal protease leakage triggers mitochondrial protein degradation in macrophages.
a Schematic showing the conditions tested in this study. b Immunoblots for MFN2, TOM20, TIM23, HSP60 and Citrate synthase (CS) in iPSDM stimulated with 0.5 mM LLOMe for 1 h, 100 μg/mL silica crystals or beads for 3 h or infected with Mtb WT or Mtb ΔRD1 for 48 h and incubated with the indicated protease or proteasome inhibitors. Beta-actin (ACTB) levels were used as loading controls (repeated three times with similar results). c Immunoblots for mitochondrial proteins in iPSDM WT, ATG7 KO, PRKN KO and PRKN/ATG7 DKO stimulated with 0.5 mM LLOMe for 1 h and incubated in the presence or absence of the indicated inhibitors (repeated three times with similar results). d Immunoblots for mitochondrial proteins in BMM WT, CtsB KO, CtsL KO and CtsS KO stimulated with 0.5 mM LLOMe for 1 h. (repeated three times with similar results). e Representative images of iPSDM expressing the mitophagy reporter NIPSNAP and stimulated with 0.5 mM LLOMe for 1 h, 100 μg/mL silica crystals for 3 h, infected with Mtb WT for 48 h or treated with 20 μM CCCP for 3 h. f NIPSNAP mCherry only puncta evaluated by confocal microscopy, n = 30 cells examined per condition over three independent experiments. g TOM20+/PDHA1 and PDH+/TOM20 MDVs were quantified after the indicated conditions. Glucose oxidase (GO) was used at 50 mU/ml for 1 h as a positive control, n = 20 cells examined per condition over three independent experiments. h One‐way ANOVA and Tukey post-test was used for multiple comparisons ***p ≤ 0.001, ns no significant. Scale bars, 10 μm. Floating bar plots show minimum and maximum values, line at mean. Unprocessed blots and Source data are provided as a Source Data file.
Fig. 2
Fig. 2. Lysosomal leakage remodels the mitochondrial proteome in macrophages.
a Schematic showing the MITO-tag workflow in iPSDM. b Proteomic analysis of isolated mitochondria from MITO-tag iPSDM untreated (red) or treated with LLOMe (blue). Volcano plot shows proteins with fold change > 1.5 and an adjusted p-value ≤ 0.05. The two most upregulated proteins in the OMM, IMM and matrix (Supplementary Data 1) are shown as illustrative example. Heat maps show the mitochondrial localization of the proteins that were significantly increased in the indicated comparison and ETC proteins significantly decreased after LLOMe treatment are shown (dashed box). Annotations were obtained from MitoCarta3.0. c Significantly regulated proteins from the indicated conditions (Supplementary Table 1) were used for Gene Ontology (GO) cellular component enrichment analysis using the Gene Functional Annotation Tool available at the DAVID v6.7 website (https://david.ncifcrf.gov/). A maximum p-value of 0.05 (Benjamini) was chosen to select only significantly enriched GO cellular components. d Volcano plot and mitochondrial protein localization as in (a) in the presence or absence of protease inhibitors (PI). The ETC proteins from (a) significantly decreased in the presence of the PI are shown (dashed box). See also Supplementary Table 2. e Bar graph showing GO cellular component enrichment analysis from the indicated conditions as in (c). f Volcano plot and mitochondrial protein localization as in (a) in the presence or absence of the proteasome inhibitor Bortezomib (BTZ). g Volcano plot and mitochondrial protein localization as in (a) comparing LLOMe-treated iPSDM in the presence or absence of PI. n = 3 independent experiments. Source data are provided in Supplementary Data 1.
Fig. 3
Fig. 3. Lysosomal leakage impacts mitochondrial activity in macrophages.
a iTMRM intensity levels in iPSDM untreated or treated with 0.5 mM LLOMe in the presence or absence of PI. b Quantification of iTMRM intensity in iPSDM treated with LLOMe for 1 h, 100 μg/mL silica crystals or beads for 3 h or infected with Mtb WT or Mtb ΔRD1 for 48 h and incubated in the presence or absence of PI. c, d iPSDM expressing mito-timer (c) and fluorescence ratio evaluation by high-content imaging followed by mitochondrial segmentation (d). e, f iPSDM expressing hyper-mito (e) and fluorescence ratio quantification (f). g, h iTMRM intensity levels (g) and quantification (h) of BMM WT, CtsB KO, CtsL KO and CtsS KO stimulated with 0.5 mM LLOMe for 1 h (i) iTMRM intensity levels in iPSDM expressing or not CSTB C-GFPSpark and untreated or not with LLOMe. j Quantification of iTMRM intensity in iPSDM expressing CSTB C-GFPSpark and treated as in (b). One‐way ANOVA and Tukey post-test was used for multiple comparisons. k iPSDM expressing GAL-3-RFP and incubated with MitoTracker Deep Red were treated with 0.5 mM of LLOMe and imaged immediately after stimulation at 1 frame per 10 s. A selected sequence showing a GAL-3 positive vesicle in proximity of mitochondria is shown. Scale bar: 1 μm. l MitoTracker Deep Red intensity quantification of mitochondrial areas in proximity of GAL-3- positive vesicles or without interaction (GAL-3-negative), illustrated as “I” and “II”, respectively. Bar plots show 12 events per condition from one out of three representative experiments. A paired t-test test was used for comparisons. Images shown are z-stack projections. m, n High-content single-cell analysis pipeline (m) and mitochondrial membrane potential quantification (n) of iPSDM expressing GAL-3-RFP. Mitochondrial regions around 1 μm distance from a GAL-3 positive vesicle are considered as GAL-3 positive areas. *p ≤ 0.05; **p ≤ 0.01; ***p ≤ 0.001. Images shown are z-stack projections. Bar plots show data mean values +/− SEM of at least three independent experiments. Scale bars: 10 μm. Source data are provided as a Source Data file.
Fig. 4
Fig. 4. Proteases leakage from damaged lysosomes in the proximity of mitochondria affects mitochondrial activity.
a, b Live-cell super-resolution imaging (20 s time frame) of iPSDM incubated with MitoTracker Green and with the iABP probe showing sequences following a small (a) and a large (b) lysosome. Scale bars: 10 μm and 1 μm for images and zoom-in, respectively, (see Supplementary Movie 1–2). ce Quantification from the datasets described above and in Supplementary Fig. 4 showing the percentage of lysosomes in contact with a mitochondrion longer than 20 s (c), the maximum duration of M-L contact in untransfected iPSDM considering lysosomes smaller than 0.75 μm and larger than 0.75 μm (d) or comparing untransfected iPSDM with iPSDM transiently expressing the indicated plasmids (e). Data represent the mean  ± SEM of at least 10 cells from one out of three independent experiments. fh High content single cell evaluation of iTMRM intensity over time comparing untransfected iPSDM with iPSDM transiently expressing RAB7 WT GFP (f), RAB(Q67L) GFP (g) or Lamp1-mNeonGreen (h) after the addition of 0.5 mM of LLOMe. Spline curves are shown, a paired t-test test was used for comparisons. i iPSDM expressing Lamp1-mNeonGreen where the mitochondrial membrane potential evaluation is done in two different M-L areas, where area “I” is characterized by a higher density of small lysosomes in comparison with area “II” as indicated in the bottom panel. Scale bar: 1 μm. j Quantification of MitoTracker Deep Red intensity after LLOMe treatment in the indicated M-L areas. k, l A time-lapse sequence belonging to M-L area “I” and “II”, respectively. The mitochondrial signal is shown as RGB rainbow scale, (see Supplementary Movie 3–5). **p ≤ 0.01; ***p ≤ 0.001. Bar plots represent mean values +/− SEM of at least three independent experiments. Scale bars: 10 μm and 5 μm for images and zoom-in, respectively. Source data are provided as a Source Data file.
Fig. 5
Fig. 5. Lysosomal protease leakage reprograms macrophage metabolism.
a Extracellular flux analysis (EFA) using Cell Mito Stress Test kit with iPSDM left untreated or treated with LLOMe (0.5 mM, 1 h) or silica crystals (100 μg/mL, 3 h) in presence or absence of PI. b EFA of iPSDM uninfected or infected with Mtb ΔRD1 or Mtb WT for 48 h. c EFA of iPSDM uninfected or infected with Mtb WT for 48 h in presence or absence of PI. d iPSDM treated as in (a) but EFA started after 2 h of removing LLOMe or silica crystals treatment. Data show the mean ± SEM of two out of three independent experiments. Values were normalised to cell number. *p ≤ 0.05, **p ≤ 0.01, ***p ≤ 0.001, one-way ANOVA with Tukey’s multiple comparisons test. e 13C enrichment of metabolites extracted from iPSDM incubated with [U-13C]glucose and left untreated or treated with 0.5 mM of LLOMe for 1 h in the presence or absence of PI (n = 5 technical replicates). “I” and “II” illustrate the time point when EFA started or 13C enrichment was evaluated. *p ≤  0.05, **p ≤ 0.01, ***p ≤ 0.0001, one-way ANOVA with Dunnett’s multiple comparisons test vs untreated. #p ≤ 0.05, ##p ≤ 0.01, ###p ≤ 0.001, unpaired t-test (LLOMe vs LLOMe + PI). Source data are provided as a Source Data file. See also Supplementary Fig. 5 and Supplementary Data 2.
Fig. 6
Fig. 6. Lysosomal leakage affect mitochondrial activity and macrophage metabolism in vivo.
a Mice were intratracheally intubated with silica crystals or beads and after 18 h BAL fluids obtained. b Bar graph shows cellular viability measured by trypan blue exclusion test (n = 3 independent experiments). c BAL cells were labelled with anti-F4/80 antibody and incubated with MitoTracker Deep Red for live-cell confocal imaging and mitochondrial fluorescence intensity evaluation. n = 3 independent experiments. d BAL cells were labelled with MitoTracker Deep Red, fixed and stained for F4/80 and Galectin-3 (Gal-3). Crystals were imaged by reflection microscopy. n = 3 independent experiments. e 3D Confocal imaging analysis of an F4/80+ macrophage with low membrane potential mitochondria in the proximity of a crystals-induced GAL-3-positive endolysosome. f Quantitative analysis of MitoTracker intensity and GAL-3 area in F4/80+ macrophages from the BALs. At least 20 cells were counted per condition. g Western blot analysis of mitochondrial proteins in BAL cells. h EFA shows the OCR values after the addition of Oligomycin (I), FCCP (II) and a mix of rotenone/antimycin (III). The bar graphs show the basal OCR and ECAR values. Data are from one representative experiment out of two. Values were normalised to cell number. An unpaired two-tail t-test test was used for comparisons. **p ≤ 0.01, ***p ≤ 0.001. Images shown are z-stack projections. Scale bars, 10 μm and 1 μm for images and zoom-in, respectively. Bar plots represent mean values +/− SEM of at least two independent experiments. Unprocessed blots and Source data are provided as a Source Data file.
Fig. 7
Fig. 7. Lysosomal leakage regulates metabolic and immune responses in specific subsets of macrophages in vivo.
a UMAP plot of BAL cells (n = 8723) showing seven identified macrophage clusters (M1-M7). b Dot-plot showing expression levels of representative genes for each macrophage cluster. ce Intracellular trafficking (c), metabolic (d) and cytokine signalling (e) pathways significantly enriched by the treatment among the different macrophage populations (results show fold change vs beads). f Representative images of iPSDM infected with Mtb WT for 72 h in the presence of absence of 2-DG or oxamate. n = 3 independent experiments. g, h iPSDM were infected with Mtb ΔRD1 or Mtb WT and incubated in the presence or absence of 2-DG (g) or oxamate (h). Graphs show mean bacteria area per macrophage at 24, 48 and 72 h after infection. Data represent the mean ± SEM of three independent biological replicates. One‐way ANOVA and Tukey post-test was used for multiple comparisons, ***p ≤ 0.001. i Scheme summarising the main events leading to macrophage metabolic reprogramming after lysosomal protease leakage. Source data are provided as a Source Data file. Scale bar, 10 μm. See also Supplementary Figs. 8–9, Supplementary Table 2 and Supplementary Data 3 and 4.

References

    1. Papadopoulos C, Kravic B, Meyer H. Repair or lysophagy: dealing with damaged lysosomes. J. Mol. Biol. 2020;432:231–239. doi: 10.1016/j.jmb.2019.08.010. - DOI - PubMed
    1. Skowyra ML, Schlesinger PH, Naismith TV, Hanson PI. Triggered recruitment of ESCRT machinery promotes endolysosomal repair. Science. 2018;360:eaar5078. doi: 10.1126/science.aar5078. - DOI - PMC - PubMed
    1. Duewell P, et al. NLRP3 inflammasomes are required for atherogenesis and activated by cholesterol crystals. Nature. 2010;464:1357–1361. doi: 10.1038/nature08938. - DOI - PMC - PubMed
    1. Hornung V, et al. Silica crystals and aluminum salts activate the NALP3 inflammasome through phagosomal destabilization. Nat. Immunol. 2008;9:847–856. doi: 10.1038/ni.1631. - DOI - PMC - PubMed
    1. Stahl-Meyer J, Stahl-Meyer K, Jaattela M. Control of mitosis, inflammation, and cell motility by limited leakage of lysosomes. Curr. Opin. Cell Biol. 2021;71:29–37. doi: 10.1016/j.ceb.2021.02.003. - DOI - PubMed

Publication types