. 2022 Nov 28;13(1):7322.
doi: 10.1038/s41467-022-34854-w.

Chromatin accessibility dynamics dictate renal tubular epithelial cell response to injury

Affiliations

Chromatin accessibility dynamics dictate renal tubular epithelial cell response to injury

Xinyi Cao et al. Nat Commun. .

Abstract

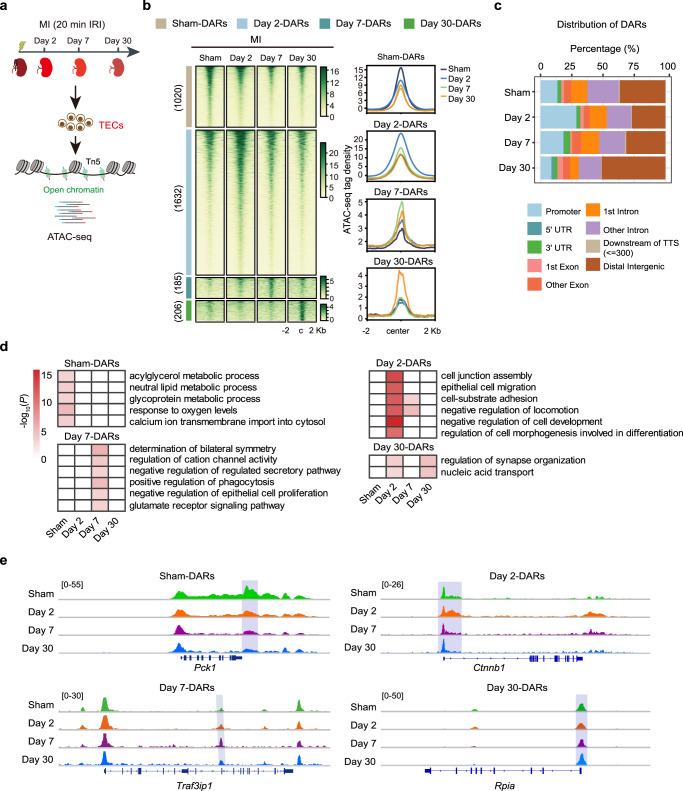
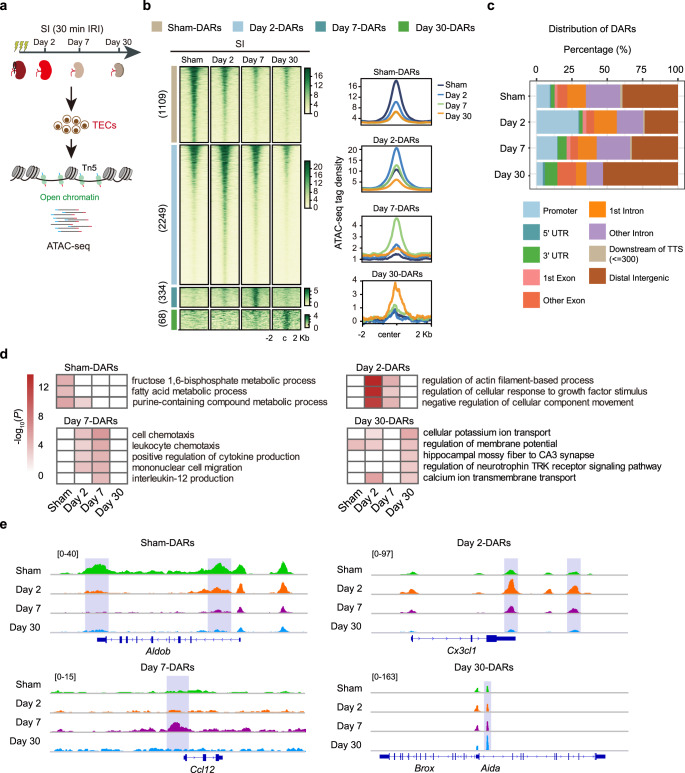
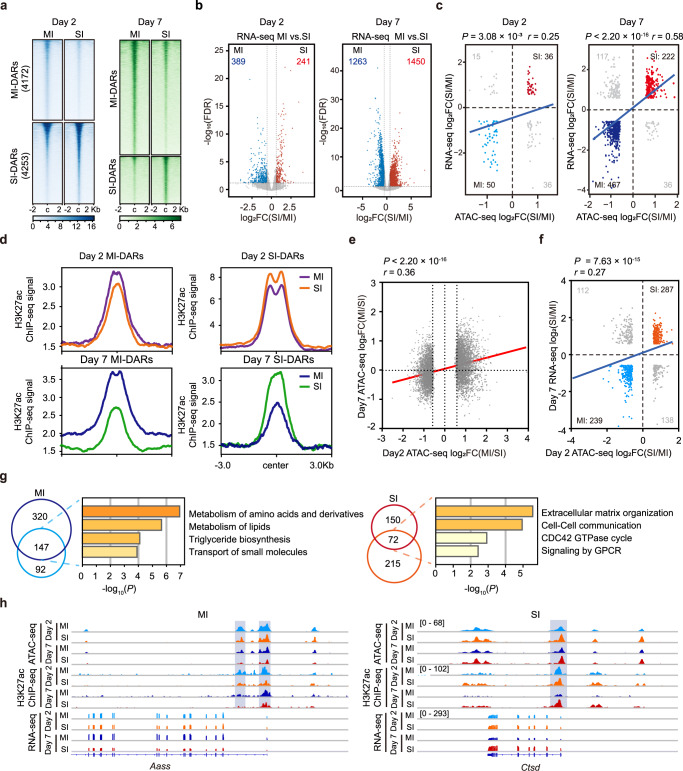
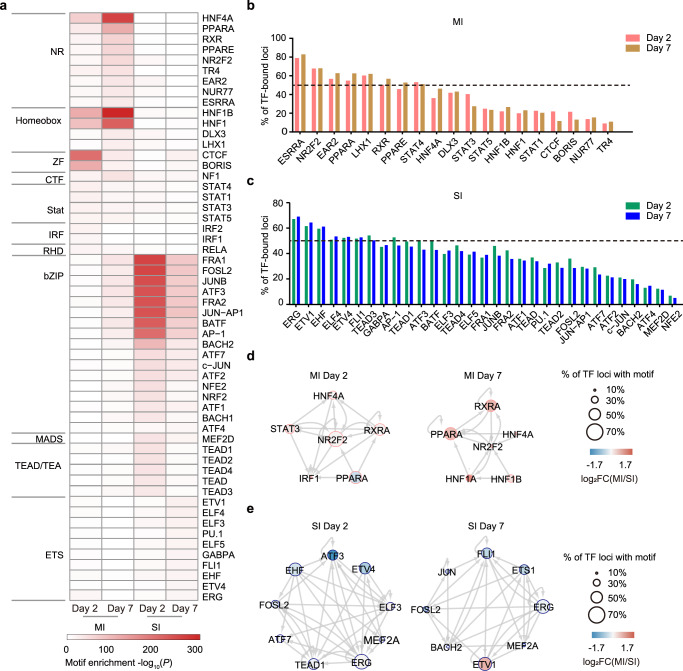
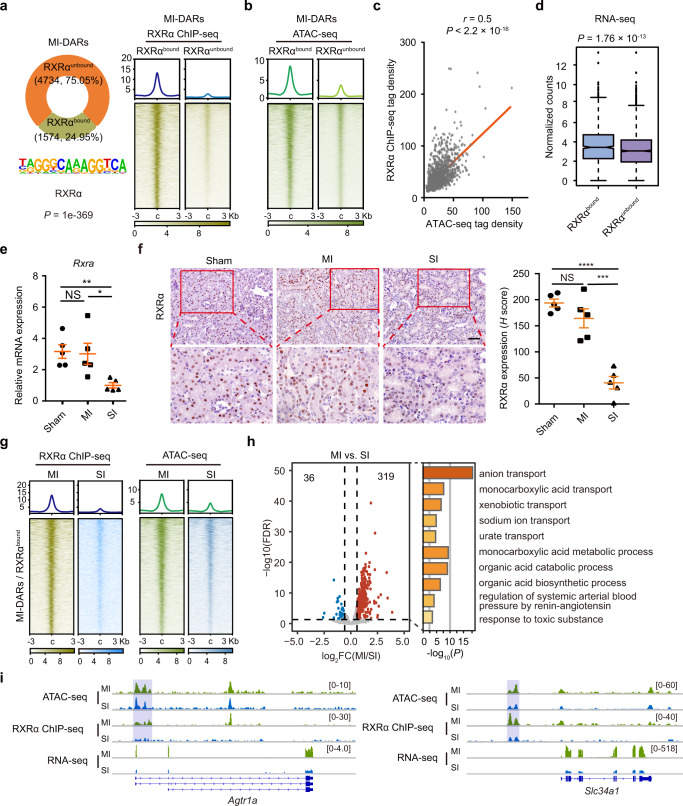
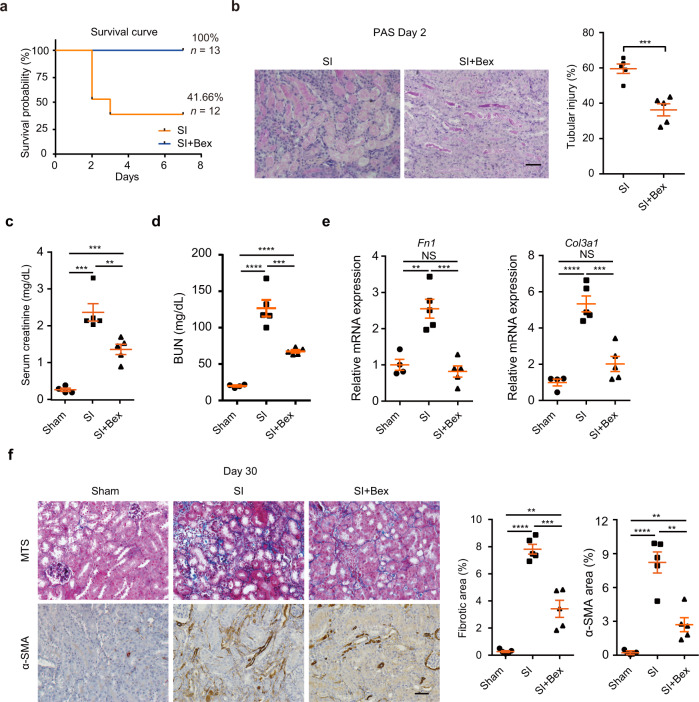
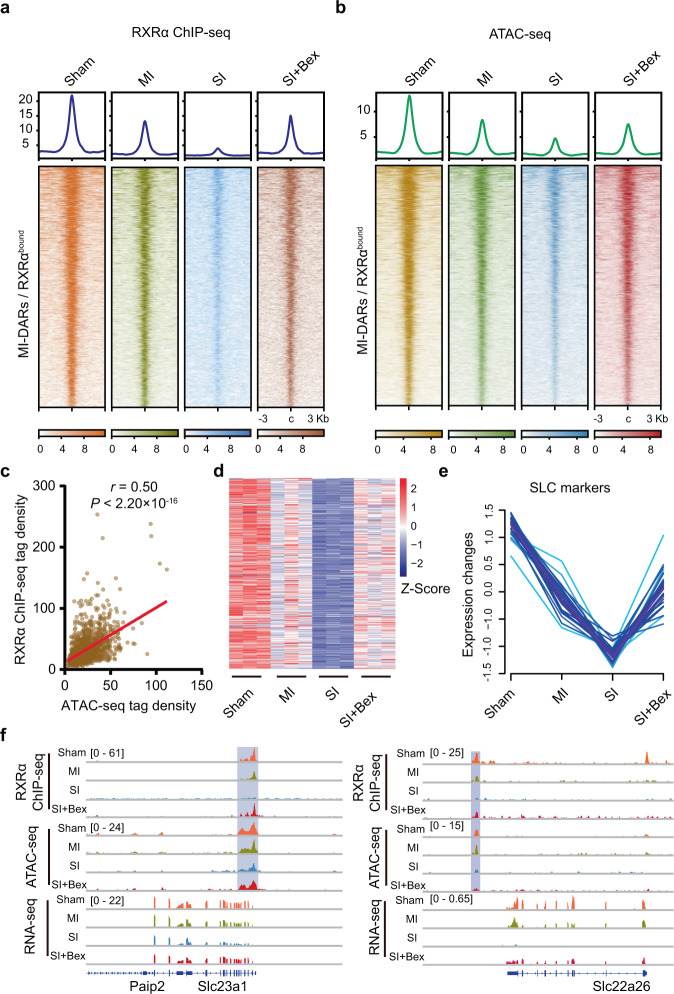
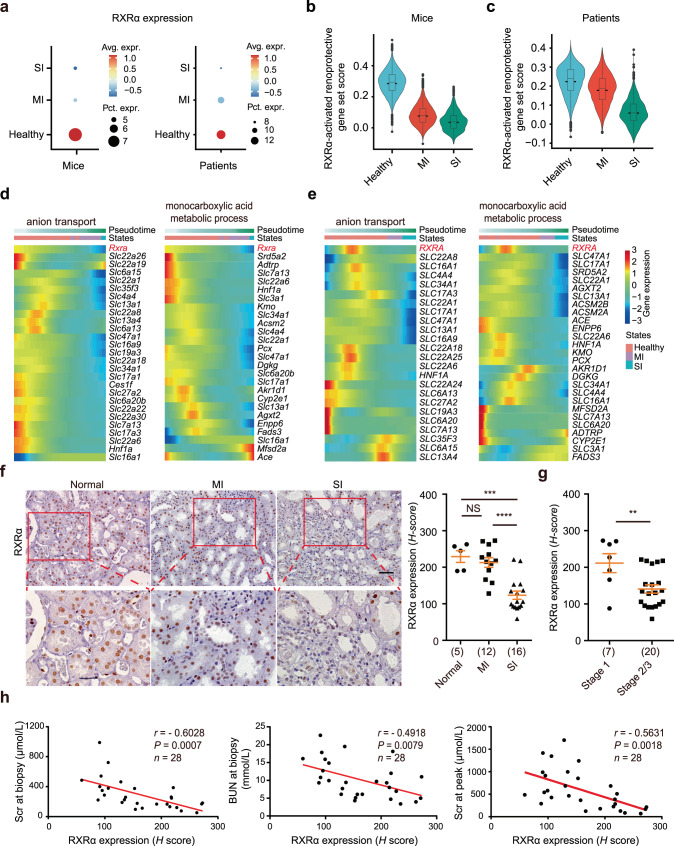
Renal tubular epithelial cells (TECs) can initiate an adaptive response to completely recover from mild acute kidney injury (AKI), whereas severe injury often leads to persistence of maladaptive repair and progression to kidney fibrosis. Through profiling of active DNA regulatory elements by ATAC-seq, we reveal widespread, dynamic changes in the chromatin accessibility of TECs after ischemia-reperfusion injury. We show that injury-specific domains of regulatory chromatin become accessible prior to gene activation, creating poised chromatin states to activate the consequent gene expression program and injury response. We further identify RXRα as a key transcription factor in promoting adaptive repair. Activation of RXRα by bexarotene, an FDA-approved RXRα agonist, restores the chromatin state and gene expression program to protect TECs against severe kidney injury. Together, our findings elucidate a chromatin-mediated mechanism underlying differential responses of TECs to varying injuries and identify RXRα as a therapeutic target of acute kidney injury.


Conflict of interest statement

The authors declare no competing interests.

Figures

Fig. 1
Fig. 1. Chromatin accessibility landscape of TECs after mild kidney injury.
a Experimental strategy for genome-wide ATAC-seq assay and time points of TEC collection after mild injury. b Temporal changes in chromatin accessibility during adaptive repair. Peaks are ordered vertically by ATAC-seq signal strength. The signal strengths are denoted by color intensities. c Genomic distribution of DARs at the indicated time points after mild injury. d Heatmaps of Biological Process GO terms in each cluster. P values were calculated by clusterProfiler R package and denoted by color intensities. e Genome browser view showing representative DARs at the indicated gene loci for TECs after mild injury. Source data are provided as a Source Data file.
Fig. 2
Fig. 2. Chromatin accessibility landscape of TECs after severe kidney injury.
a Experimental strategy for genome-wide ATAC-seq assay and time points of TEC collection after severe injury. b Temporal changes in chromatin accessibility during maladaptive repair. Peaks are ordered vertically by ATAC-seq signal strength. The signal strengths are denoted by color intensities. c Genomic distribution of DARs at the indicated time points after severe injury. d Heatmaps of Biological Process GO terms in each cluster. P values were calculated by clusterProfiler R package and denoted by color intensities. e Genome browser view showing representative DARs at the indicated gene loci for TECs after severe injury. Source data are provided as a Source Data file.
Fig. 3
Fig. 3. Injury-specific chromatin opening dictates gene activation.
a Heatmap visualization of ATAC-seq signals in Sham, MI, and SI TECs centered on peak summits ± 2 Kb. Peaks are ordered vertically by ATAC-seq signal strength. The signal strength are denoted by color intensities. b Volcano plots showing differentially expressed genes (DEGs) (MI versus SI). c Scatterplots of the DEGs and DARs-associated genes. Red indicates genes that are more accessible and upregulated in SI, and blue indicates genes that are more accessible and upregulated in MI. For Day 2, P = 3.08 × 10−3; for Day 7, P < 2.20 × 10−16. d Visualization of H3K27ac ChIP-seq signals in Sham, MI, and SI TECs centered on peak summits ± 3 Kb. e Scatterplot of the fold change (MI versus SI) of ATAC-seq signals in TECs at day 2 and day 7. P < 2.20 × 10−16. f Scatterplot of day 2 DARs-associated genes and day 7 DEGs. P = 7.63 × 10−15. g Pathway analysis of DEGs within day 2 DARs and day 7 DARs in mild or severe injury. Venn diagram shows overlap of MI- and SI-DARs-associated genes identified in c and f. h Genome browser view showing DARs at the indicated gene loci for TECs. Red represents increase, and blue represents decrease (b, c, f). Statistical significance was analyzed by cor.test (c, e, f) or Metascape (https://metascape.org/gp/index.html) (g). Source data are provided as a Source Data file.
Fig. 4
Fig. 4. Transcription factor regulatory networks in adaptive and maladaptive repair.
a TF motif enrichment in DARs shown in Fig. 3a. P values were calculated by HOMER, using the binomial distribution. The color bar indicates Log10(P). b, c Quantification of coverage of TF-binding motifs. d, e TF regulatory networks for day 2 (left) and day 7 (right). Node color represents TF expression and node size represents percentage of predicted TF-binding sites. The diameter of the dot on the right indicates the proportion of TF loci within the motif. The color bars on the left indicate the foldchange of each gene. Red represents an increase, and blue represents decrease. Source data are provided as a Source Data file.
Fig. 5
Fig. 5. Binding of RXRα correlates with chromatin openness and gene expression.
a Occupancy of RXRα on MI-DARs. The percentage of RXRα-bound sites and RXRα motif enrichment of MI-DARs (left). P value was calculated by HOMER, using the binomial distribution. ATAC-seq signals in DARs (right). b ATAC-seq signals on RXRαbound and RXRαunbound sites. c Pearson’s correlation coefficients of RXRα ChIP-seq signals and ATAC-seq signals on RXRαbound regions. Statistical significance was determined by the Correlation test. P < 2.2 × 10−16. d Gene expression levels of RXRαbound and RXRαunbound site-associated genes. Box plots represent median values, 25%, and 75% quantiles. Whiskers extend to 1.5 times the interquartile range. Statistical significance was determined by the two-sided Mann–Whitney U test. P = 1.76 × 10−13 (RXRαbound: n = 1194 genes, RXRαunbound: n = 2870 genes). e qRT-PCR analysis of Rxra mRNA in kidney tissues from Sham and AKI mice. From left to right: **P = 0.0017, NS P = 0.8569, *P = 0.0202, respectively, by two-tailed unpaired Student’s t-test. NS not significant. n = 5 biologically independent samples. f Immunohistochemistry staining of RXRα in kidney tissues from Sham and AKI mice. From left to right: ****P < 0.0001, NS P = 0.1729, ***P  =  0.0005, respectively, by two-tailed unpaired Student’s t-test. NS not significant. n = 5 biologically independent samples. Scale bars, 50 μm. g RXRα ChIP-seq and ATAC-seq signals in the SI group. h Volcano plot showing gene expression of RXRα-activated renoprotective genes. Blue or red represents a decrease and increase, respectively. Statistical analysis was calculated by Metascape. i Representative IGV tracks showing RXRα ChIP-seq, ATAC-seq, and RNA-seq signals of these 319 genes. The signal strength is denoted by color intensities (a, b, g). Data are represented as means ± SEM (e, f). Source data are provided as a Source Data file.
Fig. 6
Fig. 6. Bex treatment protects TECs against severe injury.
a Kaplan–Meier survival curves for mice with or without Bex treatment. n = 13 or 12 biologically independent mice. b Representative periodic acid-Schiff (PAS) staining of the kidneys at day 2 after injury (left). Data are expressed as means ± SEM. ***P = 0.0007, by two-tailed unpaired Student’s t-test. n = 5 biologically independent mice. Scale bars, 50 μm. Tubular injury scores were analyzed (right). c Serum creatinine concentrations in AKI mice with or without Bex treatment at day 2. Data are expressed as means ± SEM and analyzed by two-tailed unpaired Student’s t-test. From left to right: ***P = 0.0003, ***P = 0.0001, **P = 0.0063, respectively. d BUN (blood urea nitrogen) concentrations in AKI mice with or without Bex treatment at day 30. Data are expressed as means ± SEM and analyzed by two-tailed unpaired Student’s t-test. From left to right: ****P < 0.0001, ****<0.0001, ***P = 0.0009, respectively. e qRT-PCR analysis of Fn1 and Col3a1 expression. Data are expressed as means ± SEM and analyzed by two-tailed unpaired Student’s t-test. From left to right for Fn: NS P = 0.4304, **P = 0.002, ***P = 0.0004, respectively. From left to right for Col3a1: NS P = 0.08, ****P < 0.0001, ***P = 0.0006, respectively. NS not significant. f Masson’s trichrome (MTS) staining of kidneys after Bex treatment (upper). Immunofluorescence staining of α-SMA in the kidneys of Bex-treated AKI mouse kidneys (lower). Data are expressed as means ± SEM and analyzed by two-tailed unpaired Student’s t-test. From left to right for MTS: **P = 0.0011, ****P < 0.0001, ***P = 0.0003, respectively. From left to right for α-SMA: **P < 0.0041, ****P < 0.0001, **P = 0.0012, respectively. Scale bars, 50 μm. n = 4 or 5 biologically independent mice for Sham group (cf). n = 5 biologically independent mice for SI and SI + Bex groups (cf). Source data are provided as a Source Data file.
Fig. 7
Fig. 7. Activation of RXRα reprograms chromatin states and gene expression.
a Occupancy of RXRα on MI-DARs/RXRαbound regions in TECs treated with Bex. b ATAC-seq signals on MI-DARs/RXRαbound regions in TECs treated with Bex. c Pearson’s correlation coefficients of RXRα ChIP-seq signals and ATAC-seq signals on MI-DARs/RXRαbound regions in TECs treated with Bex. Statistical significance was determined by the Correlation test. P < 2.2 ×  10−16. d Gene expression levels of RXRα-activated renoprotective genes in TECs treated with Bex. The color intensities indicate the Z-score of each gene. e Transcript expression levels of SLC markers. f Representative IGV tracks showing RXRα ChIP-seq, ATAC-seq, and RNA-seq signals in TECs treated with Bex. The signal strengths are denoted by color intensities (a, b). Source data are provided as a Source Data file.
Fig. 8
Fig. 8. RXRα expression is inversely correlated with kidney disease severity in AKI mice and patients.
a Bubble plot of RXRα expression levels from AKI mice and patients. The color intensities indicate average expression. The diameter of the dot corresponds to the proportion of cells expressing RXRα. Avg. expr. average expression, Pct. expr. percent expressing. b Violin plot showing the expression level of RXRα-activated renoprotective genes from Sham and AKI mice. Box plots represent median values, 25%, and 75% quantiles. Whiskers extend to 1.5 times the interquartile range. n = 29619 cells (Healthy), n = 12241 cells (MI), n = 1938 cells (SI). c Violin plot showing the expression levels of RXRα-activated renoprotective genes from normal and AKI patients. Box plots represent median values, 25%, and 75% quantiles. Whiskers extend to 1.5 times the interquartile range. n = 14083 cells (Healthy), n = 2195 cells (MI), n = 1766 cells (SI). d, e Heatmaps depicting relative expression of the highly variable anion transport (left) and monocarboxylic acid metabolic (right) genes along the mouse (d) and human (e) PTC injury trajectory. Heatmap colors represent gene-wise normalized expression across pseudotime. The color bars under the pseudotime are used to separate PTC subclusters. f Immunohistochemistry staining of RXRα in kidney tissues from normal and AKI patients (left). Scale bars, 50 μm. Quantification of RXRα expression (right). Data are represented as means ± SEM. From left to right: ***P = 0.0001, NS P = 0.4894, ****P < 0.0001, respectively, by two-tailed unpaired Student’s t-test. n = 5 normal samples, n = 12 MI samples, n = 16 SI samples. Each dot indicates a biological replicate. g Quantification of RXRα expression in patients with different stages of AKI. Data are represented as means ± SEM and were analyzed by two-tailed unpaired Student’s t-test. **P = 0.0079. n = 7 for stage 1, n = 20 for stage 2/3. h Correlation between RXRα expression and kidney fuction. Serum creatinine (Scr) at biopsy (left), BUN at biopsy (middle), and Scr at peak (right) in AKI patients. Pearson’s correlation coefficients are displayed. Statistical significance was determined by cor.test. Source data are provided as a Source Data file.

Similar articles

Cited by

References

    1. Kellum JA, et al. Acute kidney injury. Nat. Rev. Dis. Prim. 2021;7:52. doi: 10.1038/s41572-021-00284-z. - DOI - PubMed
    1. Ronco C, Bellomo R, Kellum JA. Acute kidney injury. Lancet. 2019;394:1949–1964. doi: 10.1016/S0140-6736(19)32563-2. - DOI - PubMed
    1. Hoste EAJ, et al. Global epidemiology and outcomes of acute kidney injury. Nat. Rev. Nephrol. 2018;14:607–625. doi: 10.1038/s41581-018-0052-0. - DOI - PubMed
    1. James MT, Bhatt M, Pannu N, Tonelli M. Long-term outcomes of acute kidney injury and strategies for improved care. Nat. Rev. Nephrol. 2020;16:193–205. doi: 10.1038/s41581-019-0247-z. - DOI - PubMed
    1. Liu BC, Tang TT, Lv LL, Lan HY. Renal tubule injury: a driving force toward chronic kidney disease. Kidney Int. 2018;93:568–579. doi: 10.1016/j.kint.2017.09.033. - DOI - PubMed

Publication types