. 2022 Nov 29;8(1):128.
doi: 10.1038/s41421-022-00475-2.

Loss of function of CMPK2 causes mitochondria deficiency and brain calcification

Affiliations

Loss of function of CMPK2 causes mitochondria deficiency and brain calcification

Miao Zhao et al. Cell Discov. .

Abstract

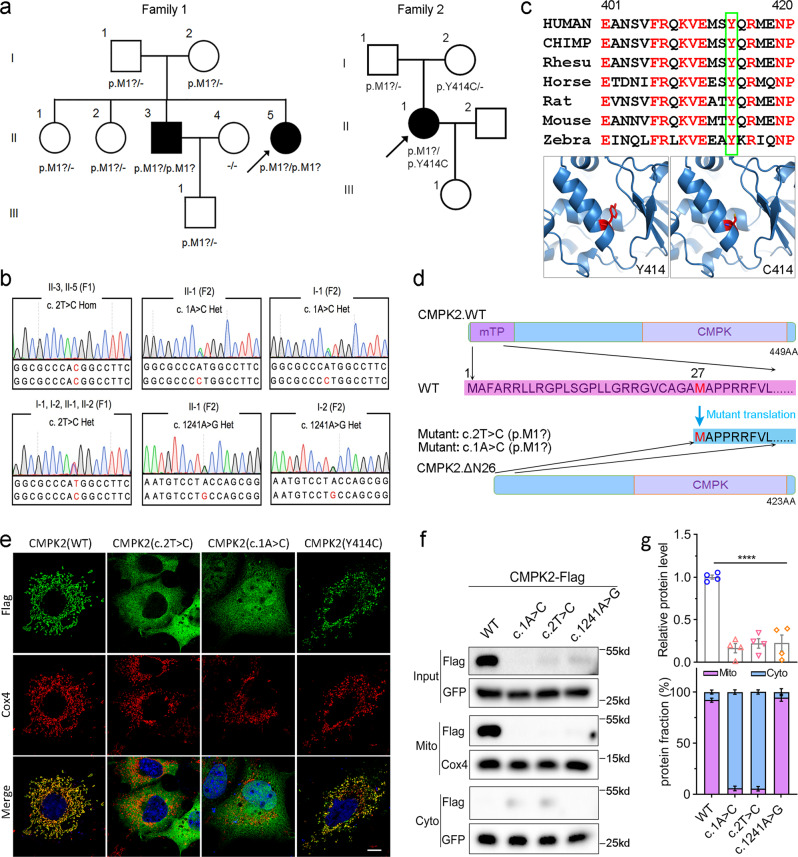
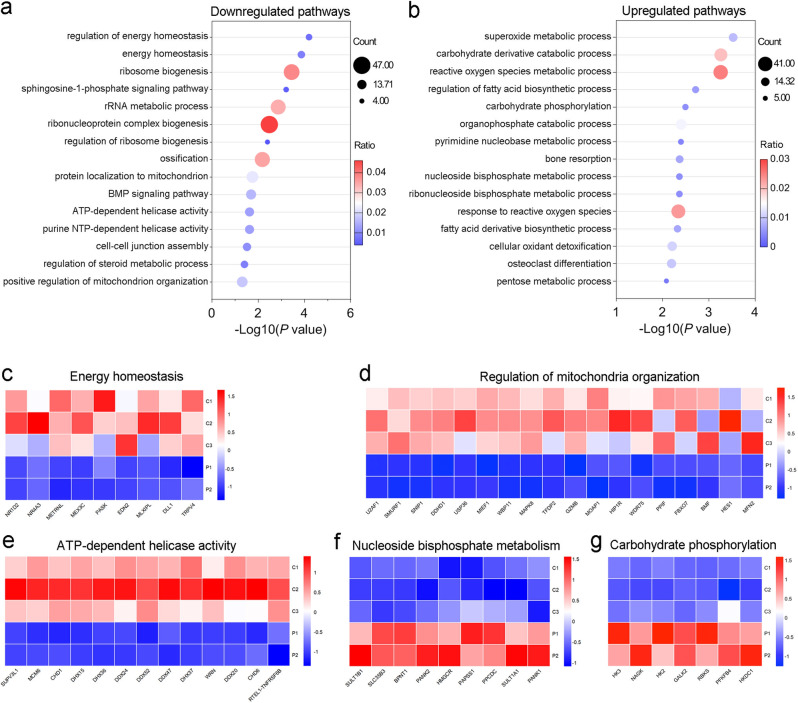
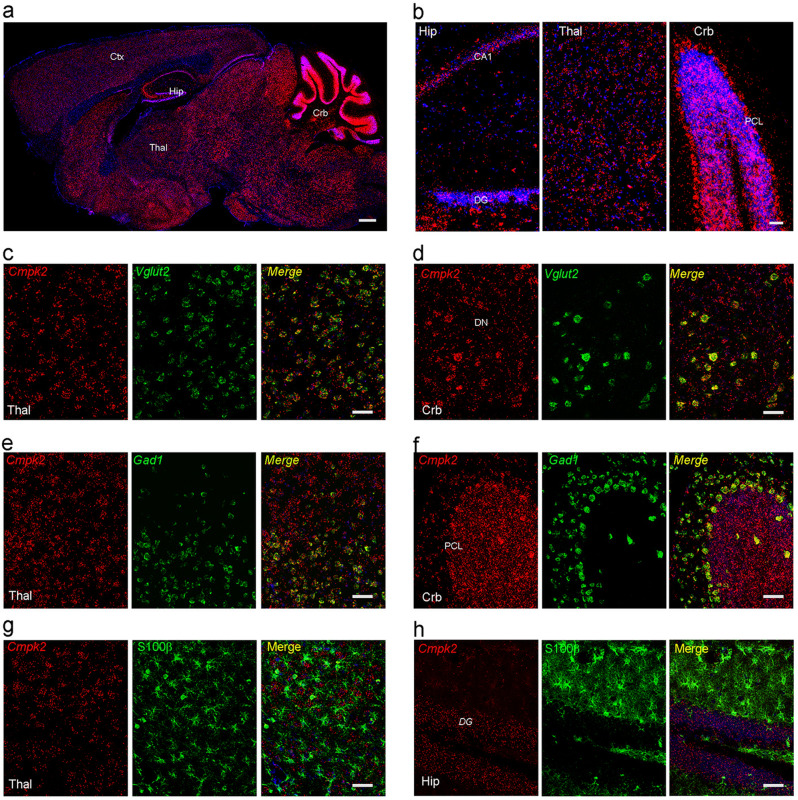
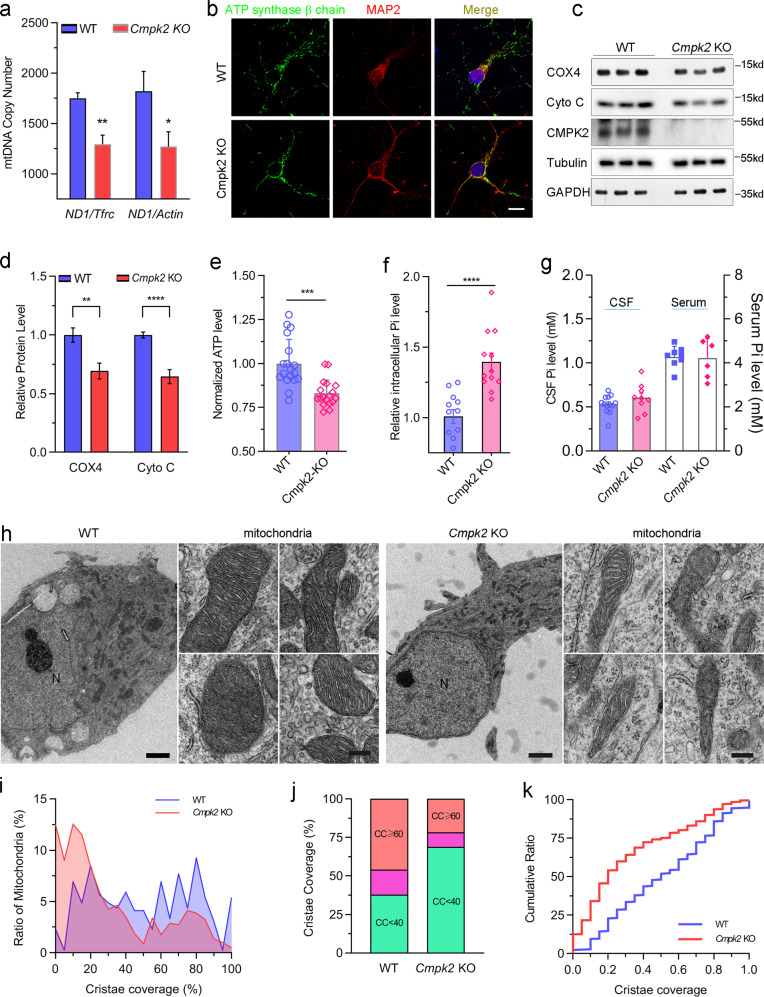
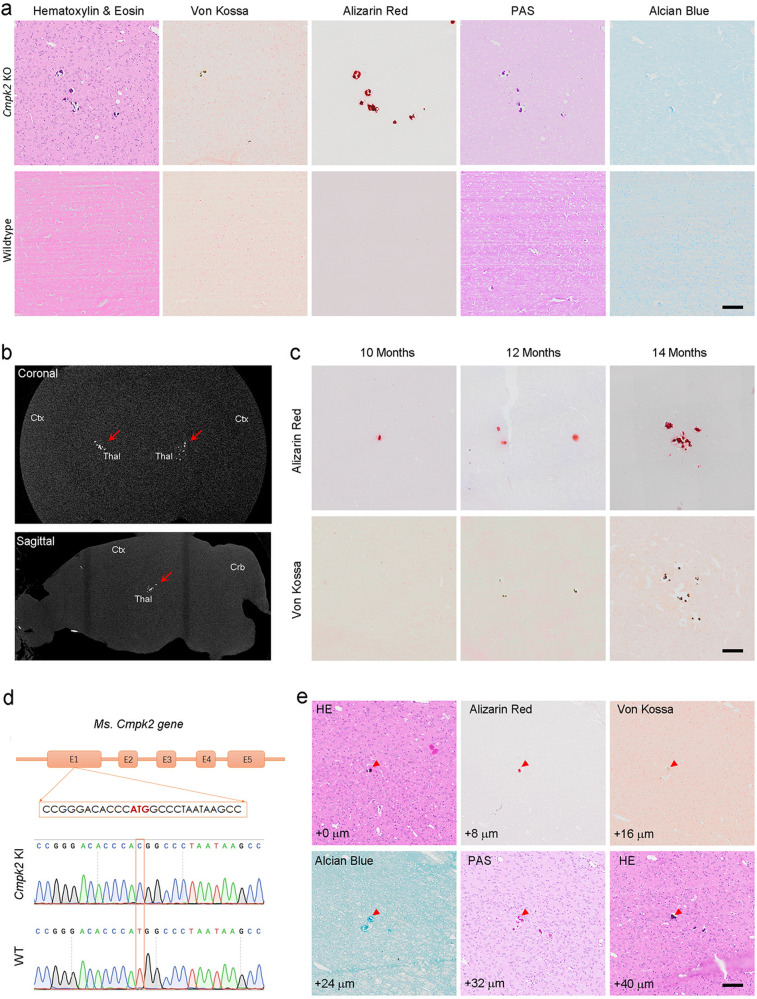
Brain calcification is a critical aging-associated pathology and can cause multifaceted neurological symptoms. Cerebral phosphate homeostasis dysregulation, blood-brain barrier defects, and immune dysregulation have been implicated as major pathological processes in familial brain calcification (FBC). Here, we analyzed two brain calcification families and identified calcification co-segregated biallelic variants in the CMPK2 gene that disrupt mitochondrial functions. Transcriptome analysis of peripheral blood mononuclear cells (PBMCs) isolated from these patients showed impaired mitochondria-associated metabolism pathways. In situ hybridization and single-cell RNA sequencing revealed robust Cmpk2 expression in neurons and vascular endothelial cells (vECs), two cell types with high energy expenditure in the brain. The neurons in Cmpk2-knockout (KO) mice have fewer mitochondrial DNA copies, down-regulated mitochondrial proteins, reduced ATP production, and elevated intracellular inorganic phosphate (Pi) level, recapitulating the mitochondrial dysfunction observed in the PBMCs isolated from the FBC patients. Morphologically, the cristae architecture of the Cmpk2-KO murine neurons was also impaired. Notably, calcification developed in a progressive manner in the homozygous Cmpk2-KO mice thalamus region as well as in the Cmpk2-knock-in mice bearing the patient mutation, thus phenocopying the calcification pathology observed in the patients. Together, our study identifies biallelic variants of CMPK2 as novel genetic factors for FBC; and demonstrates how CMPK2 deficiency alters mitochondrial structures and functions, thereby highlighting the mitochondria dysregulation as a critical pathogenic mechanism underlying brain calcification.


Conflict of interest statement

The authors declare no competing interests.

Figures

Fig. 1
Fig. 1. CMPK2 variants in FBC patients.
a The pedigrees of the brain calcification families (Family 1 and Family 2) with CMPK2 variants. Filled or empty symbols represent individuals with or without brain calcification. “+/−” indicates heterozygous variant carriers, “−/−” indicates individuals without this variant. The arrows represent the probands. b Sequencing chromatograms showing CMPK2 c.2 T > C in Family 1, and CMPK2 c.1 A > C and c.1241 A > G in Family 2, with the reference allele below. The variants are marked in red. het heterozygous, hom homozygous. c Homologous alignment of the CMPK2 protein sequence bearing the core domain α7b helix that includes p.Y414, and the protein conformation change of Y414C. d A schematic diagram of the initiation codon loss of CMPK2. CMPK2 (c.1 A > C p.M1?; c.2 T > C, p.M1?) mRNA transcription could perhaps be re-initiated from a subsequent ATG codon (p.M27), leading to loss of the mTP in the CMPK2 protein (△N26). mTP mitochondrial targeting peptide sequence, CMPK CMP-UMP kinase domain. e Immunofluorescence analysis of subcellular localization of the CMPK2 protein. Cos-7 cells were transfected with Flag-tagged CMPK2 wild-type (WT), c.1 A > C, c.2 T > C, and c.1241 A > G mutant plasmids, and immune-stained with antibodies against Flag (green) and the mitochondria marker COX IV (red). DAPI (blue) was used for nuclear staining. Scale bar, 5 μm. f Western blot analysis for the mitochondrial and cytoplastic expression of CMPK2. Primary cultured rat neurons were transfected with Flag-tagged CMPK2-WT, c.1 A > C, c.2 T > C, and c.1241 A > G plasmids. The CMPK2 protein quantitative statistics by Image J were displayed in g, ****P < 0.0001.
Fig. 2
Fig. 2. Transcriptome analysis of PBMCs.
a, b RNA-sequencing analysis of PBMCs from the FBC patients compared with three unaffected controls (C1–C3). The upregulated (a) and downregulated (b) GO pathways were displayed. ce Expression patterns of genes involved in representative downregulated pathways of PBMCs from patients and three unaffected controls, including energy homeostasis (c), regulation of mitochondria organization (d), and ATP-dependent helicase activity (e). f, g Expression patterns of genes involved in representative upregulated pathways of PBMCs from patients and three unaffected controls, including nucleoside bisphosphate metabolism (f) and carbohydrate phosphorylation (g).
Fig. 3
Fig. 3. Cmpk2 is expressed in mouse neurons.
a In situ hybridization of Cmpk2 expression in adult mouse brain sagittal sections. b Enlarged view of Cmpk2 expression in the hippocampus, thalamus, and cerebellum; DAPI (blue) staining of nuclei. c, d Dual in situ hybridization of Cmpk2 (red) with the glutamatergic neuronal marker Vglut2 (green) in the mouse thalamus (c) and dentate nuclei of the cerebellum (d). e, f Dual in situ hybridization of Cmpk2 (red) with the GABAergic neuronal marker Gad1 (green) in the mouse thalamus (e) and the PCL of the cerebellum (f). g, h Double fluorescence labeling of Cmpk2 (red) and the astrocytes marker S100β (green) in the thalamus (g) and DG of hippocampus (h). Ctx cortex, Hip hippocampus, Thal thalamus, Crb cerebellum, DG dentate gyrus, PCL Pukinje cell layer, GCL granule cell layer. Scale bars, 500 μm in a; 50 μm in bh.
Fig. 4
Fig. 4. Cmpk2 deficiency impairs mitochondrial function in mouse neurons.
a ddPCR-based analysis of mtDNA copy number between WT and Cmpk2-KO mouse cortex tissues. n = 7~8, three replicates. b Representative images of mitochondria in the primary cultured cortical neurons of WT and Cmpk2-KO mice with antibodies against the mitochondrial marker ATP synthase β chain (green) and the cytoskeleton protein MAP2 (red); DAPI (blue) was used for nuclear staining. Scale bar, 5 μm. c Western blot of COX IV and cytochrome C in the WT and Cmpk2-KO mouse primary cultured cortical neurons. d Quantification of the change in protein levels of COX IV and cytochrome C. n = 3, three replicates. e Measurement of ATP level of the WT and Cmpk2-KO mouse neurons. f, g The Pi level in the neuron (f), CSF and serum (g) in the WT and Cmpk2-KO mice. h Representative transmission electron micrograph of mitochondria morphology in the primary cultured cortical neurons of WT and Cmpk2-KO mice. ik Statistical graphs of cristae coverage ratio of primary cultured cortex neurons in WT and Cmpk2-KO mice. CC cristae coverage. Error bars indicate means ± SEM. ns not significant. *P < 0.05, **P < 0.01, ***P < 0.001, ****P < 0.0001; Student’s t-test. Scale bars, 2 μm in h, each left panel and 0.2 μm in h, each right panel.
Fig. 5
Fig. 5. The brains of Cmpk2-KO and -KI mice have extensive calcification deposits.
a Brain sections of 14-month-old WT and Cmpk2-KO mice were stained with H&E, Von Kossa, alizarin red, PAS, and Alcian blue. b Coronal and sagittal micro-CT scan of the brain of a Cmpk2-KO mouse at 13 months. Arrowheads indicate the high-density foci (these are calcification deposits). Ctx cortex, Crb cerebellum, Thal thalamus. c Progressive development of calcification deposits in the brains of Cmpk2-KO mice at 10, 12, and 14 months. Calcifications are indicated by alizarin red and Von Kossa staining. d A gene diagram for the Cmpk2-KI mouse model of the c.2 T > C mutation of the Cmpk2 gene. e Brain sections of 12-month-old Cmpk2-KI mice were stained with H&E, Von Kossa, alizarin red, PAS, and Alcian blue. The calcification volume is indicated at the left bottom of a series of continuous brain sections. Scale bar, 100 μm in a, c, and e.

Similar articles

Cited by

References

    1. Nicolas G, et al. Phenotypic spectrum of probable and genetically-confirmed idiopathic basal ganglia calcification. Brain. 2013;136:3395–3407. doi: 10.1093/brain/awt255. - DOI - PubMed
    1. Yamada M, et al. High frequency of calcification in basal ganglia on brain computed tomography images in Japanese older adults. Geriatr. Gerontol. Int. 2013;13:706–710. doi: 10.1111/ggi.12004. - DOI - PubMed
    1. Donzuso G, Mostile G, Nicoletti A, Zappia M. Basal ganglia calcifications (Fahr’s syndrome): related conditions and clinical features. Neurol. Sci. 2019;40:2251–2263. doi: 10.1007/s10072-019-03998-x. - DOI - PMC - PubMed
    1. Westenberger A, Balck A, Klein C. Primary familial brain calcifications: Genetic and clinical update. Curr. Opin. Neurol. 2019;32:571–578. doi: 10.1097/WCO.0000000000000712. - DOI - PubMed
    1. Kobayashi S, Yamadori I, Miki H, Ohmori M. Idiopathic nonarteriosclerotic cerebral calcification (Fahr’s disease): an electron microscopic study. Acta Neuropathol. 1987;73:62–66. doi: 10.1007/BF00695503. - DOI - PubMed