

Cordyceps cicadae and Cordyceps gunnii have closer species correlation with Cordyceps sinensis: from the perspective of metabonomic and MaxEnt models
- PMID: 36443322
- PMCID: PMC9705360
- DOI: 10.1038/s41598-022-24309-z
Cordyceps cicadae and Cordyceps gunnii have closer species correlation with Cordyceps sinensis: from the perspective of metabonomic and MaxEnt models
Abstract
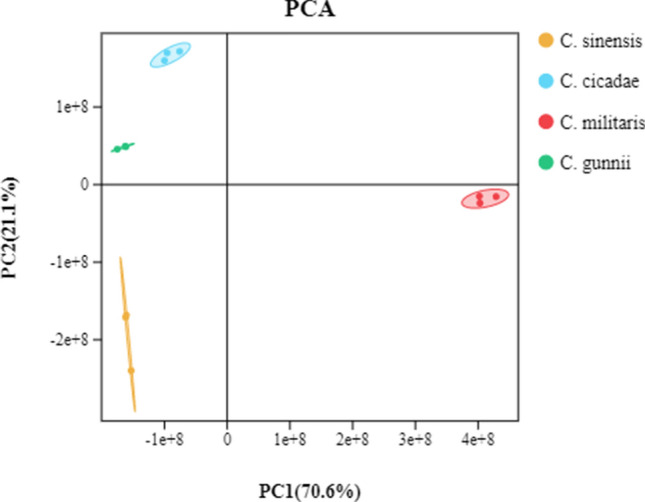
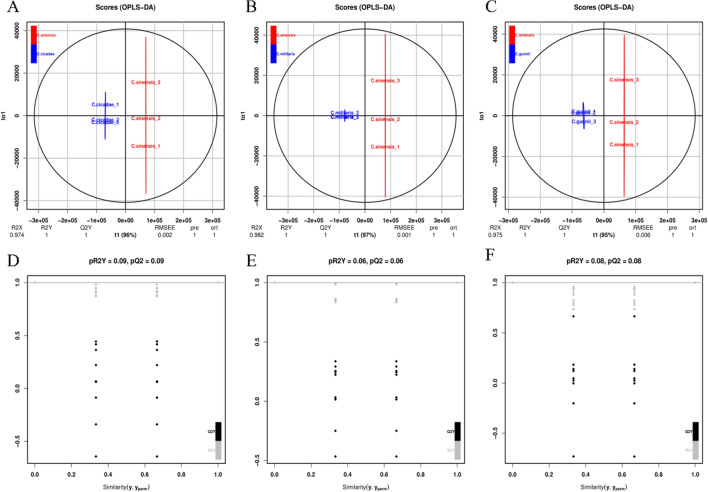
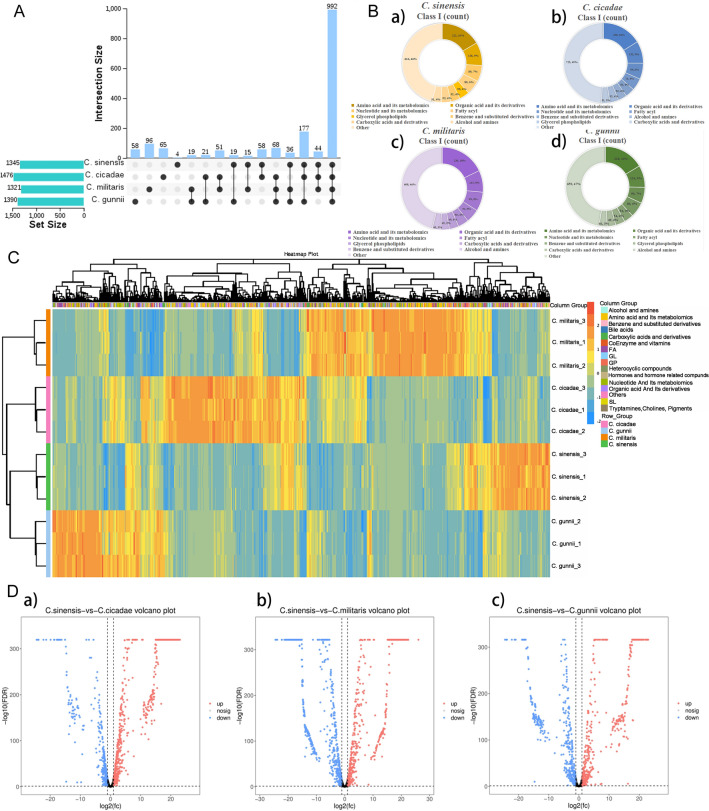
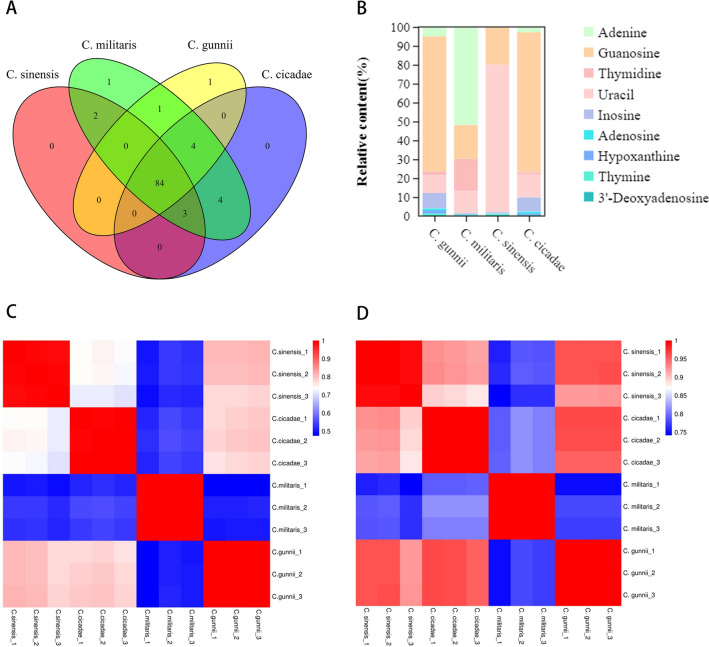
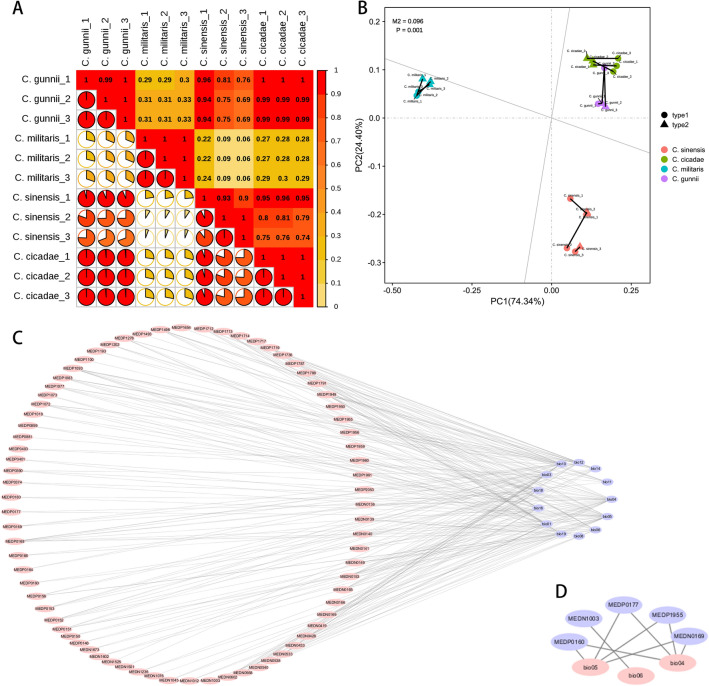
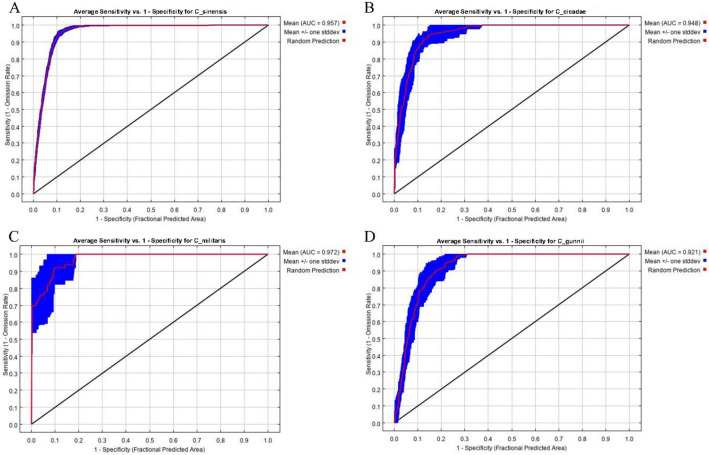
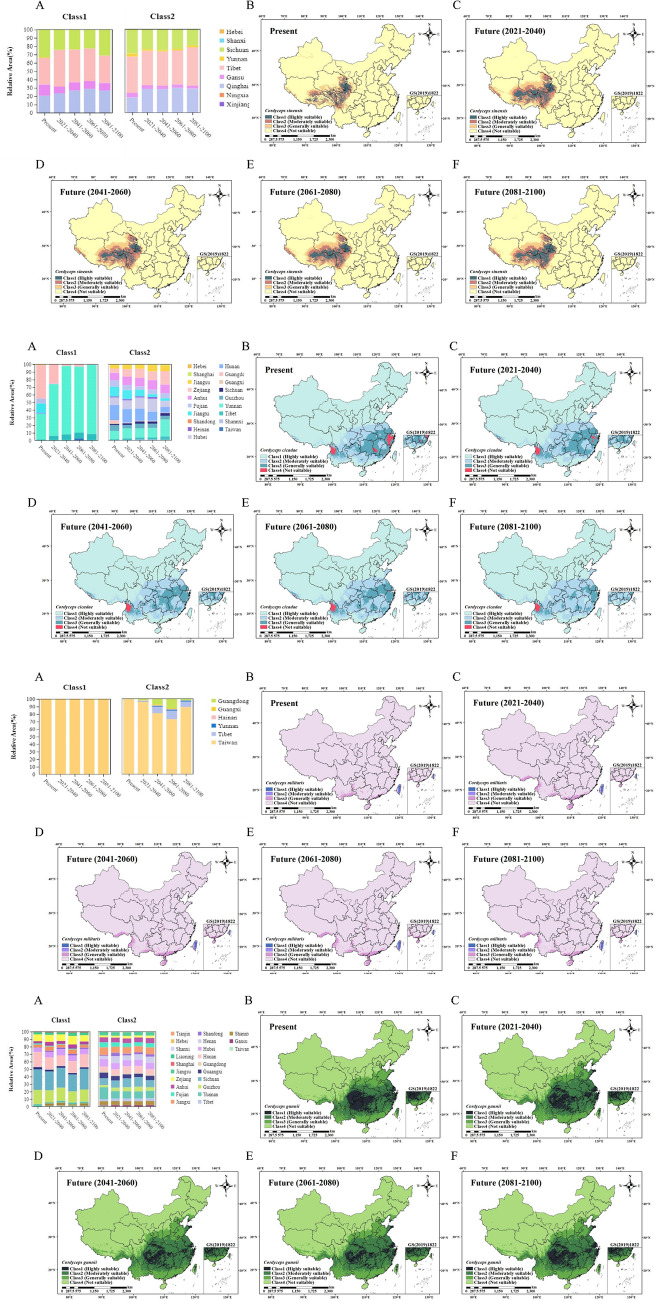
Cordyceps sinensis is a second-class nationally-protected medicinal fungus and functional food. Cordyceps sinensis resources are endangered, and finding new medicinal materials is a fast and economical way to meet the current demonstrated demand, which can effectively solve the shortage of C. sinensis resources. In this study, the metabolite characteristics of Cordyceps were comprehensively revealed by LC-QTOF-MS technology. The maxent model can be used to predict the habitat suitability distribution of Cordyceps and screen out the main climatic factors affecting its distribution. The correlation model between climate factors and chemical components was established by Pearson correlation analysis. Finally, based on the analysis of climate factors and metabolites, we will analyze the high correlation species with C. sinensis, and develop them as possible alternative species of C. sinensis in the future. The results showed that the suitable area of Cordyceps cicadae demonstrated a downward trend, while that of C. sinensis, Cordyceps militaris and Cordyceps gunnii demonstrated an upwards trend. The suitable areas all shifted to the northwest. The temperature seasonality and max temperature of the warmest month are the maximum climatic factors affecting nucleosides. Compared with C. sinensis, the metabolic spectrum similarities of C. cicadae, C. militaris, and C. gunnii were 94.42%, 80.82%, and 91.00%, respectively. Cordyceps sinensis, C. cicadae, and C. gunnii were correlated well for compounds and climate factors. This study will explore whether C. cicadae, C. militaris and C. gunnii can be used as substitutes for C. sinensis. Our results may provide a reference for resource conservation and sustainable utilization of endangered C. sinensis.
© 2022. The Author(s).
Conflict of interest statement
The authors declare no competing interests.
Figures

Similar articles
-
Can Cordyceps cicadae be used as an alternative to Cordyceps militaris and Cordyceps sinensis? - A review.J Ethnopharmacol. 2020 Jul 15;257:112879. doi: 10.1016/j.jep.2020.112879. Epub 2020 Apr 16. J Ethnopharmacol. 2020. PMID: 32305637 Review.
-
Comparison of metabolism substances in Cordyceps sinensis and Cordyceps militaris cultivated with tussah pupa based on LC-MS.J Food Biochem. 2021 Jun;45(6):e13735. doi: 10.1111/jfbc.13735. Epub 2021 Apr 22. J Food Biochem. 2021. PMID: 33890309
-
Characterization of Metabolite Landscape Distinguishes Medicinal Fungus Cordyceps sinensis and other Cordyceps by UHPLC-Q Exactive HF-X Untargeted Metabolomics.Molecules. 2023 Nov 24;28(23):7745. doi: 10.3390/molecules28237745. Molecules. 2023. PMID: 38067475 Free PMC article.
-
Determination and Quantitative Comparison of Nucleosides in two Cordyceps by HPLC-ESI-MS-MS.J Chromatogr Sci. 2019 May 1;57(5):426-433. doi: 10.1093/chromsci/bmz012. J Chromatogr Sci. 2019. PMID: 30796779
-
Conservation of Endangered Cordyceps sinensis Through Artificial Cultivation Strategies of C. militaris, an Alternate.Mol Biotechnol. 2025 Apr;67(4):1382-1397. doi: 10.1007/s12033-024-01154-1. Epub 2024 Apr 24. Mol Biotechnol. 2025. PMID: 38658470 Review.
Cited by
-
Integrated transcriptomic and metabolomic analysis reveals stage-associated molecular profiles in Ophiocordyceps sinensis.BMC Genomics. 2025 Aug 20;26(1):763. doi: 10.1186/s12864-025-11869-3. BMC Genomics. 2025. PMID: 40836216 Free PMC article.
-
Impact of climate change on the distribution of Isaria cicadae Miquel in China: predictions based on the MaxEnt model.Front Microbiol. 2025 Feb 7;16:1509882. doi: 10.3389/fmicb.2025.1509882. eCollection 2025. Front Microbiol. 2025. PMID: 39990145 Free PMC article.
-
Metagenomic Analysis: Alterations of Soil Microbial Community and Function due to the Disturbance of Collecting Cordyceps sinensis.Int J Mol Sci. 2024 Oct 11;25(20):10961. doi: 10.3390/ijms252010961. Int J Mol Sci. 2024. PMID: 39456745 Free PMC article.
-
Integrated Amino Acid Profiling and 4D-DIA Proteomics Reveal Protein Quality Divergence and Metabolic Adaptation in Cordyceps Species.J Fungi (Basel). 2025 May 8;11(5):365. doi: 10.3390/jof11050365. J Fungi (Basel). 2025. PMID: 40422699 Free PMC article.
-
Evaluation of Cordyceps sinensis Quality in 15 Production Areas Using Metabolomics and the Membership Function Method.J Fungi (Basel). 2024 May 16;10(5):356. doi: 10.3390/jof10050356. J Fungi (Basel). 2024. PMID: 38786711 Free PMC article.
References
-
- Liu DM, Li JS, Li Y, Wang K, Yang RH, Yao YJ. Status of global macrofungal conservation based on red lists and suggestions for a comprehensive strategy in China. Acta Edulis Fungi. 2021;28:108–114.
-
- Yao YJ. Red list assessment of macrofungi in China. Biodivers. Sci. 2020;28:1–3. doi: 10.17520/biods.2019152. - DOI
-
- Li Y, Tang ZY, Yan YJ, Wang K, Cai L, He JS, Gu S, Yao YJ. Incorporating species distribution model into the red list assessment and conservation of macrofungi: A case study with Ophiocordyceps sinensis. Biol. Divers. 2020;28:99–106.
-
- Yang, Z.-L. Ophiocordyceps sinensis (amended version of 2020 assessment). The IUCN Red List of Threatened Species 2020:e.T58514773A179197748 (2020).
-
- Liang ZQ. Fungi of China. Science Press; 2007. pp. 1–190.
Publication types
MeSH terms
Supplementary concepts
LinkOut - more resources
Full Text Sources
