. 2022 Nov 28;13(1):7335.
doi: 10.1038/s41467-022-34990-3.

Targeting APLN/APJ restores blood-testis barrier and improves spermatogenesis in murine and human diabetic models

Affiliations

Targeting APLN/APJ restores blood-testis barrier and improves spermatogenesis in murine and human diabetic models

Ke Song et al. Nat Commun. .

Abstract

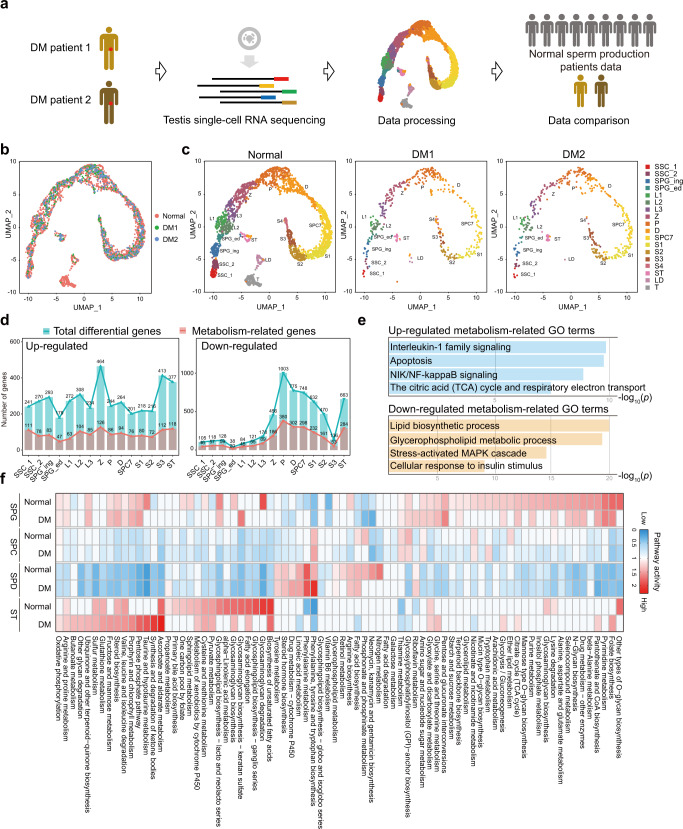
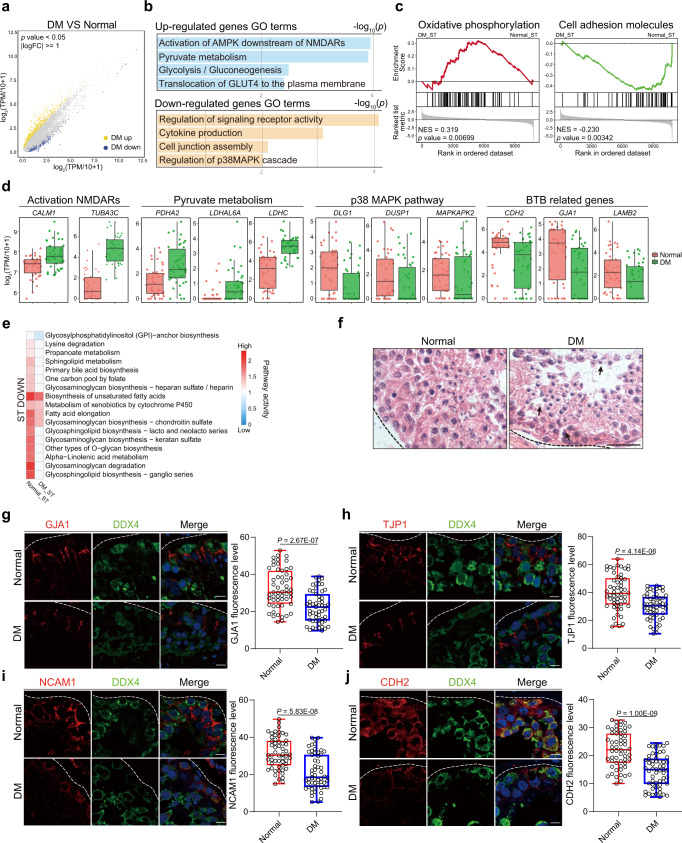
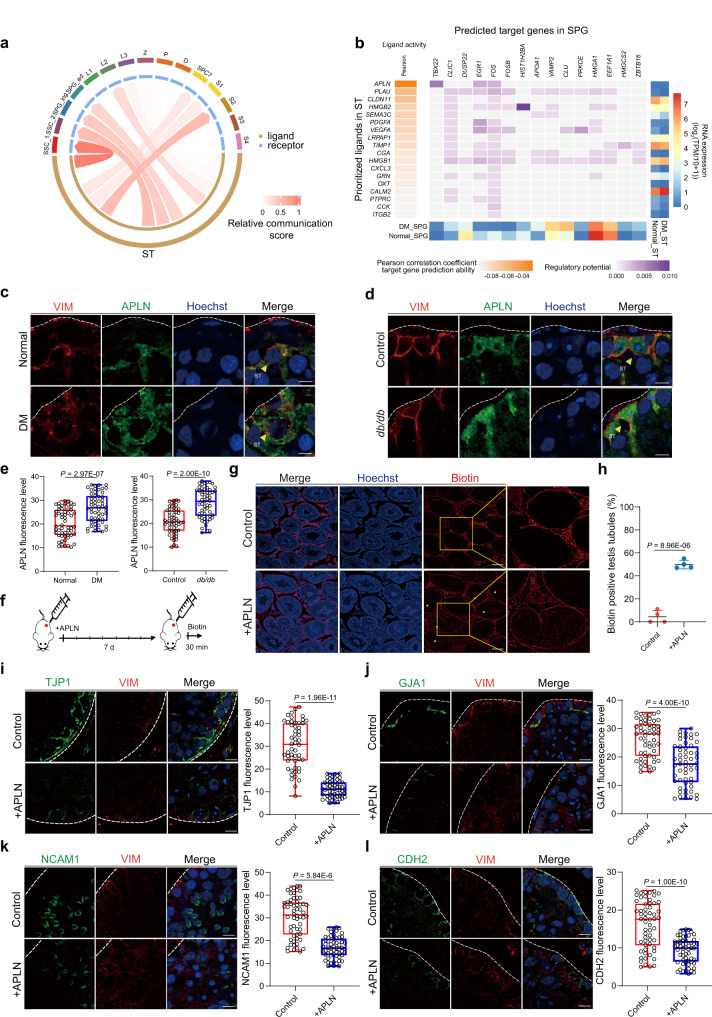
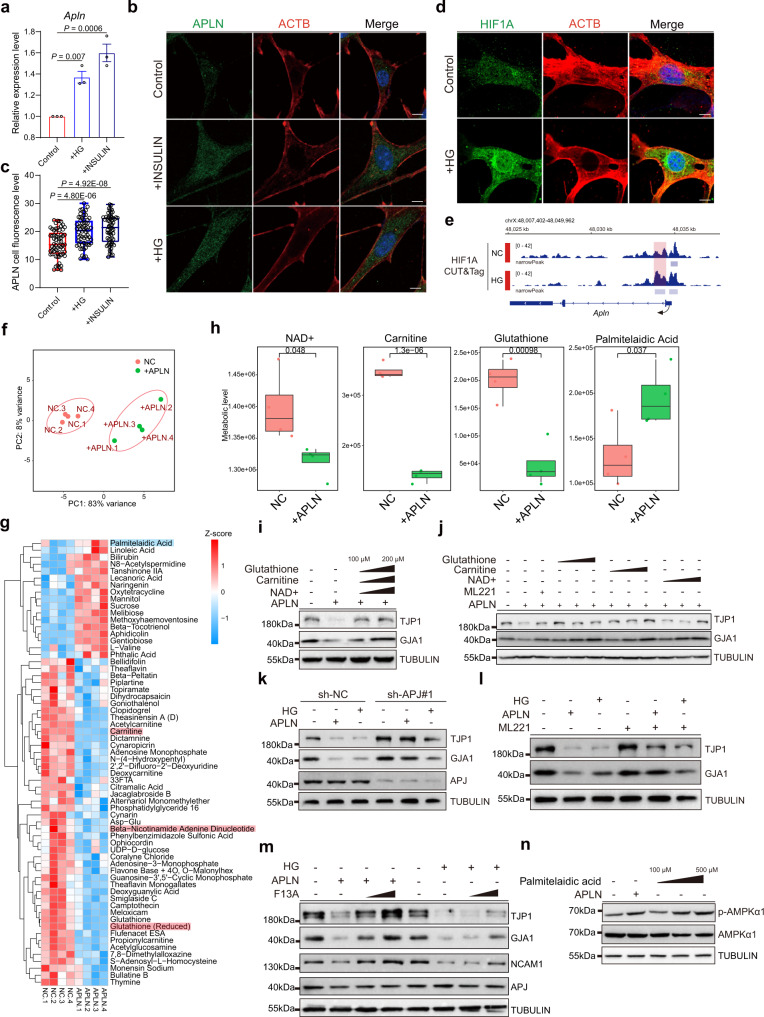
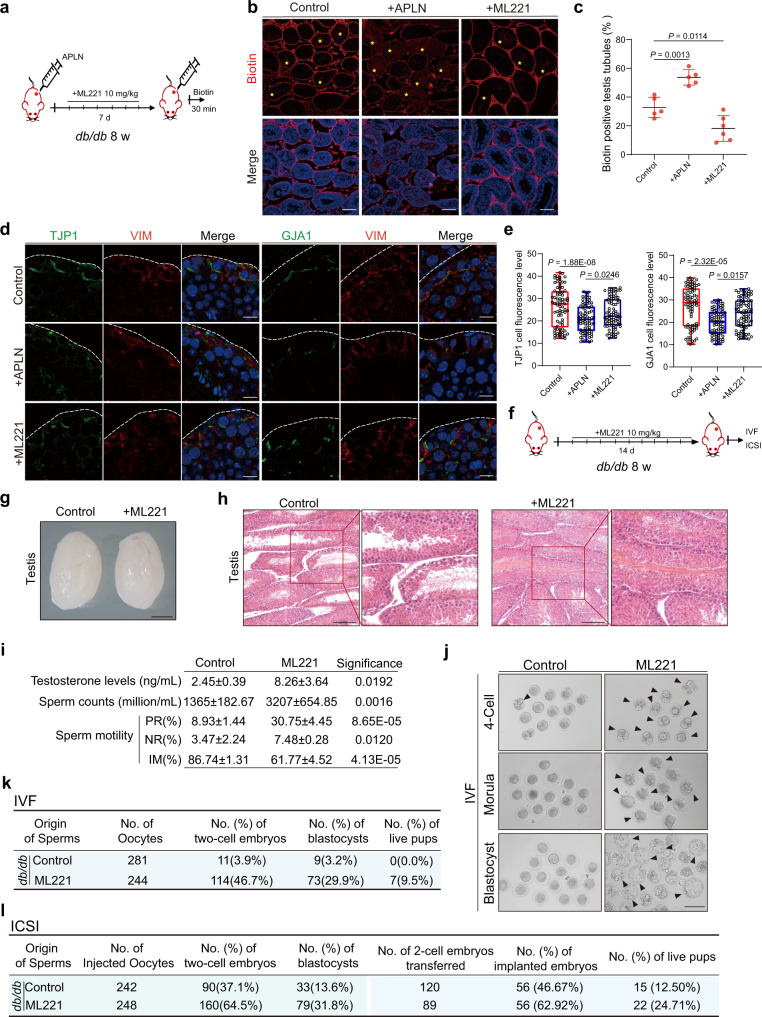
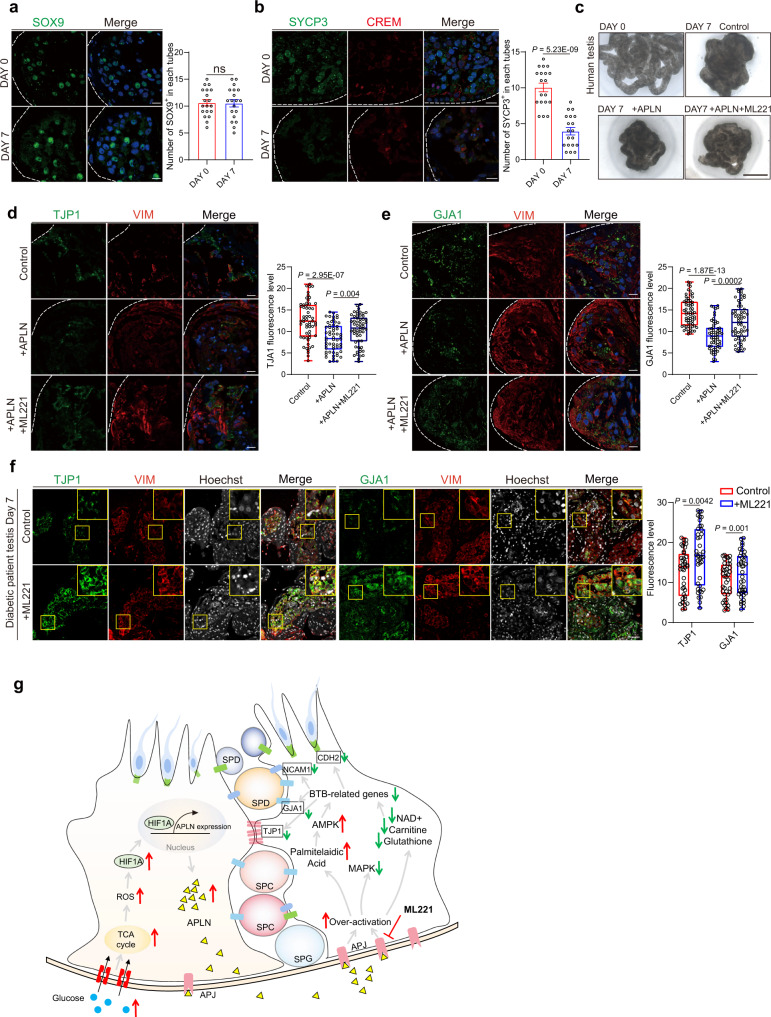
Type 2 diabetes mellitus is one of the most prevalent metabolic diseases presenting with systemic pathologies, including reproductive disorders in male diabetic patients. However, the molecular mechanisms that contributing to spermatogenesis dysfunction in diabetic patients have not yet been fully elucidated. Here, we perform STRT-seq to examine the transcriptome of diabetic patients' testes at single-cell resolution including all major cell types of the testis. Intriguingly, whereas spermatogenesis appears largely preserved, the gene expression profiles of Sertoli cells and the blood-testis barrier (BTB) structure are dramatically impaired. Among these deregulate pathways, the Apelin (APLN) peptide/Apelin-receptor (APJ) axis is hyper-activated in diabetic patients' testes. Mechanistically, APLN is produced locally by Sertoli cells upon high glucose treatment, which subsequently suppress the production of carnitine and repress the expression of cell adhesion genes in Sertoli cells. Together, these effects culminate in BTB structural dysfunction. Finally, using the small molecule APLN receptor antagonist, ML221, we show that blocking APLN/APJ significantly ameliorate the BTB damage and, importantly, improve functional spermatogenesis in diabetic db/db mice. We also translate and validate these findings in cultured human testes. Our findings identify the APLN/APJ axis as a promising therapeutic target to improve reproduction capacity in male diabetic patients.


Conflict of interest statement

The authors declare no competing interests.

Figures

Fig. 1
Fig. 1. Single-cell transcriptome atlas of the human testis in health and T2DM.
a Schematic illustration of the experimental and analysis workflow. b UMAP and clustering analysis of single-cell transcriptome data from normal spermatogenesis human testis (n = 2810), integrated with single-cell transcriptome data of two Type 2 diabetes mellitus (T2DM)’ testes (DM patient 1 (DM1), n = 441; DM patient 2 (DM2), n = 459). Each dot represents a single cell and is colored according to its donor of origin. c UMAP plots showing the cell colors by the identified cell clusters between normal and diabetic patients. d Histogram showing the number of (left) upregulated differential expression genes and (right) downregulated differential genes from the normal and diabetic patients single-cell RNA sequencing data. The blue histogram represented total differential genes, and the red represented metabolic genes. e Enriched GO terms in the upregulated and downregulated metabolism-related genes of testicular cells from diabetic versus normal. The statistical test is a hypergeometric test. f Metabolic pathway activities in the testicular cell types including spermatogonia (SPG), spermatocyte (SPC), spermatid (SPD), and Sertoli (ST) cells from the normal and diabetic single-cell RNA sequencing data.
Fig. 2
Fig. 2. Single-cell analysis of human diabetic testis suggests impaired cell junction in BTB.
a Scatter plot showing the DEGs in Sertoli cells between diabetic patients and normal spermatogenesis. b Enriched GO terms in the upregulated and downregulated genes of Sertoli cells from diabetic versus with normal control. The statistical test is a hypergeometric test. c GSEA analysis showing the upregulated and downregulated pathway activity in Sertoli cells. d Boxplots showing the expression levels of Activation NMDARS, Pyruvate metabolism, P38 MAPK pathway, BTB related genes (Normal = 43 cells, DM = 42 cells). Each box represents the median and the 25% and 75% quartiles, and the whiskers indicate 1.5 times of the interquartile range. e Heatmap showing the representative decreased metabolic pathway activity from the normal control and diabetic data in Sertoli cells. f H&E staining of adult human testicular paraffin sections from donors with normal control (left) and diabetic (right), arrow indicated vacuoles and free cells in seminiferous tubules. Scale bar, 20 μm. gj Immunofluorescence of GJA1, TJP1, NACM1 and CDH2 (red) co-stained with DDX4 (green) in normal and diabetic patients’ testicular paraffin sections. n = 3 testis samples per group. Representative immunofluorescence images and quantitative analysis of GJA1, TJP1, NACM1 and CDH2. Scale bar, 10 μm. Representative immunofluorescence images and quantitative analysis of CDH2. Scale bar, 10 μm. Fluorescence intensity values of more than 50 positive cells in at least 5 fields of view were counted in normal and diabetic patients’ testicular paraffin sections. Two-tailed student’s t test was performed. Box-and-whisker plots denote the maximum (top whisker), 75th (top edge of box), 25th (bottom edge of box), and minimum (bottom whisker) percentiles, and the median (line in box).
Fig. 3
Fig. 3. Excess APLN induces BTB dysfunction.
a Chord diagram showing the relationship and strength of the regulatory network between Sertoli cells and germ cells. b Heatmap showing the relationship between ligands expressed by Sertoli cells and potential target genes in spermatogonia (SPG) cells. A gradient of gray, orange indicates low to high Pearson correlation coefficient target gene prediction ability. And, a gradient of gray, purple indicates low to high ligand-target regulatory potential. The expression of the corresponding ligands and target genes are displayed on the right and below in the form of heatmaps. c Immunofluorescence of VIM (red) co-stained with APLN (green) in normal and diabetic patients’ testicular paraffin sections. Scale bar, 10 μm. The yellow arrow indicates the Sertoli cells. d Immunofluorescence of VIM (red) co-stained with APLN (green) in control and db/db testicular paraffin sections. Scale bar, 10 μm. The yellow arrow indicates the Sertoli cells. e Quantitative analysis of APLN. Box-and-whisker plots denote the maximum (top whisker), 75th (top edge of box), 25th (bottom edge of box) and minimum (bottom whisker) percentiles, and the median (line in box). n = 3 testis samples per group. Two-tailed student’s t test was performed. f Schematic illustration of the APLN testicular injection experiment in C57BL/6N. g Biotin tracer was injected in the C57BL/6N interstitium of the testicular tissue. Cy3-conjugated streptavidin was used to detect the presence of biotin in the adluminal compartment in control and APLN injection mouse testicular paraffin sections. Scale bar, 50 μm. h Biotin positive seminiferous tubules percentage in control and APLN injection group. Data are presented as means ± SEM. Unpaired two-tailed t test. Statistics were performed in four mouse testes each group (n = 4). il Immunofluorescence of VIM (red) co-stained with TJP1, GJA1, NCAM1, and CDH2 (green) in control and APLN injection mouse testicular paraffin sections. n = 3 biologically independent mice per group. Representative immunofluorescence images and quantitative analysis of TJP1, GJA1, NCAM1, and CDH2. Scale bar, 10 μm. Two-tailed student’s t test was performed. Box-and-whisker plots denote the maximum (top whisker), 75th (top edge of box), 25th (bottom edge of box) and minimum (bottom whisker) percentiles, and the median (line in box).
Fig. 4
Fig. 4. High glucose-associated APLN upregulation impairs metabolic homeostasis in TM4 Sertoli cell.
a The expression level of Apln mRNA in TM4 cell under high glucose (HG) and insulin. Data are presented as means ± SEM. Unpaired two-tailed t test. Results of three independent experiments are shown (n = 3). b Immunofluorescence of ACTB (red) co-stained with APLN (green) in TM4 cell under HG and insulin. Scale bar, 5 μm. c Quantitative analysis of APLN immunofluorescence level in (b). Box-and-whisker plots denote the maximum (top whisker), 75th (top edge of box), 25th (bottom edge of box) and minimum (bottom whisker) percentiles, and the median (line in box). Unpaired two-tailed t test. n = 100 cells examined over 3 independent experiments. d Immunofluorescence of ACTB (red) co-stained with HIF1A (green) in TM4 cell under HG. Scale bar, 5 μm. e Genome browser view of the HIF1A density in the Apln range in negative control (NC) and HG treated TM4 cell. f PCA analysis of metabolomic data in NC and APLN group. Four biological replicates were performed for each group. g Heatmap showing all differential metabolites in NC and APLN group. h The metabolic level of NAD+, carnitine and glutathione and Palmitelaidic Acid in NC and APLN group. unpaired two-tailed t test between sample groups. n = 4 biologically independent samples. Each box represents the median and the 25 and 75% quartiles, and the whiskers indicate 1.5 times of the interquartile range. i, Immunoblots of TJP1 and GJA1 in TM4 treated APLN and by combination of three metabolites in different concentrations. j Immunoblots of TJP1 and GJA1 in TM4 treated APLN and three different concentrations (200, 500, 1000 μM) of each metabolites separately. k Immunoblots of indicated proteins in stable knockdown APJ cell treated APLN or HG. l Immunoblots of indicated proteins in TM4 treated APLN or HG and rescued by ML221. m Immunoblots of indicated proteins in TM4 treated APLN or HG and rescued by F13A. n Immunoblots of AMPKα1 and p-AMPKα1 in TM4 treated APLN or different concentrations of Palmitelaidic Acid.
Fig. 5
Fig. 5. Targeting APLN/APJ repairs BTB damage and improves sperm quality in diabetic mice.
a Schematic illustration of the APLN or ML221 injection experiment in db/db. b Immunofluorescence of biotin (red) between indicated sample groups. Scale bar, 50 μm. c Biotin positive seminiferous tubules percentage in Control, APLN and ML221 injection group. Data are presented as means ± SEM. One-way ANOVA. Statistics were performed in five mouse testes each group (n = 5). d Immunofluorescence of TJP1 and GJA1 (green) co-stained with VIM (red) in APLN injection and ML221 injection testicular paraffin sections. Scale bar, 10 μm. e Quantitative analysis of TJP1 and GJA1. Box-and-whisker plots denote the maximum (top whisker), 75th (top edge of box), 25th (bottom edge of box) and minimum (bottom whisker) percentiles, and the median (line in box). Statistics were performed in five mouse testes each group (n = 5). One-way ANOVA was performed. f Schematic illustration of the ML221 injection experiment in db/db for IVF and ICSI. Mice were treated with ML221 at a dose of 10 mg per kg body weight per day. g Bright field diagram of testicular size in control and ML221 injection group. Scale bar, 2 mm. h H&E staining of testicular sections in control and ML221 injection group. Scale bar, 100 μm. i Sperm counts, sperm motility and testosterone level between control and ML221 injection group. PR: progressive motile, NP: non-progressive motile, IM: immotility. unpaired two-tailed t test was performed. j Brightfield diagram of 4-cell, morula, and blastocyst between control and ML221 injection group. Arrows indicated normal developing embryos. Scale bar, 200 μm. k The trilinear table shows all the embryo injection, two-cell embryos, blastocysts and live C-section-born mice data of IVF between control and ML221 injection group. l The trilinear table shows all the embryo injection, two-cell embryos, blastocysts and live C-section-born mice data of ICSI between control and ML221 injection group.
Fig. 6
Fig. 6. Inhibition APLN improves cell junction protein expression in human cultured testis.
a Immunofluorescence of SOX9 (red) in human testis culture in Day 0 and Day 7 paraffin sections. Scale bar, 20 μm. The percentage of SOX9-positive cells was calculted on Day 0 and Day 7 separately. Mean ± SEM. ns, not significant, unpaired two-tailed t test. n = 3 human testis culture examined over 3 independent experiments. b Immunofluorescence of SYCP3 (green) and CREM (red) in human testis culture on Day 0 and Day 7 paraffin sections. Scale bar, 20 μm. The percentage of SYCP3-positive cells was counted. Mean ± SEM. Unpaired two-tailed t test. n = 3 human testis culture examined over 3 independent experiments. c Bright field diagram of human testis culture between different groups. Scale bar, 50 mm. d, e Immunofluorescence of TJP1 and GJA1 (green) and VIM (red) in human testis culture in Day 7 paraffin sections between indicated sample groups. n = 3 per group. Scale bar, 20 μm. Box-and-whisker plots denote the maximum (top whisker), 75th (top edge of box), 25th (bottom edge of box), and minimum (bottom whisker) percentiles, and the median (line in box). Quantitative analysis of TJP1. Two-tailed student’s t test was performed. f Immunofluorescence of TJP1 or GJA1 (green) and VIM (red) in diabetic patient testis culture in Day 7 paraffin sections between indicated sample groups. Scale bar, 50 μm. n = 3 per group. Box-and-whisker plots denote the maximum (top whisker), 75th (top edge of box), 25th (bottom edge of box) and minimum (bottom whisker) percentiles, and the median (line in box). Quantitative analysis of TJP1 and GJA1. Two-tailed student’s t test was performed. g Hypothetical Mechanism. Elevated blood glucose in diabetic patients directly leads to elevated ROS in Sertoli cells, which promotes HIF1A nuclear translocation and activates Apln expression. The excess of APLN disrupted the BTB-related genes by decreasing NAD+, carnitine, and glutathione. Blocking APLN/APJ with F13A and ML221 could significantly ameliorate the BTB damage and improve low sperm quality.

References

    1. Alberti KG, Zimmet PZ. Definition, diagnosis and classification of diabetes mellitus and its complications. Part 1: diagnosis and classification of diabetes mellitus provisional report of a WHO consultation. Diabet. Med. 1998;15:539–553. doi: 10.1002/(SICI)1096-9136(199807)15:7<539::AID-DIA668>3.0.CO;2-S. - DOI - PubMed
    1. Saeedi P, et al. Global and regional diabetes prevalence estimates for 2019 and projections for 2030 and 2045: Results from the International Diabetes Federation Diabetes Atlas, 9(th) edition. Diabetes Res. Clin. Pr. 2019;157:107843. doi: 10.1016/j.diabres.2019.107843. - DOI - PubMed
    1. Heng LZ, et al. Diabetic retinopathy: pathogenesis, clinical grading, management, and future developments. Diabet. Med. 2013;30:640–650. doi: 10.1111/dme.12089. - DOI - PubMed
    1. Navarro-Gonzalez JF, Mora-Fernandez C, Muros DFM, Garcia-Perez J. Inflammatory molecules and pathways in the pathogenesis of diabetic nephropathy. Nat. Rev. Nephrol. 2011;7:327–340. doi: 10.1038/nrneph.2011.51. - DOI - PubMed
    1. Shi GJ, et al. Diabetes associated with male reproductive system damages: Onset of presentation, pathophysiological mechanisms and drug intervention. Biomed. Pharmacother. 2017;90:562–574. doi: 10.1016/j.biopha.2017.03.074. - DOI - PubMed

Publication types