. 2022 Nov 28;13(1):7329.
doi: 10.1038/s41467-022-35041-7.

Gene activation guided by nascent RNA-bound transcription factors

Affiliations

Gene activation guided by nascent RNA-bound transcription factors

Ying Liang et al. Nat Commun. .

Abstract

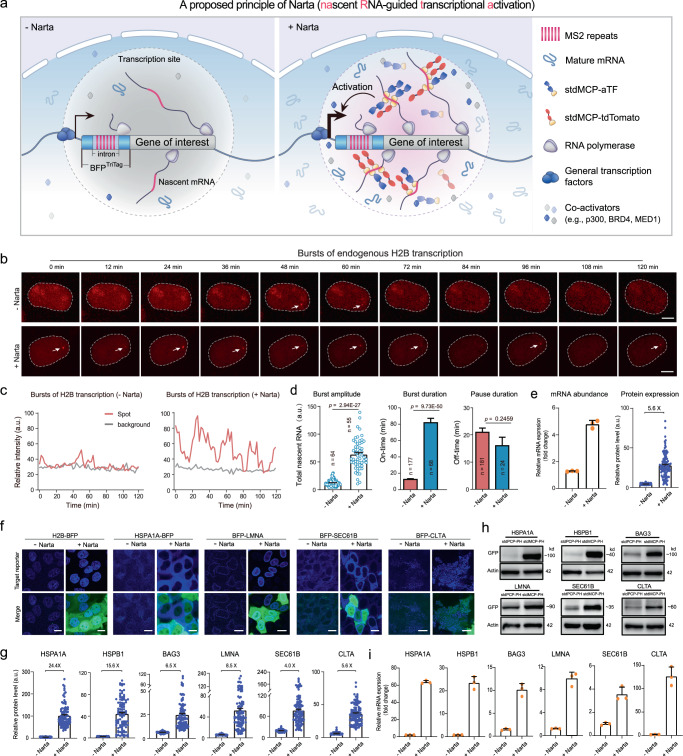
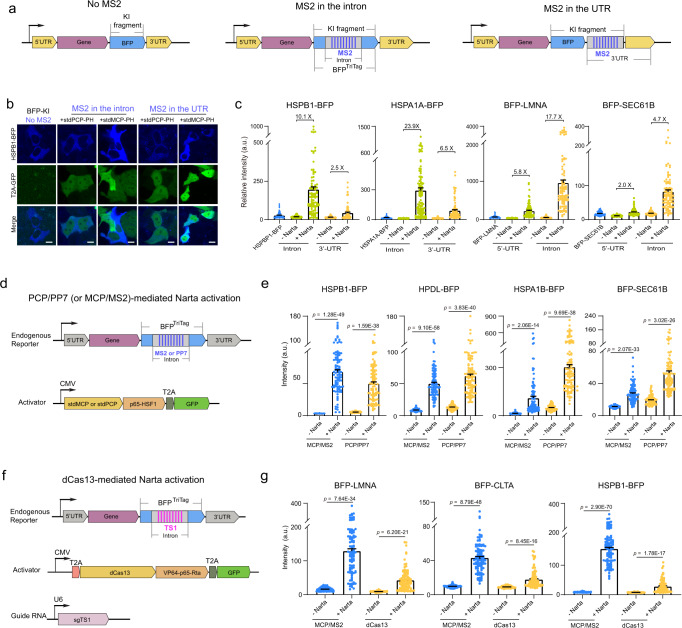
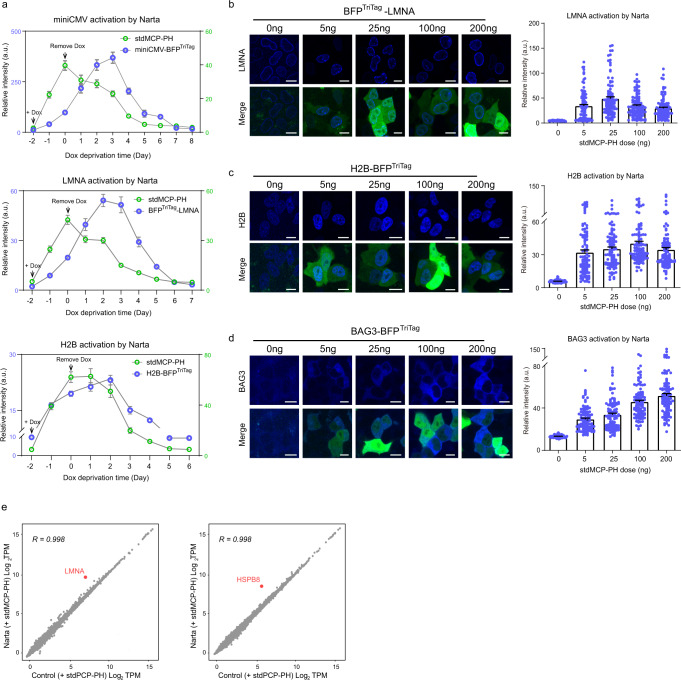
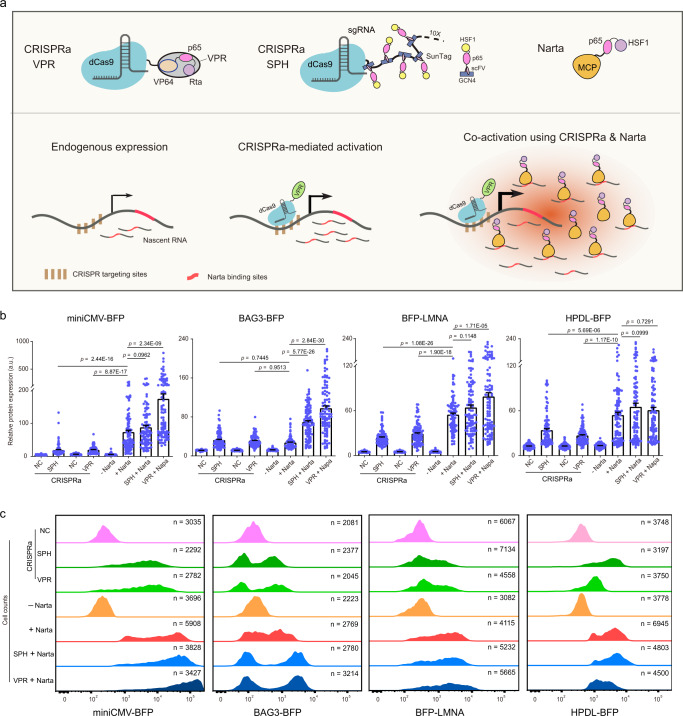
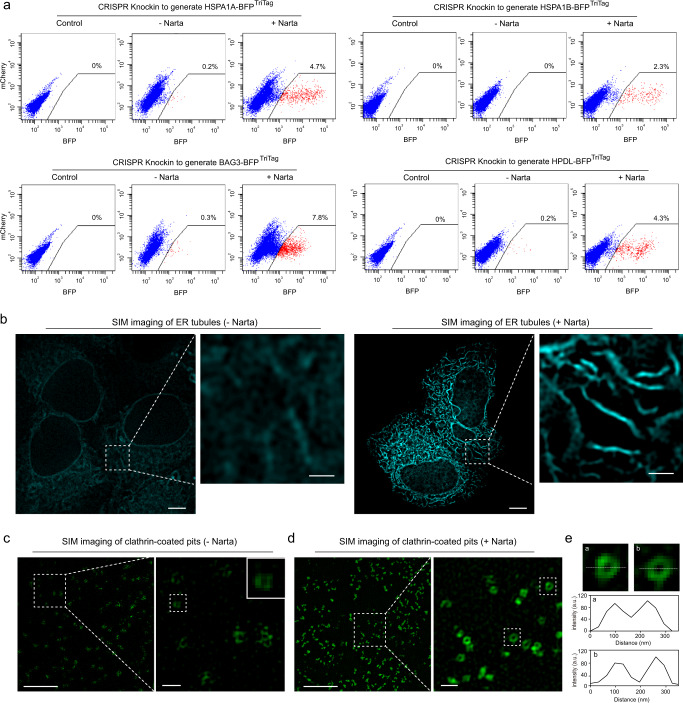
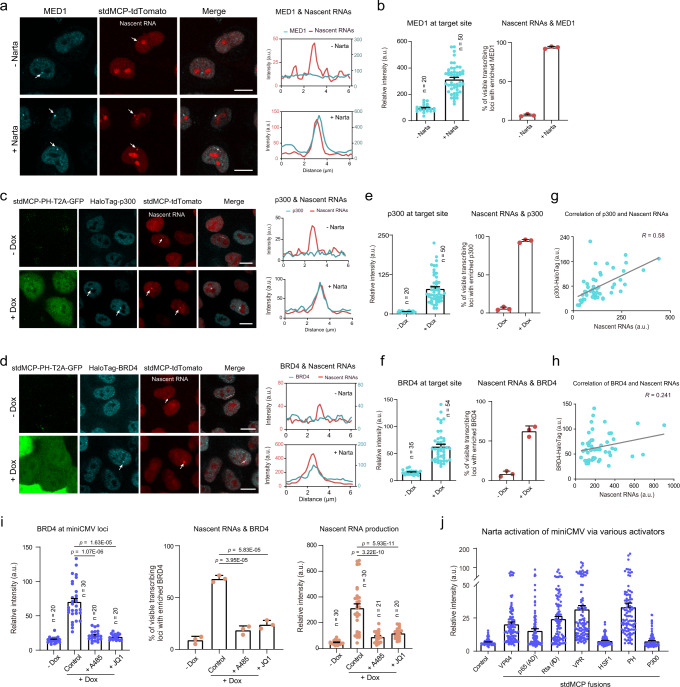
Technologies for gene activation are valuable tools for the study of gene functions and have a wide range of potential applications in bioengineering and medicine. In contrast to existing methods based on recruiting transcriptional modulators via DNA-binding proteins, we developed a strategy termed Narta (nascent RNA-guided transcriptional activation) to achieve gene activation by recruiting artificial transcription factors (aTFs) to transcription sites through nascent RNAs of the target gene. Using Narta, we demonstrate robust activation of a broad range of exogenous and endogenous genes in various cell types, including zebrafish embryos, mouse and human cells. Importantly, the activation is reversible, tunable and specific. Moreover, Narta provides better activation potency of some expressed genes than CRISPRa and, when used in combination with CRISPRa, has an enhancing effect on gene activation. Quantitative imaging illustrated that nascent RNA-directed aTFs could induce the high-density assembly of coactivators at transcription sites, which may explain the larger transcriptional burst size induced by Narta. Overall, our work expands the gene activation toolbox for biomedical research.


Conflict of interest statement

Y.L., W.Z., and B.C. submitted a patent application (Chinese Patent Application No. 2022111029154) on the design and application of a nascent RNA-guided gene activation method based on the technology developed in this paper. All other authors declare no competing interests.

Figures

Fig. 1
Fig. 1. Narta activates endogenous genes.
a Schematic depicting recruitment of artificial transcription factors (aTFs) or fluorescent reporters to nascent mRNAs by the MS2/MCP system. b Snapshots of representative HeLa cells showing the transcriptional bursting dynamics of H2B loci revealed by stdMCP-tdTomato without (top) or with (bottom) Narta activation. Scale bar, 5 μm. c Representative traces (red) of nascent transcripts produced at H2B loci from the cells in b. Gray traces illustrate the background signal in the nuclei. d Quantitative analysis of the burst amplitude (left), burst durations (middle) and pause durations (right) to show the bursting characteristics of H2B transcription. Burst amplitude is defined by the total intensity of individual stdMCP-tdTomato spots. P values were calculated by two-tailed Student’s t test. e Quantifications of H2B-BFP transcription by qRT-PCR (n = 3 biological repeats) and protein expression (n = 100 cells) by fluorescent imaging. f Representative images to show the activation of endogenous reporters by Narta. GFP indicates the successful transfection of stdMCP-PH. Scale bar, 10 μm. g Quantifications of protein expression level based on fluorescent imaging in f. Each dot represents a cell. n = 100 cells. h Measurement of target protein abundance by Western blotting. Endogenous genes were tagged with GFPTriTag and thus their expression was detected by GFP antibody. stdMCP-PH vectors were transfected to induce Narta activation, while stdPCP-PH transfection serves as the negative control. Actin was detected as an internal reference. The experiment was repeated two times with similar results. i qRT-PCR analysis of the mRNA expression level of various endogenous genes without or with Narta activation, n = 3 biological replicates. Data in Fig. 1 are all shown as mean ± s.e.m. Source data are provided as a Source Data file.
Fig. 2
Fig. 2. Factors that contribute to Narta efficiency.
a Schematic diagram of different knockin fragments and two different MS2 positions (in the intron or UTR region). b Representative images to show HSPB1 expression under various conditions, including different BFP tagging strategies illustrated in a. Scale bar, 10 μm. c Quantifications of protein expression based on fluorescent imaging under different conditions as shown in a. Each dot represents a single cell. n = 90 cells. d Schematic of the components to mediate Narta activation by PCP/PP7 or MCP/MS2. e Quantitative analysis of the protein expression level of endogenous reporters based on fluorescent imaging. Each dot represents a cell. n = 100 cells. f Schematic construction designs for testing dCas13-mediated Narta activation. g Performance of dCas13-mediated Narta activation as measured by quantitative imaging of endogenous reporters. Each dot represents a single cell. n = 100 cells. Data in c, e, g are shown as mean ± s.e.m. P values were calculated by two-tailed Student’s t-test. Source data are provided as a Source Data file.
Fig. 3
Fig. 3. Narta-mediated gene activation is reversible, tunable and specific.
a Green curves showing the expression level of stdMCP-PH-T2A-GFP controlled by the doxycycline-inducible system at indicated time points. The time to add or remove Dox was indicated by arrows (Day −2 and Day 0, respectively). The blue curves illustrate the protein expression level of exogenous (miniCMV) or endogenous (LMNA and H2B) reporters that were related to the expression of stdMCP-PH-T2A-GFP. The protein expression level was quantified based on fluorescent imaging. Each circle represents the mean intensity of the fluorescent reporter of 100 cells at each time point. Error bar denotes mean ± s.e.m. b–d Representative images (left) and quantifications (right) to show the does-dependent effect of stdMCP-PH on Narta activation of three endogenous reporters. Each dot represents a cell. n = 100 cells. Scale bar, 10 μm. Data are shown as mean ± s.e.m. e Plots to show gene expression levels (log2TPM) in reporter cells (Left: BFPTriTag-LMNA; right: HSPB8-BFPTriTag) transfected with stdPCP-PH (x axis) versus expression in cells transfected with stdMCP-PH (y axis). Mean values of TMP in two replicates were calculated and log2 transformed to show the expression level of each gene. R indicates Pearson’s correlation coefficient, calculated for long-transformed values on all genes except the target gene. Target gene mRNAs are marked in red dots, which are the most significant differentially expressed genes (t-test q value < 0.05 with FDR correction). Source data are provided as a Source Data file.
Fig. 4
Fig. 4. Comparison and combinatory use of CRISPRa and Narta.
a Schematic of different activators and the potential enhancing effect on gene activation between CRISPRa and Narta. b Quantifications of protein expression level based on fluorescent imaging under various conditions, including negative controls and gene activation mediated by CRISPRa, Narta or combinatorial use of both. sgGal4 was used as the negative control of CRISPRa systems, while sdPCP-PH (T2A-GFP) was transfected serving as the negative control of Narta activation. Each dot represents a single cell. n = 100 cells. Data is shown as mean ± s.e.m. P values were determined by One-way ANOVA with Tukey’s post hoc. c Flow cytometry quantification of target protein expression levels under the same conditions as in b. Transfection-positive cells were gated based on internal reporters (GFP or HaloTag). The distribution of these cells was plotted based on the fluorescence intensity of BFP fused to the target gene (y axis). x axis is the number of cell counts. Source data are provided as a Source Data file.
Fig. 5
Fig. 5. Applications of Narta in fluorescence-based cell sorting and super-resolution imaging.
a HeLa cells were co-transfected with TriTagBFP knock-in plasmids (including donor, Cas9 and sgRNA) and stdMCP-PH (+Narta) or stdPCP-PH (− Narta). The control group was transfected with sgGal4 instead of sgRNAs targeting genes of interest. Successfully edited cells were selected by FACS and plotted based on the intensity of BFP fluorescence. b SIM imaging of ER tubules labeled by SEC61B-GFPTriTag with or without Narta activation. Scale bar, 5 μm. The boxed regions are further displayed in zoomed-in views with 1 μm scale bar. c, d SIM imaging of clathrin-coated pits labeled by CLTA-GFPTriTag with or without Narta activation. Scale bar of the large field images is 5 μm. The region in the white box is further displayed in a zoomed-in view with 500 nm scale bar. Magnified view of a representative donut-shaped clathrin-coated vesicle from c is shown. e Magnified view of two representative donut-shaped clathrin-coated vesicles from d, left. Line scan of the relative fluorescence of CLTA-GFPTriTag is generated to show the size of clathrin-coated vesicles.
Fig. 6
Fig. 6. Narta can induce high-density assembly of coactivators at target sites.
a, c, d Left, representative images to show the co-localization between coactivators (MED1, p300, or BRD4) and nascent RNAs (labeled by stdMCP-tdTomato) produced by miniCMV. Right, line scan of the relative fluorescence intensity indicated by the dotted lines in the left panel. In a stdMCP-PH was transfected to induce Narta activation, while stdPCP-PH tranfection was used as the negative control. In d, f the expression of stdMCP-PH was induced by the addition of Dox. MED1 was detected by antibody, while p300 and BRD4 were endogenously tagged with HaloTag. Scale bar, 10 μm. b, e, f, Left, total intensity of activator reporters (MED1-Alex647, HaloTag-p300 and HaloTag-BRD4, respectively) enriched at visible miniCMV transcribing loci. Right, quantifications showing the percentage of visible stdMCP-stdTomato spots (representing active mimiCMV loci) which were co-localized with enriched signal of coactivators (MED1, p300 or BRD4). n = 3 biological replicates. g, h Scatter plots of nascent RNA level (x-axis) and the enriched signal of co-activator (p300 or BRD4, y-axis). Gray line denotes the linear fit. R represents the correlation coefficient. Each dot represents a single cell. n = 50 cells. i Quantifications of BRD4-HaloTag signal (right), nascent RNA production (total intensity of individual stdMCP-tdTomato foci, left), and the co-localization between nascent RNA and BRD4 (n = 3 independent experiments by examining 30 cells in each repeat) at active miniCMV loci under different conditions. Dox was added to induce Narta activation for 12 h. Together with Dox, DMSO, A-485 or JQ1 was added into the medium. P-value was analyzed by One-way ANOVA with Tukey’s post hoc. j Quantifications of miniCMV-BFPTriTag expression levels in cells transfected with stdPCP-PH (negative control), stdMCP-p300 or different stdMCP-TFs (n = 100 cells). All histograms in Fig. 6 are displayed as mean ± s.e.m. Source data are provided as a Source Data file.

Similar articles

Cited by

References

    1. Levo M, Segal E. In pursuit of design principles of regulatory sequences. Nat. Rev. Genet. 2014;15:453–468. doi: 10.1038/nrg3684. - DOI - PubMed
    1. Ptashne M, Gann A. Transcriptional activation by recruitment. Nature. 1997;386:569–577. doi: 10.1038/386569a0. - DOI - PubMed
    1. Reiter F, Wienerroither S, Stark A. Combinatorial function of transcription factors and cofactors. Curr. Opin. Genet. Dev. 2017;43:73–81. doi: 10.1016/j.gde.2016.12.007. - DOI - PubMed
    1. Weirauch MT, et al. Determination and inference of eukaryotic transcription factor sequence specificity. Cell. 2014;158:1431–1443. doi: 10.1016/j.cell.2014.08.009. - DOI - PMC - PubMed
    1. Brent R, Ptashne M. A eukaryotic transcriptional activator bearing the DNA specificity of a prokaryotic repressor. Cell. 1985;43:729–736. doi: 10.1016/0092-8674(85)90246-6. - DOI - PubMed

Publication types