. 2022 Nov 28;12(1):20420.
doi: 10.1038/s41598-022-24350-y.

A minimal-complexity light-sheet microscope maps network activity in 3D neuronal systems

Affiliations

A minimal-complexity light-sheet microscope maps network activity in 3D neuronal systems

Paulina M Wysmolek et al. Sci Rep. .

Abstract

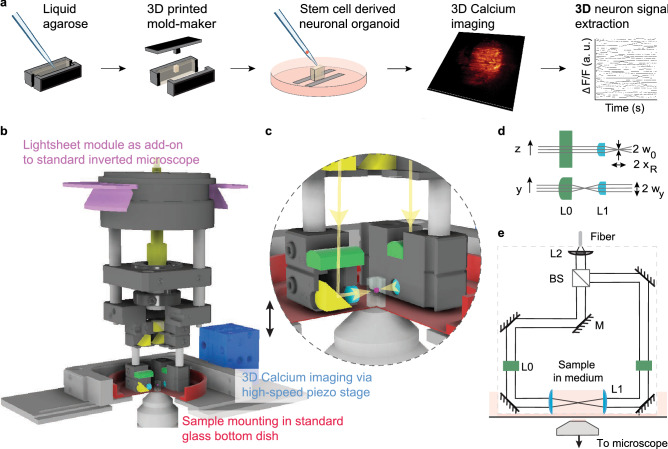
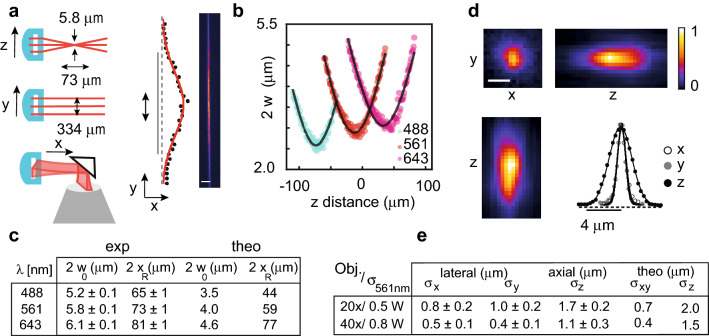
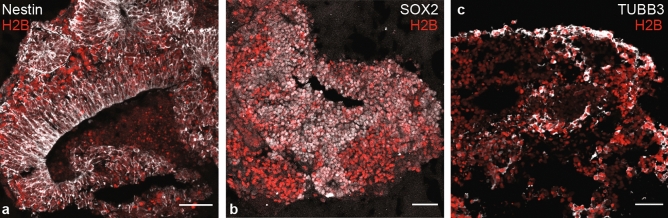
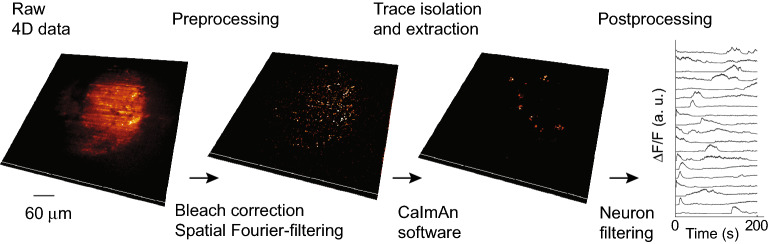
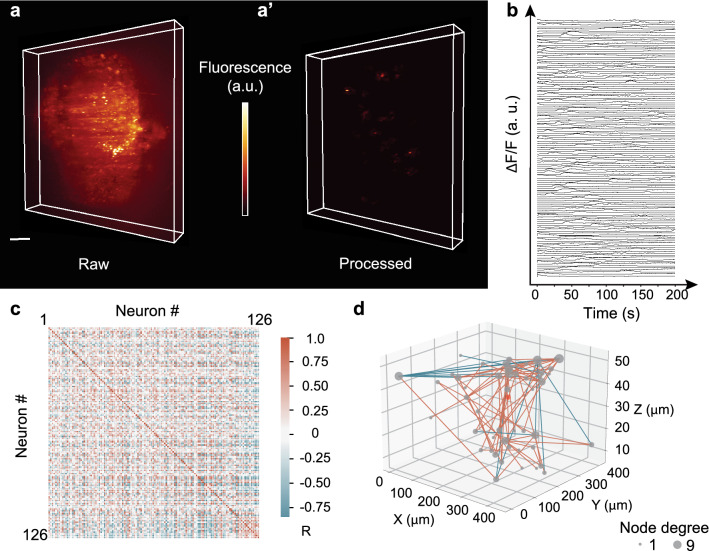
In vitro systems mimicking brain regions, brain organoids, are revolutionizing the neuroscience field. However, characterization of their electrical activity has remained a challenge as it requires readout at millisecond timescale in 3D at single-neuron resolution. While custom-built microscopes used with genetically encoded sensors are now opening this door, a full 3D characterization of organoid neural activity has not been performed yet, limited by the combined complexity of the optical and the biological system. Here, we introduce an accessible minimalistic light-sheet microscope to the neuroscience community. Designed as an add-on to a standard inverted microscope it can be assembled within one day. In contrast to existing simplistic setups, our platform is suited to record volumetric calcium traces. We successfully extracted 4D calcium traces at high temporal resolution by using a lightweight piezo stage to allow for 5 Hz volumetric scanning combined with a processing pipeline for true 3D neuronal trace segmentation. As a proof of principle, we created a 3D connectivity map of a stem cell derived neuron spheroid by imaging its activity. Our fast, low complexity setup empowers researchers to study the formation of neuronal networks in vitro for fundamental and neurodegeneration research.


Conflict of interest statement

The authors declare no competing interests.

Figures

Figure 1
Figure 1
A minimal complexity light-sheet microscope enables fast volumetric imaging of neuronal signals. (a) Workflow for the extraction of 3D neuron signals. Temporal segmentation of neuron traces becomes possible via a custom pre-processing pipeline in combination with recent 3D neuron analysis software. (b,c) The light-sheet module as an add-on to a standard inverted microscope. Volumetric imaging at single neuron resolution is achieved by movement of the sample along the optical axis using a high-speed piezo-stage (10 ms per plane or 5 volumes/s with 20 planes/volume). (d,e) Light-sheet optical path. The optical beam, delivered via a fiber, is split via a cube beam splitter and directed to the sample by right-angle prisms (M). A static planar light-sheet is created by focusing the beam via a cylindrical lens (L0) at the back focal plane of an aspherical lens (L1).
Figure 2
Figure 2
A simplistic light-sheet microscope with sub-cellular resolution. (ac) Characterization of the light-sheet parameters. (a) The light-sheet propagates along the x-axis as an elliptical Gaussian beam characterized by its thickness 2 w0, its Rayleigh length xR and its width 2 wy. The parameters were determined by imaging the transversal illumination profiles. (b). Parameters w0 and xR are quantified by fitting a hyperbolic function (black line) to the measurements w(z). The light-sheet thickness remains well below 10 microns, allowing optical sectioning of the sample. Multicolour imaging is possible as the Rayleigh length is comparable to the chromatic shift (c). (de) Quantification of the 3D resolution. The PSF was measured by imaging gel-embedded fluorescent beads. (e) Values displayed in the table are mean 1/e radius (σx,y,z) for profiles along the three axes with standard deviation measured for multiple beads for two objective lenses using the 561 nm laser. Scale bars: 25 μm (a), 1 μm (d). Number of measurements n = 6 (20x; c,e); n = 12 (40x,xy; e), n = 7 (40x,z;e).
Figure 3
Figure 3
Confocal microscopy images of cryo-sections of the stem cell derived neuron culture. The presence of Nestin (a) and SOX2 (b) within rosette-like structures are signatures for neural progenitors (SOX2) and neuroepithelial cells (Nestin), respectively. Both cell-specific markers are present in neurosphere cultures, as well as retinal neurospheres. (c) Class 3 ß-tubulin (TUBB3) binds microtubules in neurons and is also present in neurospheres,. Scale bar: 50 μm.
Figure 4
Figure 4
Processing pipeline to extract neuronal signals. To remove the fluorescent background in a first step, the sample is bleach-corrected and spatially filtered via a Fourier filter. Neuronal traces are extracted in 3D using CaImAn. In a final step, neurons are filtered by volume and the temporal traces are filtered according to their variance (see “ Methods” section).
Figure 5
Figure 5
Quantification of neuronal responses in 3D neuron cultures. (a) 3D lightsheet image of a single timepoint (R-GECO1.0 calcium sensor, raw data). (a’) Same image after the processing pipeline. Only active neurons remain in the observation volume. (b) Individually normalized calcium traces. The vertical offset serves display purposes. (c) A Spearman rank correlation matrix between any pair of active neurons was constructed using the raw fluorescence traces, ordered according to their distance from the centre of mass (COM). R represents the correlation coefficient value between each pair traces. (d) 3D functional connectivity map. Edges are coloured corresponding the R-value of the connection. Only strongest connections with |R|> 0.8 are kept. Nodes' s size is degree-coded. The red dot represents the COM. Color bar scaling (a.u.): 1584–3778 (a), 0.44–0.64 (a’). Scale bar: 50 μm (a).

Similar articles

Cited by

References

    1. Passaro AP, Stice SL. Electrophysiological analysis of brain organoids current approaches and advancements. Front. Neurosci. 2021;14:622137. doi: 10.3389/fnins.2020.622137. - DOI - PMC - PubMed
    1. O'Hara-Wright M, Gonzalez-Cordero A. Retinal organoids: a window into human retinal development. Development. 2020;147:189746. doi: 10.1242/dev.189746. - DOI - PMC - PubMed
    1. Giandomenico SL, et al. Cerebral organoids at the air–liquid interface generate diverse nerve tracts with functional output. Nat. Neurosci. 2019;22:669–679. doi: 10.1038/s41593-019-0350-2. - DOI - PMC - PubMed
    1. Sharf T, et al. Functional neuronal circuitry and oscillatory dynamics in human brain organoids. Nat. Commun. 2022;13:4403. doi: 10.1038/s41467-022-32115-4. - DOI - PMC - PubMed
    1. Gervois P, et al. Neurogenic maturation of human dental pulp stem cells following neurosphere generation induces morphological and electrophysiological characteristics of functional neurons. Stem Cells Dev. 2015;24:296–311. doi: 10.1089/scd.2014.0117. - DOI - PMC - PubMed

Publication types