. 2023 Jan;7(1):51-61.
doi: 10.1038/s41559-022-01934-5. Epub 2022 Nov 28.

Mapping the planet's critical natural assets

Affiliations

Mapping the planet's critical natural assets

Rebecca Chaplin-Kramer et al. Nat Ecol Evol. 2023 Jan.

Abstract

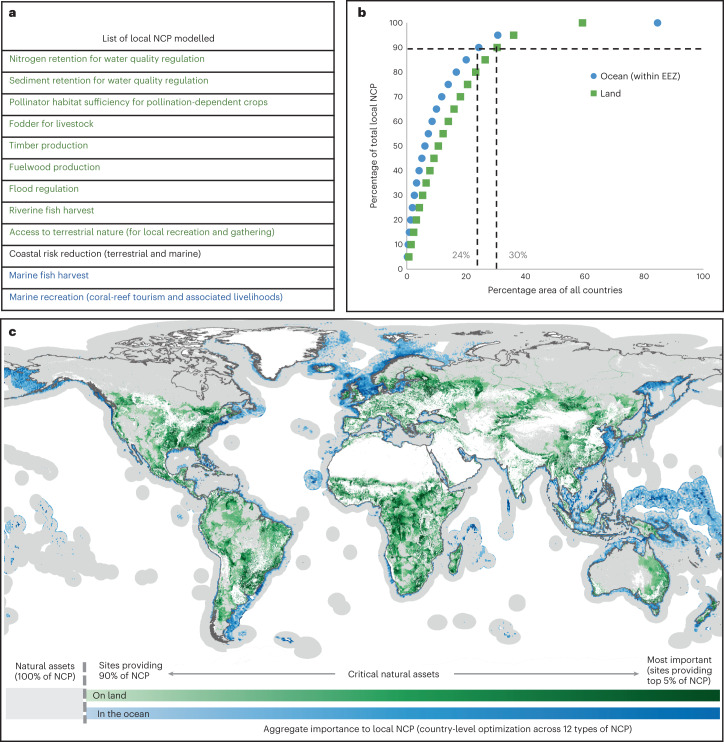
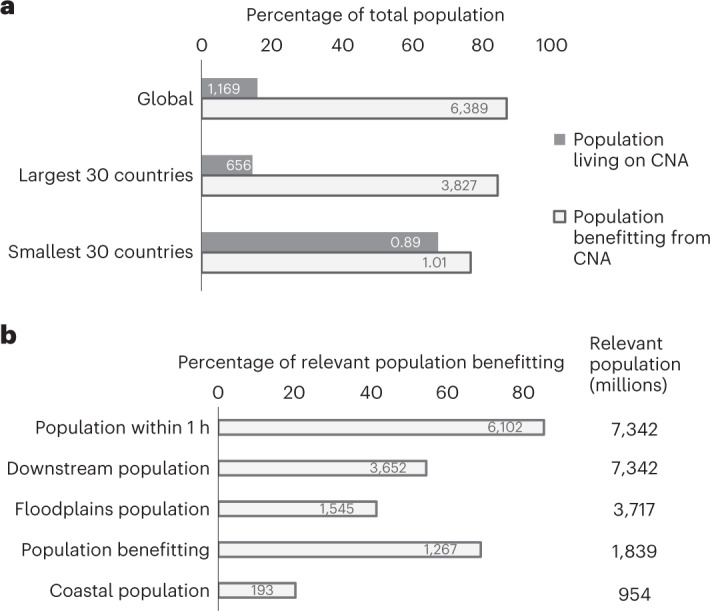
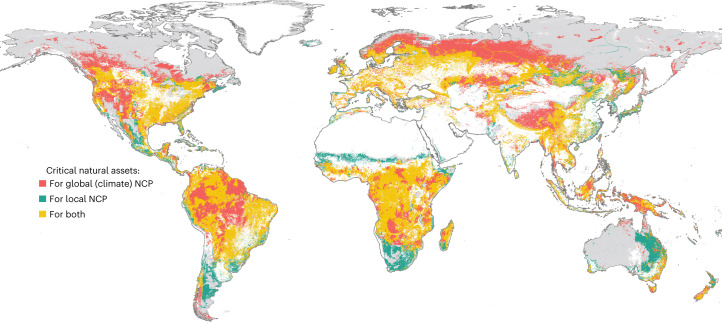
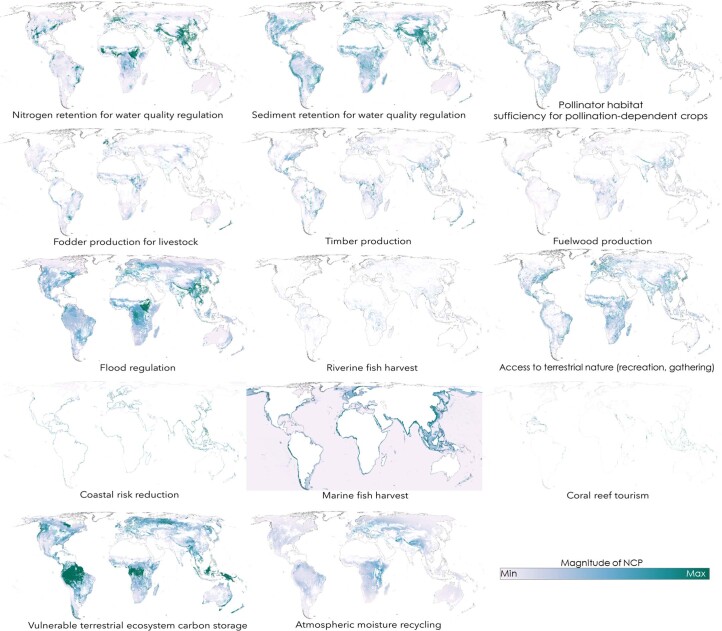
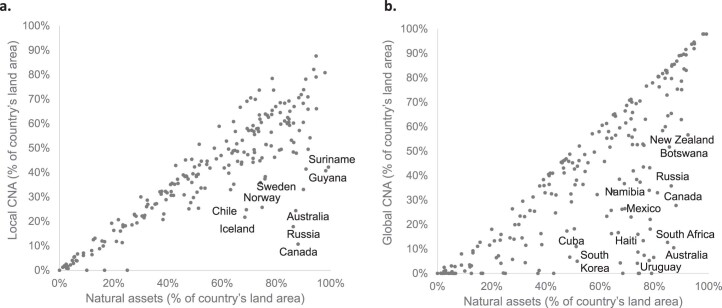
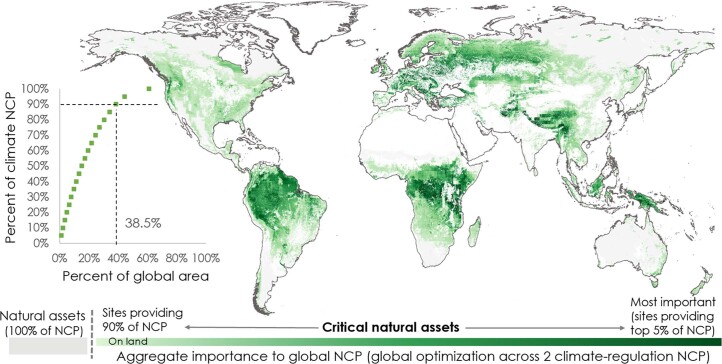
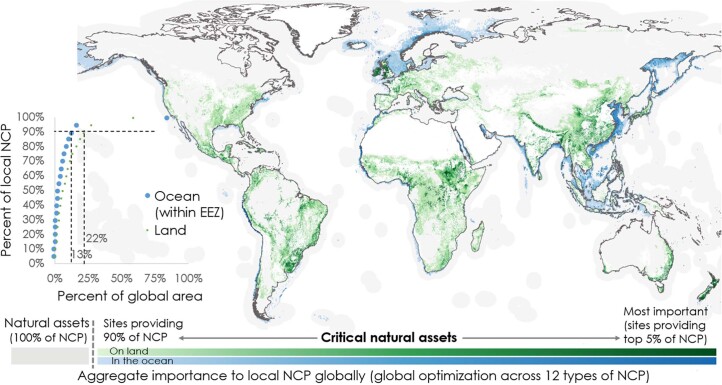
Sustaining the organisms, ecosystems and processes that underpin human wellbeing is necessary to achieve sustainable development. Here we define critical natural assets as the natural and semi-natural ecosystems that provide 90% of the total current magnitude of 14 types of nature's contributions to people (NCP), and we map the global locations of these critical natural assets at 2 km resolution. Critical natural assets for maintaining local-scale NCP (12 of the 14 NCP) account for 30% of total global land area and 24% of national territorial waters, while 44% of land area is required to also maintain two global-scale NCP (carbon storage and moisture recycling). These areas overlap substantially with cultural diversity (areas containing 96% of global languages) and biodiversity (covering area requirements for 73% of birds and 66% of mammals). At least 87% of the world's population live in the areas benefitting from critical natural assets for local-scale NCP, while only 16% live on the lands containing these assets. Many of the NCP mapped here are left out of international agreements focused on conserving species or mitigating climate change, yet this analysis shows that explicitly prioritizing critical natural assets and the NCP they provide could simultaneously advance development, climate and conservation goals.


Conflict of interest statement

The authors declare no competing interests.

Figures

Fig. 1
Fig. 1. Critical natural assets, defined as the natural and semi-natural terrestrial and aquatic ecosystems required to maintain 12 of nature’s ‘local’ contributions to people (local NCP) on land (green) and in the ocean (blue).
a, The 12 local NCP analysed (that is, not including global NCP, shown in Supplementary Fig. 4). b, The NCP accumulation curve, reflecting the total area required to maintain target levels of all NCP in every country, with dotted lines denoting the area of critical natural assets (90% of NCP in 30% of land area and 24% of EEZ area). Areas selected by optimization within each country are aggregated across all countries to create a single global accumulation curve; for area requirements in individual countries, see Supplementary Data 1. c, Map of critical natural assets, with darker shades connoting critical natural assets that are associated with higher levels of aggregated NCP. Grey areas show the extent of remaining natural assets not designated ‘critical’ but included in this analysis; white areas (cropland, urban and bare areas, ice and snow, and ocean areas outside the EEZ) were excluded from the optimization.
Fig. 2
Fig. 2. People benefitting from and living on critical natural assets (CNA).
a,b, ‘Local’ beneficiaries were calculated through the intersection of areas benefitting from different NCP, to avoid double-counting people in areas of overlap; only those NCP for which beneficiaries could be spatially delineated were included (that is, not material NCP that enter global supply chains: fisheries, timber, livestock or crop pollination). Bars show percentages of total population globally and for large and small countries (a) or the percentage of relevant population globally (b). Numbers inset in bars show millions of people making up that percentage. Numbers to the right of bars in b show total relevant population (in millions of people, equivalent to total global population from Landscan 2017 for population within 1 h travel or downstream, but limited to the total population living within 10 km of floodplains or along coastlines <10 m above mean sea level for floodplain and coastal populations protected, respectively, and to rural poor populations for fuelwood).
Fig. 3
Fig. 3. Spatial overlaps between critical natural assets for local and global NCP.
Red and teal denote where critical natural assets for global NCP (providing 90% of ecosystem carbon and moisture recycling globally) or for local NCP (providing 90% of the 12 NCP listed in Fig. 1), respectively, but not both, occur; gold shows areas where the two overlap (24% of the total area). Together, local and global critical natural assets account for 44% of total global land area (excluding Antarctica). Grey areas show natural assets not defined as ‘critical’ by this analysis, though still providing some values to certain populations. White areas were excluded from the optimization.
Extended Data Fig. 1
Extended Data Fig. 1. Individual maps for the 14 of Nature’s Contributions to People (NCP) included in critical natural assets.
Full size maps for each NCP are available at https://osf.io/5nfje.
Extended Data Fig. 2
Extended Data Fig. 2. Percent of land in critical natural assets (CNA) for local (a) and global (b) benefits, plotted against the percentage of total natural assets in a country.
Labeled countries are outliers, with relatively low critical natural assets area requirements for the percent of total land area made up by natural assets.
Extended Data Fig. 3
Extended Data Fig. 3. Spatial congruence between NCP aligning with critical natural asset hotspots.
Close-ups of regions with high congruence include the southeastern US (top left), central South America (top right), western Europe (middle left), China and southern Asia (middle right) and central Africa (bottom left). Warmer colors (greens and yellow) represent a larger number of overlaps between single-NCP optimizations, while cooler colors (blues and purples) denote fewer overlaps. Pink areas, shown overlaid on the maps on the right of each pair, show the top 10% of highest value areas in the multi-NCP optimization (including all 12 ‘local’ NCP).
Extended Data Fig. 4
Extended Data Fig. 4. Critical natural assets identified through optimization at the global level of two climate-relevant NCP: vulnerable carbon and vegetation-mediated atmospheric moisture regulation.
As in Fig. 1, the NCP accumulation curve reflects the total area required to maintain target levels of both global NCP (optimized globally, not within each country), with dotted lines denoting the area of critical natural assets (90% of global climate NCP in 39% of land area). The map shows critical natural assets for global climate NCP, with darker shades connoting greater contribution to aggregate NCP.
Extended Data Fig. 5
Extended Data Fig. 5. Critical natural assets identified through optimization at the global level of 12 ‘local’ NCP.
As in Fig. 1, the NCP accumulation curve reflects the total area required to maintain target levels of all 12 local NCP (but in this case optimized globally, not within each country), with dotted lines denoting the area of critical natural assets (90% of the 12 NCP listed in Fig. 1a in 22% of land area and 13% of EEZ areas). The map shows critical natural assets for local NCP, with darker shades connoting greater contribution to aggregate NCP.

References

    1. Summary for Policymakers of the Global Assessment Report on Biodiversity and Ecosystem Services of the Intergovernmental Science-Policy Platform on Biodiversity and Ecosystem Services (IPBES, 2019).
    1. Dobson AP, et al. Ecology and economics for pandemic prevention. Science. 2020;369:379–381. doi: 10.1126/science.abc3189. - DOI - PubMed
    1. Diaz S, et al. Assessing nature’s contributions to people. Science. 2018;359:270–272. doi: 10.1126/science.aap8826. - DOI - PubMed
    1. Hole, D. G. et al. Make nature’s role visible to achieve the SDGs. Glob. Sustain.5, e8 (2021).
    1. Roe, S. et al. Contribution of the land sector to a 1.5 °C world. Nat. Clim. Chang. 9, 817–828 (2019).

Publication types