. 2022 Dec;19(12):1572-1577.
doi: 10.1038/s41592-022-01675-0. Epub 2022 Nov 28.

A large-scale neural network training framework for generalized estimation of single-trial population dynamics

Affiliations

A large-scale neural network training framework for generalized estimation of single-trial population dynamics

Mohammad Reza Keshtkaran et al. Nat Methods. 2022 Dec.

Abstract

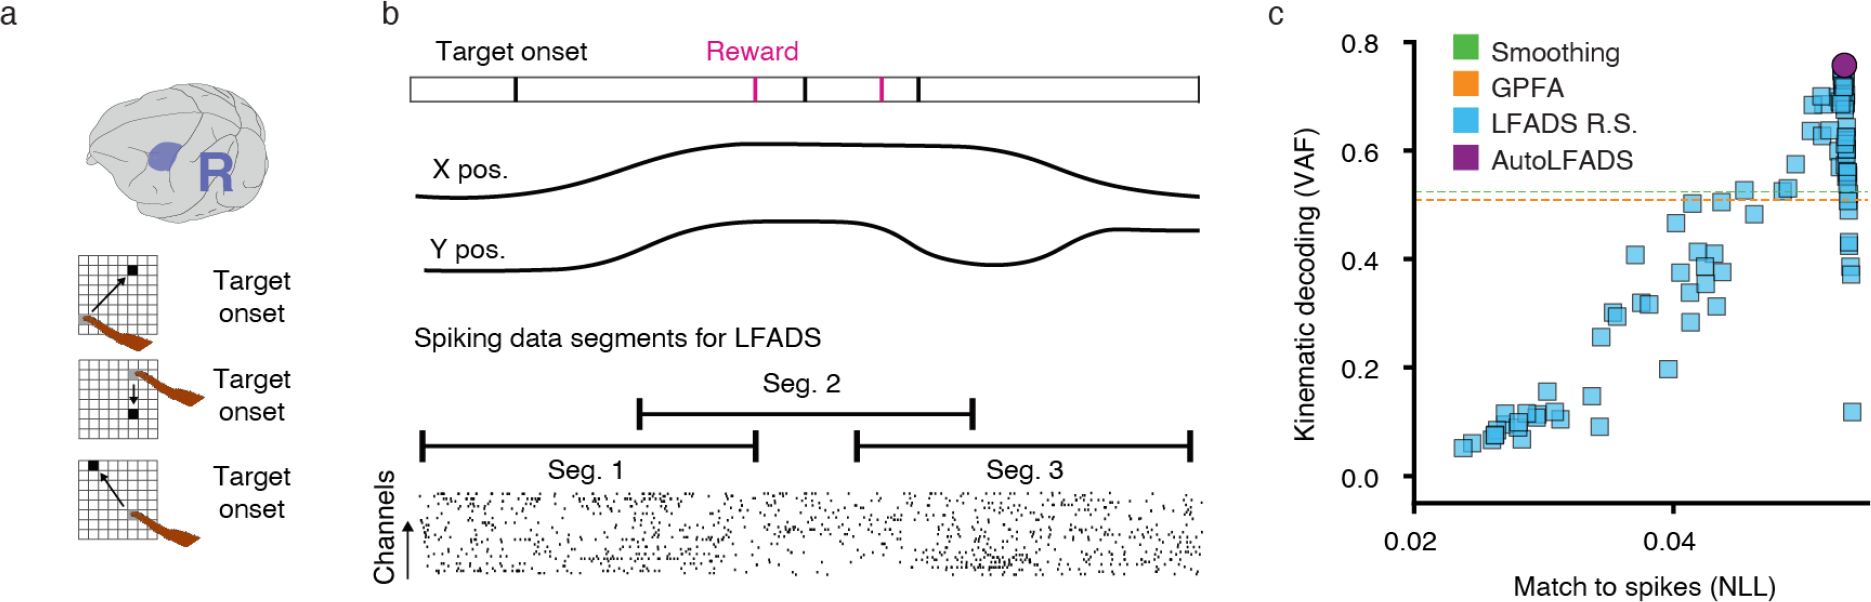
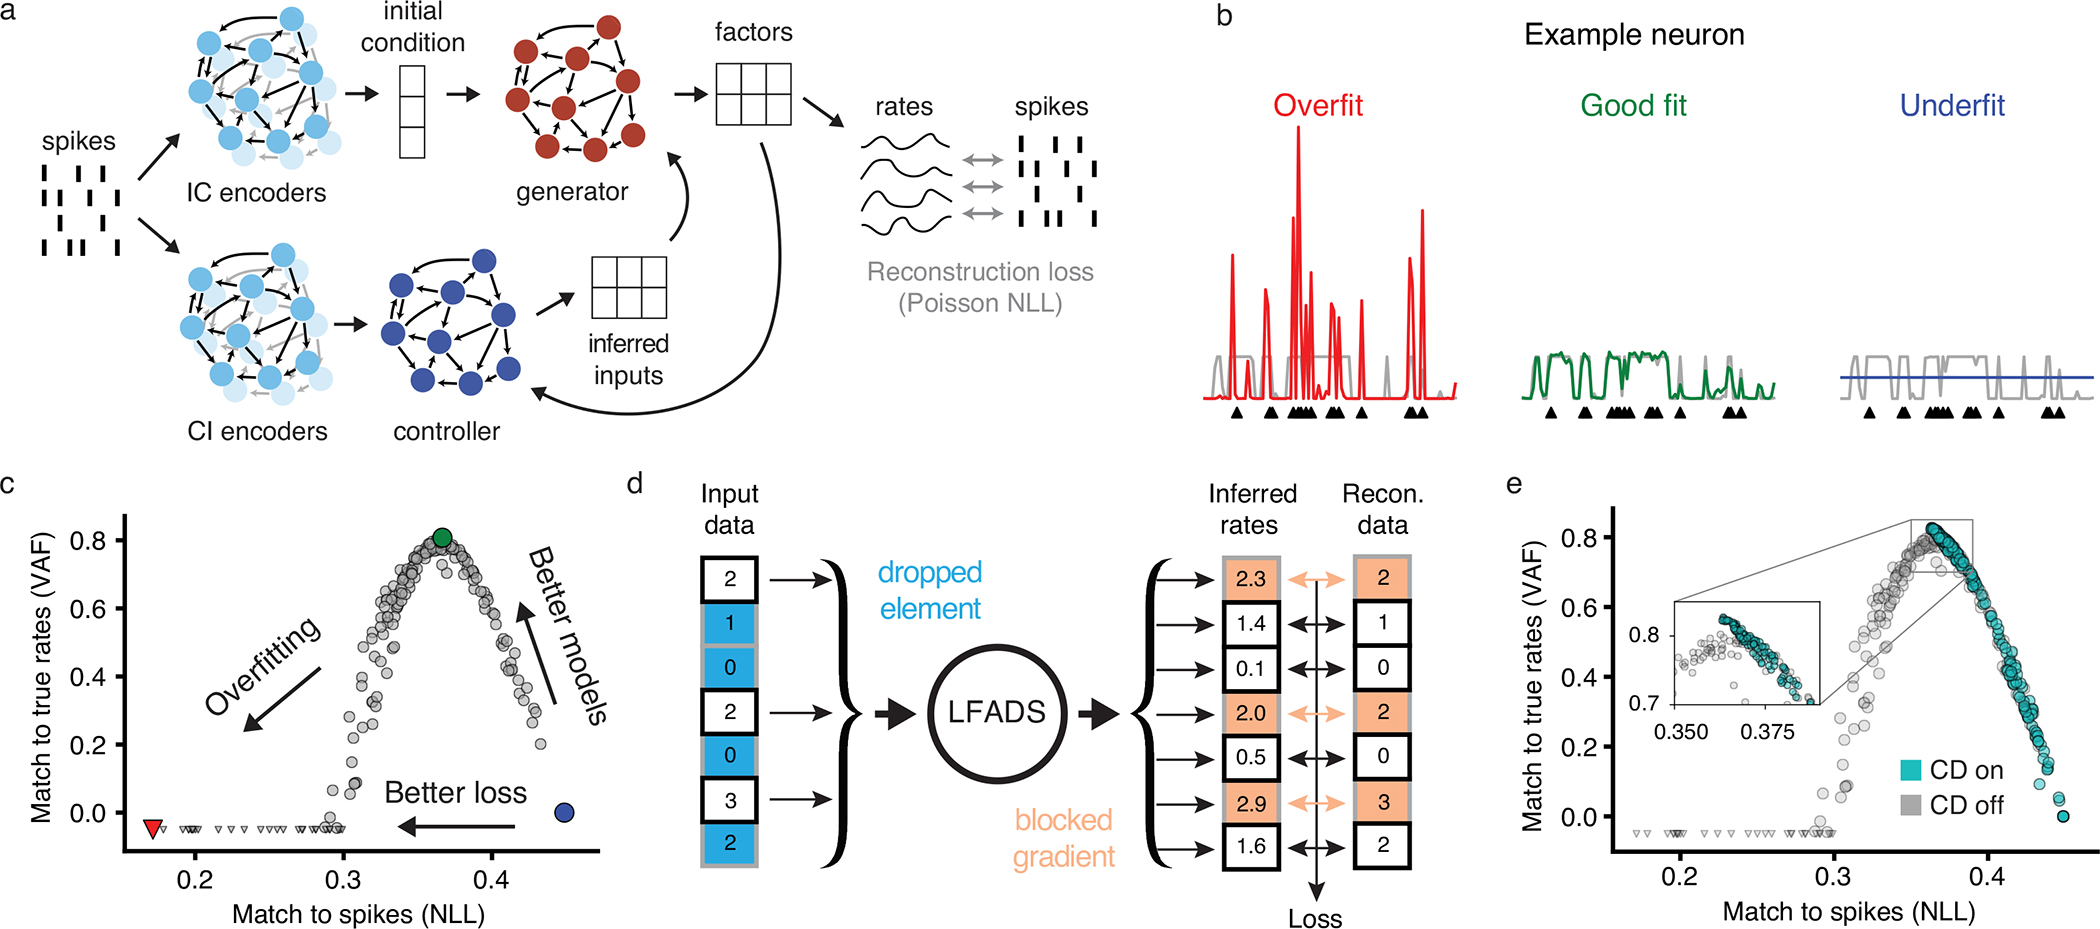
Achieving state-of-the-art performance with deep neural population dynamics models requires extensive hyperparameter tuning for each dataset. AutoLFADS is a model-tuning framework that automatically produces high-performing autoencoding models on data from a variety of brain areas and tasks, without behavioral or task information. We demonstrate its broad applicability on several rhesus macaque datasets: from motor cortex during free-paced reaching, somatosensory cortex during reaching with perturbations, and dorsomedial frontal cortex during a cognitive timing task.


Conflict of interest statement

Competing Interests

CP is a consultant to Synchron and Meta (Reality Labs). These entities did not support this work, have a role in the study, or have any financial interests related to this work.

Figures

Extended Data Figure 1 |
Extended Data Figure 1 |. Training AutoLFADS models with Population-Based Training.
(a) Schematic of the PBT approach to HP optimization. Each colored circle represents an LFADS model with a certain HP configuration and partially filled bars represent model performance (higher is better). In our case, performance is measured by exponentially-smoothed validation log-likelihood at the end of each generation. Models are trained for fixed intervals (generations), between which poorly-performing models are replaced by copies of better-performing models with perturbed HPs. (b) True rate recovery performance of AutoLFADS vs. best random search model (no CD) for a given number of workers. We did not run AutoLFADS with more than 20 workers. Instead, we extrapolate with a dashed line for comparison. Random searches were simulated by drawing from the pool of runs shown in Fig. 1c. Center line denotes median and shaded regions denote upper and lower quartiles for 100 draws. (c) Hyperparameter progressions for the 20-worker AutoLFADS run shown in the previous panel. Initialization values are shown as gray points and initialization ranges are shown as gray lines.
Extended Data Figure 2 |
Extended Data Figure 2 |. Single-trial and PSTH recovery in diverse brain areas.
Results are shown for M1 (a, b), Area 2 (c, d) and DMFC (e, f). (a) Average reach trajectories (top), PSTHs (second row) and single-trial firing rates (bottom) obtained by smoothing (Gaussian kernel, 30 ms s.d.) or AutoLFADS for a single neuron across 4 reach conditions. Data is modeled at 2 ms bins. Dashed lines indicate movement onset and vertical scale bars denote rates (spikes/s). (b) Performance in replicating the empirical PSTHs computed on all trials using rates inferred from a 184-trial training set using AutoLFADS and LFADS with random HPs (100 models; no CD). (c) PSTHs and single-trial firing rates for a single neuron across 4 passive perturbation directions. Smoothing was performed using a Gaussian kernel with 10 ms s.d.. Dashed lines indicate movement onset. (d) Comparison of AutoLFADS vs. random search (no CD) in matching empirical PSTHs. (e) PSTHs and single-trial firing rates for an example neuron during the Set-Go period of leftward saccade trials across 4 different values of ts (vertical scale bar: spikes/sec). Smoothing was performed using a Gaussian kernel with 25 ms s.d.. (f) Performance in replicating the empirical PSTHs.
Extended Data Figure 3 |
Extended Data Figure 3 |. Further characterization of maze modeling.
(a) Brain area and task schematics for the maze dataset, M. (b) Example PSTHs, aligned to movement onset (dashed line). Colors indicate reach conditions, shaded regions denote standard error, and vertical scale bars denote rates (spikes/s). (c) Hand velocity decoding performance from a 184-trial training subset of the maze dataset in comparison to smoothing, GPFA, and LFADS R.S. (100 models; no CD) baselines.
Extended Data Figure 4 |
Extended Data Figure 4 |. Further characterization of random target modeling.
(a) Brain area and task schematics for the random target dataset, R. (b) Schematic of the random target task (top), revealing the unstereotyped trial structure. Continuous neural spiking data was divided into overlapping segments for modeling (bottom). After modeling, the inferred rates were merged using a weighted average of data at overlapping time points. (c) Hand velocity decoding performance for AutoLFADS in the random target task in comparison to smoothing, GPFA, and LFADS R.S. (random search) baselines.
Extended Data Figure 5 |
Extended Data Figure 5 |. Further characterization of area 2 dataset modeling.
(a) Brain area and task schematics for the area 2 dataset, A. (b) Comparison of spike count predictive performance for AutoLFADS and GLMs. Filled circles correspond to neurons for which AutoLFADS pR2 was significantly higher than GLM pR2, and open circles correspond to neurons for which there was no significant difference. Arrows (left) indicate neurons for which GLM pR2 was outside of the plot bounds. (c) PSTHs produced by smoothing spikes (top), AutoLFADS (middle), or GLM predictions (bottom) for 3 example neurons for the area 2 dataset. (d) Subspace representations of hand x-velocity during active and passive movements extracted from smoothed spikes and rates inferred by AutoLFADS for the area 2 dataset. (e) Hand velocity decoding performance for AutoLFADS during active trials of the area 2 dataset in comparison to smoothing, GPFA, and LFADS R.S. (random search) baselines.
Extended Data Figure 6 |
Extended Data Figure 6 |. Further characterization of DMFC dataset modeling.
(a) Brain area and task schematics for the DMFC dataset, D. (b) PSTHs for three additional example neurons during the Set-Go period of rightward trials for two response modalities and all values of ts. Vertical scale bars denote spikes / sec. (c) Example plots showing correlations between neural speed and behavior (i.e., production time, tp) for individual trials across two timing intervals (red: 640 ms blue: 1000 ms). Neural speed was obtained based on the firing rates inferred from smoothing, GPFA, the LFADS model (no CD) with best median speed-tp correlation across the 40 different task conditions (Best LFADS), and AutoLFADS. (j) Distributions of correlation coefficients across 40 different task conditions. Horizontal lines denote medians. For LFADS, the distribution includes correlation values for all 96 models with random HPs (40×96 values).
Figure 1 |
Figure 1 |. Combining a novel regularization technique with a large-scale framework for automated HP optimization.
(a) The LFADS architecture, which infers the firing rates that underlie observed spikes. (b) Examples of LFADS-inferred rates (colored), the corresponding synthetic input data (spikes, shown as black triangles), and the data-generating distribution (ground truth rates, shown as gray traces) for three models of differing quality. (c) Performance of 200 LFADS models with random HPs for a synthetic dataset. Performance is computed via two metrics: how well the models match spikes (i.e., validation negative log-likelihood; NLL) and how well they match the synthetic firing rates that generated the spikes (i.e., variance accounted for; VAF). Gray points indicate random search models and colored points indicate the models that produced the rates in the previous panel. Triangles indicate models with negative VAF. All metrics were computed on validation data. (d) Schematic of coordinated dropout (CD) regularization. Random elements of the input data tensor are zeroed and the rest are scaled up, as in the standard dropout layer. Loss gradients are blocked for these elements to prevent overfitting to spikes (indicated with colored arrows). (e) Same as in (c), but including models trained with CD.
Figure 2 |
Figure 2 |. Applying AutoLFADS to four diverse datasets.
(a) Brain area and task schematics for the motor cortex maze dataset, MM. (b) Hand velocity decoding performance (VAF, mean of x- and y-directions) from firing rates as a function of training dataset size for AutoLFADS in comparison to smoothing and LFADS M.T (manually tuned) baselines. Lines and shading denote mean +/− standard error across 7 models trained on randomly-drawn trial subsets. (c) Same as (a), for the motor cortex random target dataset, MR. (d) Top three principal components of neural activity on single trials colored by angle to the target. (e) Hand velocity decoding performance for AutoLFADS in the random target task in comparison to smoothing, GPFA, and LFADS R.S. (random search) baselines. For LFADS R.S., error bars denote upper and lower quartiles (N=100). (f) Same as (a), for the area 2 dataset, A. (g) Joint angular velocity decoding performance from firing rates inferred using smoothing, GPFA, and AutoLFADS. Bars indicate mean and error is standard error of the mean across cross-validation splits (N=5). Joint abbreviations: shoulder adduction (SA), shoulder rotation (SR), shoulder flexion (SF), elbow flexion (EF), wrist radial pronation (RP), wrist flexion (WF), and wrist adduction (WA). (h) Same as (a), for the DMFC dataset, D. (i) PSTHs for an example neuron during the Set-Go period of rightward trials for two response modalities and all values of ts. Vertical scale bars denote spikes / sec. (j) Distributions of correlation coefficients across 40 different task conditions. Horizontal lines denote medians. For LFADS, the distribution includes correlation values for all 96 models with random HPs (40×96 values). (k) Comparison between performance of AutoLFADS and random search on a 184-trial subset, as measured by two supervised metrics (kinematic decoding and PSTH reconstruction). Arrows indicate direction of better performance for each metric. (l) Same as (k), for the full area 2 dataset (decoding from active trials only). (m) Same as (k), for the full DMFC dataset. The kinematic decoding metric is replaced by the correlation between neural speed and the produced interval.

References

    1. Jun JJ, Steinmetz NA, Siegle JH, Denman DJ, Bauza M, Barbarits B, et al. Fully integrated silicon probes for high-density recording of neural activity. Nature. 2017. Nov;551(7679):232–6. - PMC - PubMed
    1. Stevenson IH, Kording KP. How advances in neural recording affect data analysis. Nat Neurosci. 2011. Feb;14(2):139–42. - PMC - PubMed
    1. Stringer C, Pachitariu M, Steinmetz N, Carandini M, Harris KD. High-dimensional geometry of population responses in visual cortex. Nature. 2019. Jul;571(7765):361–5. - PMC - PubMed
    1. Berger M, Agha NS, Gail A. Wireless recording from unrestrained monkeys reveals motor goal encoding beyond immediate reach in frontoparietal cortex. Elife. 2020;9:e51322. - PMC - PubMed
    1. Steinmetz NA, Aydin C, Lebedeva A, Okun M, Pachitariu M, Bauza M, et al. Neuropixels 2.0: A miniaturized high-density probe for stable, long-term brain recordings. Science. 2021. Apr 16;372(6539):eabf4588. - PMC - PubMed

Publication types