. 2023 Feb;19(2):218-229.
doi: 10.1038/s41589-022-01202-4. Epub 2022 Nov 28.

Mechanism of high-mannose N-glycan breakdown and metabolism by Bifidobacterium longum

Affiliations

Mechanism of high-mannose N-glycan breakdown and metabolism by Bifidobacterium longum

Rosa L Cordeiro et al. Nat Chem Biol. 2023 Feb.

Abstract

Bifidobacteria are early colonizers of the human gut and play central roles in human health and metabolism. To thrive in this competitive niche, these bacteria evolved the capacity to use complex carbohydrates, including mammalian N-glycans. Herein, we elucidated pivotal biochemical steps involved in high-mannose N-glycan utilization by Bifidobacterium longum. After N-glycan release by an endo-β-N-acetylglucosaminidase, the mannosyl arms are trimmed by the cooperative action of three functionally distinct glycoside hydrolase 38 (GH38) α-mannosidases and a specific GH125 α-1,6-mannosidase. High-resolution cryo-electron microscopy structures revealed that bifidobacterial GH38 α-mannosidases form homotetramers, with the N-terminal jelly roll domain contributing to substrate selectivity. Additionally, an α-glucosidase enables the processing of monoglucosylated N-glycans. Notably, the main degradation product, mannose, is isomerized into fructose before phosphorylation, an unconventional metabolic route connecting it to the bifid shunt pathway. These findings shed light on key molecular mechanisms used by bifidobacteria to use high-mannose N-glycans, a perennial carbon and energy source in the intestinal lumen.


Conflict of interest statement

Competing interests

The authors declare no competing interests.

Figures

Extended Data Fig. 1 |
Extended Data Fig. 1 |. Genomic organization of the predicted N-glycan utilization loci (N-GUL) from B. longum NCC2705.
a, Genes that compose N-GUL represented by arrows and their respective gene products. a = biochemically characterized in this work, b = predicted, c = characterized in previous works,,. The symbol * represents transcriptional regulators (bl1336 – encoding a LacI transcriptional regulator and bl1340 – encoding a ROK transcriptional regulator). b, A schematic representation of a high-mannose N-glycan indicating its subunits (geometric forms), glycosidic linkages (gray symbols) and the cleavage sites (scissors) recognized by the GH5 β-mannosidase and GH85 ENGase enzymes previously characterized. Predictions of uncharacterized enzymes were performed by sequence and hidden-Markov similarities analyses (Supplementary Tables 1, 2). c, Representation of Man9GlcNAc. d, Representation of Man5GlcNAc.
Extended Data Fig. 2 |
Extended Data Fig. 2 |. Evolutionary analysis of Bifidobacterium strains.
a, Phylogenetic tree of Bifidobacterium genomes. *1: B. ruminantium, B. pseudocatenulatum, B. catenulatum, and B. moukalabense; *2: B. jacchi, B. scardovii, B. samirii, B. biavatii, B. ramosum, B. hapali, B. aerophilum, and B. leontopitheci; *3: B. merycicum, B. callitrichos, B. platyrrhinorum, B. aesculapii, B. parmae, B. stellenboschens, B. eulemuris, B. lemurum, B. scaligerum, B. callitrichidarum, B. myosotis, B. reuteri, B. cebidarum, B. felsineum, B. imperatoris, and B. saguini. b, Examples of N-GUL gene organizations that can be found in intra- and interspecies.
Extended Data Fig. 3 |
Extended Data Fig. 3 |. Man9GlcNAc breakdown by the action of Bl_Man38A and Bl_Man38C.
a, Negative control of Man9GlcNAc with no enzyme. b, Only Bl_Man38A. c, Only Bl_Man38C. d, Both Bl_Man38A and Bl_Man38C added into the reaction. Note that the combined reaction led to complete depletion of the substrate, forming mainly the final product Man1GlcNAc and residual amounts of Man3GlcNAc.
Extended Data Fig. 4 |
Extended Data Fig. 4 |. Bl_Man125 displayed no activity over Man5GlcNAc and Man9GlcNAc substrates.
Biochemical profile of Bl_Man125 using Man5GlcNAc (a, b) and Man9GlcNAc (c, d) as putative substrates in 60-min reactions. a, Negative control of Man5GlcNAc with no enzyme. b, Man5GlcNAc with Bl_Man125. c, Negative control of Man9GlcNAc with no enzyme. d, Man9GlcNAc with Bl_Man125.
Extended Data Fig. 5 |
Extended Data Fig. 5 |. The complementary activity of Bl_Man125 with Bl_Man38A-C enzymes on Man5GlcNAc.
Reactions combining the GH125 α-1,6-mannosidase and the GH38 enzymes using Man5GlcNAc to evaluate a putative booster effect in the degradation of small oligosaccharides. a, Negative control (no enzyme). b, Bl_Man125, c, Bl_Man38A, d, Bl_Man38A and Bl_Man125, e, Bl_Man38B, f, Bl_Man38B and Bl_Man125, g, Bl_Man38C, h, Bl_Man38C and Bl_Man125, i, Bl_Man38A and Bl_Man38C, j, Bl_Man38A, Bl_Man38C and Bl_Man125. Note that a remarkable difference is observed for Bl_Man38B, in which peaks corresponding to Man3GlcNAc and Man2GlcNAc are depleted in the presence of Bl_Man125.
Extended Data Fig. 6 |
Extended Data Fig. 6 |. The distinct oligomeric states observed in the GH38 family.
Oligomeric arrangements described for the members of the GH38 family, represented by the structures under the PDB code 1HTY, 6LZ1, 1O7D and 2WYH. Blue protomers were structurally aligned, maintaining the same position and dimension for all the structures. The r.m.s.d. values of the structural comparisons of these enzymes with Bl_Man38A, Bl_Man38B and Bl_Man38C are provided in the Supplementary Table 7.
Extended Data Fig. 7 |
Extended Data Fig. 7 |. Maximum likelihood phylogeny of characterized members of the GH38 family.
Red circles indicate the sequences containing at least one structure deposited in the Protein Data Bank, with their respective codes assigned. The yellow clade indicates bacterial GH38 α-mannosidases that oligomerizes as globular dimers and is represented by the structure under the PDB code 2WYH. The purple clades correspond to lysosomal and vacuolar (for plants) family members, which oligomerize as elongated dimers as shown for the structure under the PDB code 1O7D. The green clade corresponds to monomeric enzymes that are anchored to Golgi apparatus membrane, represented by the structure under the PDB code 1HTY. The red clades comprise the tetrameric enzymes, grouping cytosolic, vacuolar (for yeasts) and bifidobacterial members in the same phylogenetic branch. Grey clades do not have structural data available to infer the oligomeric state of their members. A GH92 α-mannosidase was used as the outgroup.
Extended Data Fig. 8 |
Extended Data Fig. 8 |. Functional comparison between the mutant Bl_Man38CF726W and the wild-type Bl_Man38C.
Assays using Man5GlcNAc (ac) and Man9GlcNAc (df) as substrate, in 60-min reactions with no enzyme (a, d), with Bl_Man38C (b, e) and with Bl_Man38CF726W (c, f). *: internal control (xylohexaose). gi, Kinetic assays with Bl_Man38C and Bl_Man38CF726W on the disaccharides α-1,2-mannobiose (g), α-1,3-mannobiose (h) and α-1,6-mannobiose (i). The reactions were supplemented with 0.1 mM CoCl2. Results are expressed as mean ± SD from three independent experiments (gi).
Extended Data Fig. 9 |
Extended Data Fig. 9 |. Functional comparison between the mutant Bl_Man38AΔLeu164-Pro168 and the wild-type Bl_Man38A.
Assays using Man5GlcNAc (ac) and Man9GlcNAc (df) as substrate, with no enzyme (a, d), with Bl_Man38A (b, e) and with Bl_Man38AΔLeu164-Pro168 (c, f). *: internal control (xylohexaose). The reactions were supplemented with 0.1 mM CoCl2.
Extended Data Fig. 10 |
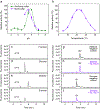
Extended Data Fig. 10 |. Enzymatic characterization of the α-glucosidase Bl_Glc31.
Enzyme activity was analyzed by colorimetric (a, b) and capillary electrophoresis methods (cj). a, Relative activity of Bl_Glc31 on pNP-α-Glc in function of pH in reactions containing McIlvaine buffer (green) and 200 mM sodium/potassium phosphate (purple) buffers. b, Relative activity of Bl_Glc31 over pNP-α-Glc in 200 mM sodium/potassium phosphate buffer in function of temperature. Data from panels a and b are shown as mean ± SD from three independent experiments (n = 3). cf, Capillary electrophoresis patterns for fructose (c), glucose (d), maltose (e) and sucrose (f). Note that in the sucrose profile only contaminant glucose is observed, and no sucrose is detected due to its lack of reactivity with APTS. (gj) Reactions of Bl_Glc31 against maltose and sucrose as putative substrates in optimal conditions of the enzyme (200 mM sodium/potassium phosphate buffer pH 5.5, at 25 °C) for 16 hrs. Due to the long reaction time, negative controls without enzyme were performed to verify possible spontaneous hydrolysis of maltose (g) and sucrose (i). In 4 min of elution, a peak of APTS is seen for all the reactions. G2 = maltose. G1 = glucose.
Fig. 1 |
Fig. 1 |. Activity of Bl_Man38A, Bl_Man38B and Bl_Man38C on native substrates and disaccharides.
a,b, Assays of Bl_Man38A–Bl_Man38C supplemented with 0.1 mM CoCl2 on Man5GlcNAc (a) or Man9GlcNAc (b) in 60-min reactions. The asterisk (*) indicates internal control (xylohexaose). cf, Kinetic assays of Bl_Man38A (c), Bl_Man38B (d), Bl_Man38C (e) and Bl_Man125 (f) on the disaccharides α-1,2-mannobiose (dark red), α-1,3-mannobiose (pink) and α-1,6-mannobiose (blue). The reactions containing GH38 α-mannosidases were supplemented with 0.1 mM CoCl2. Results are expressed as mean ± s.d. from three independent experiments. For Bl_Man125, only the kinetics curve for α-1,6-mannobiose is shown because no activity was detected with the other disaccharides. Mass spectra are provided in Supplementary Figs. 2–4. Kinetic parameters for the disaccharide hydrolysis are shown in Supplementary Table 4.
Fig. 2 |
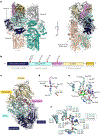
Fig. 2 |. Cryo-EM structure of Bl_Man38A as an archetypal model of the three bifidobacterial α-mannosidases.
a, Tetrameric arrangement of Bl_Man38A colored by chain, except for chain A, which was colored by domains using the color scheme represented in b and c. b, Scheme showing the domain organization. c, Cartoon representation of one protomer of the tetramer colored by domain. d, Conserved metal ion-binding site that composes the −1 subsite complexed with a Zn2+ ion. e, Interactions with a mannose at the −1 subsite of the Bl_Man38AD387A mutant. f, Superposition of residues that compose the −1 subsite for wide-type structures of Bl_Man38A (carbons are in cyan), Bl_Man38B (carbons are in white) and Bl_Man38C (carbons are in dark gray). The corresponding figures for the protomers of Bl_Man38B and Bl_Man38C are presented in Supplementary Figs. 13 and 14.
Fig. 3 |
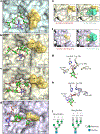
Fig. 3 |. Structural basis of high-mannose N-glycan recognition by Bl_Man38A–Bl_Man38C.
ad, Representative structures of Bl_Man38A (a), Bl_Man38B (b and c) and Bl_Man38C (d) after docking and energy minimization with Man5GlcNAc (a and b) and Man9GlcNAc (c and d). e,f, Superposition of the hypervariable loop of Bl_Man38A (green) to the active sites of Bl_Man38B (e) and Bl_Man38C (f), showing only the B- and C-arms of Man9GlcNAc (docked and energy-minimized complexes). g,h, Comparison of the putative interactions formed by Trp 736 in Bl_Man38B (g) and its substitution for a phenylalanine residue in Bl_Man38C (Phe 726) (h), showing the shift of orientation of the α-1,2-mannoside in the active site of the enzymes. Only the α-1,2-mannoside of Man9GlcNAc is shown for better visualization. i, Schematic representation of Man5GlcNAc and Man9GlcNAc docked into the structures.
Fig. 4 |
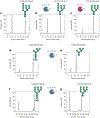
Fig. 4 |. Cleavage profile of high-mannose N-glycans by Bl_Endo85 and Bl_Glc31.
a, Control of GlcMan9GlcNAc2 in which no enzymes were added. b, Reaction of Bl_Endo85 against GlcMan9GlcNAc2, generating GlcMan9GlcNAc. c, Reaction of Bl_Glc31 against GlcMan9GlcNAc, generating Man9GlcNAc. d,f, Controls of Man5GlcNAc2-Asn (d) and Man9GlcNAc2-Asn (f) in which no enzymes were added. e,g, Reactions of Bl_Endo85 against Man5GlcNAc2-Asn (e) and Man9GlcNAc2-Asn (g), generating Man5GlcNAc and Man9GlcNAc, respectively. Asterisks (*) indicate the internal control xylohexaose. m/z values are indicated above the substrates or reaction products, and all the mass spectra are provided in Supplementary Figs. 20 and 21.
Fig. 5 |
Fig. 5 |. bl1337 encodes an efficient ManI.
a, Gene cluster including bl1337 (ManI Bl_MI), bl1339 (fructokinase), bl1338 (GH125 α-1,6-mannosidase) and bl1340 (ROK-family transcriptional regulator); a, biochemically characterized in this work; b, characterized in a previous work; c, activity predicted. b, Substrate saturation curve of Bl_MI including kinetic parameters. Results are expressed as mean ± s.d. from three independent experiments (n = 3). c, Proposed biochemical route for the conversion of mannose to fructose-6-phosphate, a central molecule for the fermentative pathway. d, Phylogenetic tree of Bifidobacterium genomes, indicating the presence of genes encoding ManIs, mannose-6-phosphate isomerases, GH5_18 β-mannosidases (markers for N-glycan degradation) and GH26 and GH5_8 β-mannanases (markers for mannan/glucomannan degradation). Multiple species are detailed in Extended Data Fig. 2.
Fig. 6 |
Fig. 6 |. Biochemical model for high-mannose N-glycan degradation and metabolism by Bifidocaterium longum.
Schematic representation of a proposed model for high-mannose N-glycan degradation by Bifidobacterium longum NCC2705 based on the biochemical data presented in this work and predicted cellular localization (Supplementary Table 11).

Similar articles

Cited by

References

    1. Fanning S et al. Bifidobacterial surface-exopolysaccharide facilitates commensal–host interaction through immune modulation and pathogen protection. Proc. Natl Acad. Sci. USA 109, 2108–2113 (2012). - PMC - PubMed
    1. Andlid TA, D’Aimmo MR & Jastrebova J in The Bifidobacteria and Related Organisms (eds Mattarelli P, Biavati B, Holzapfel WH & Wood BJB) 195–212 (Elsevier, 2018).
    1. Moya-Pérez A, Perez-Villalba A, Benítez-Páez A, Campillo I & Sanz Y Bifidobacterium CECT 7765 modulates early stress-induced immune, neuroendocrine and behavioral alterations in mice. Brain Behav. Immun 65, 43–56 (2017). - PubMed
    1. Luck B et al. Bifidobacteria shape host neural circuits during postnatal development by promoting synapse formation and microglial function. Sci. Rep 10, 7737 (2020). - PMC - PubMed
    1. Milani C et al. Genomics of the genus Bifidobacterium reveals species-specific adaptation to the glycan-rich gut environment. Appl. Environ. Microbiol 82, 980–991 (2016). - PMC - PubMed

Publication types