

Integrated analysis of microRNAs, circular RNAs, long non-coding RNAs, and mRNAs revealed competing endogenous RNA networks involved in brown adipose tissue whitening in rabbits
- PMID: 36443655
- PMCID: PMC9703717
- DOI: 10.1186/s12864-022-09025-2
Integrated analysis of microRNAs, circular RNAs, long non-coding RNAs, and mRNAs revealed competing endogenous RNA networks involved in brown adipose tissue whitening in rabbits
Abstract
Background: The brown adipose tissue (BAT) is a target for treating obesity. BAT losses thermogenic capacity and gains a "white adipose tissue-like" phenotype ("BAT whitening") under thermoneutral environments, which is a potential factor causing a low curative effect in BAT-related obesity treatments. Circular RNAs (circRNAs) and long non-coding RNAs (lncRNAs) can act as competing endogenous RNAs (ceRNA) to mRNAs and function in various processes by sponging shared microRNAs (miRNAs). However, the roles of circRNA- and lncRNA-related ceRNA networks in regulating BAT whitening remain litter known.
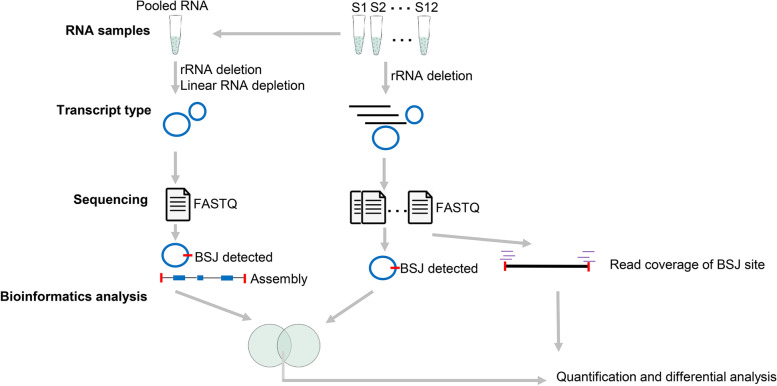
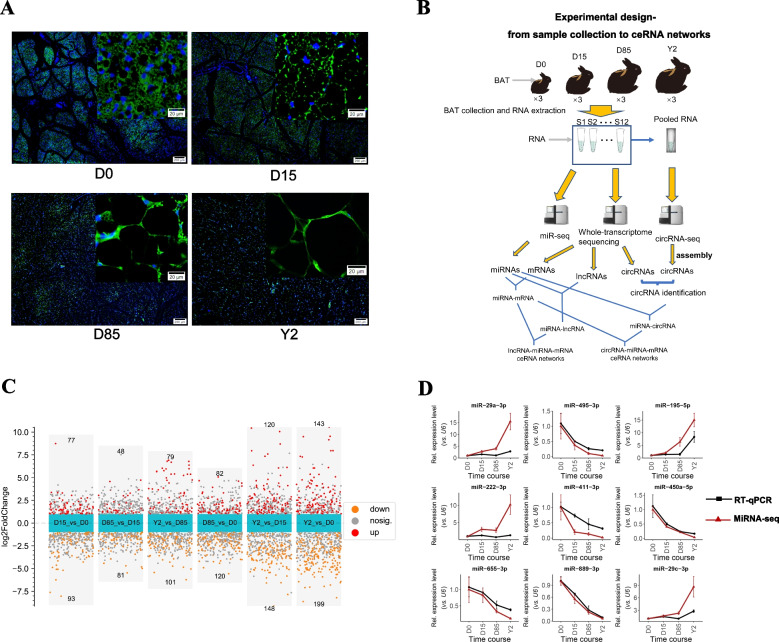
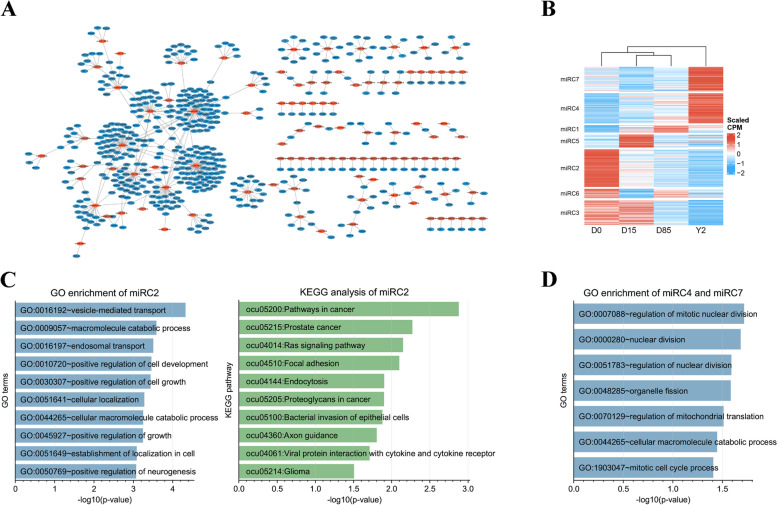
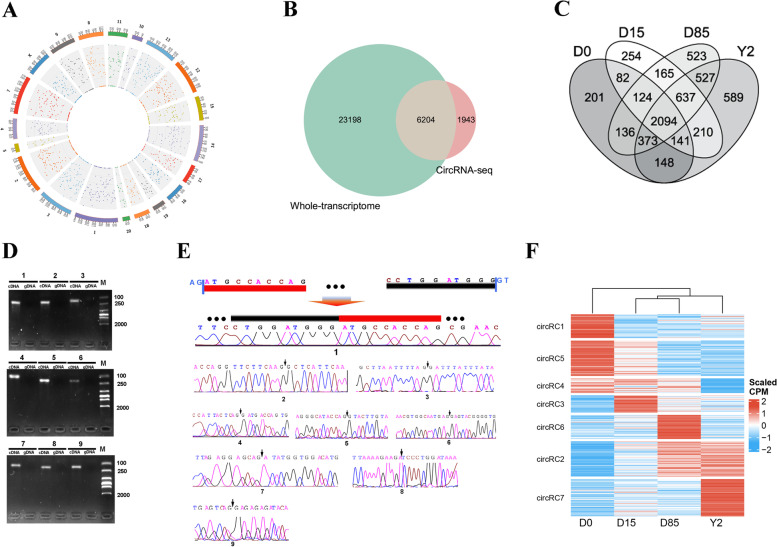
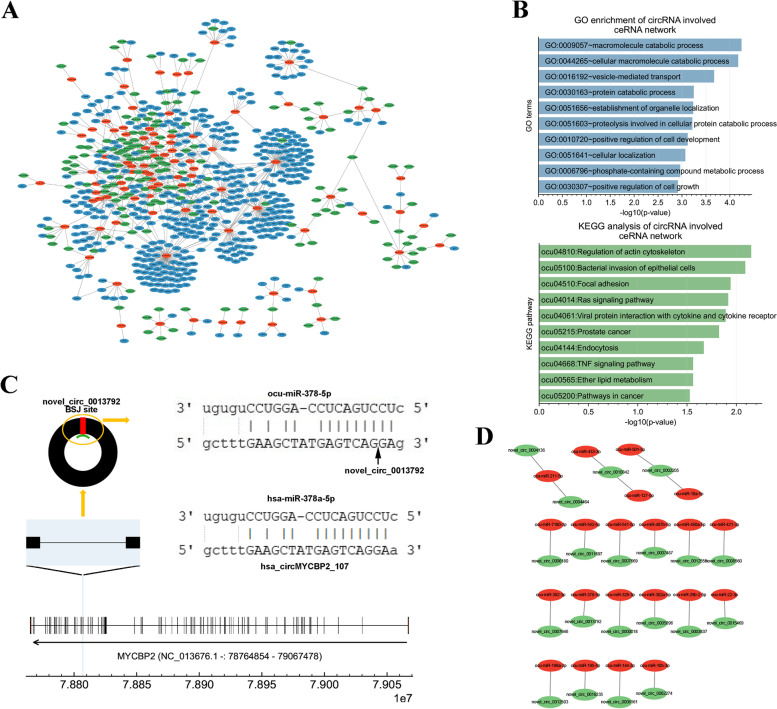
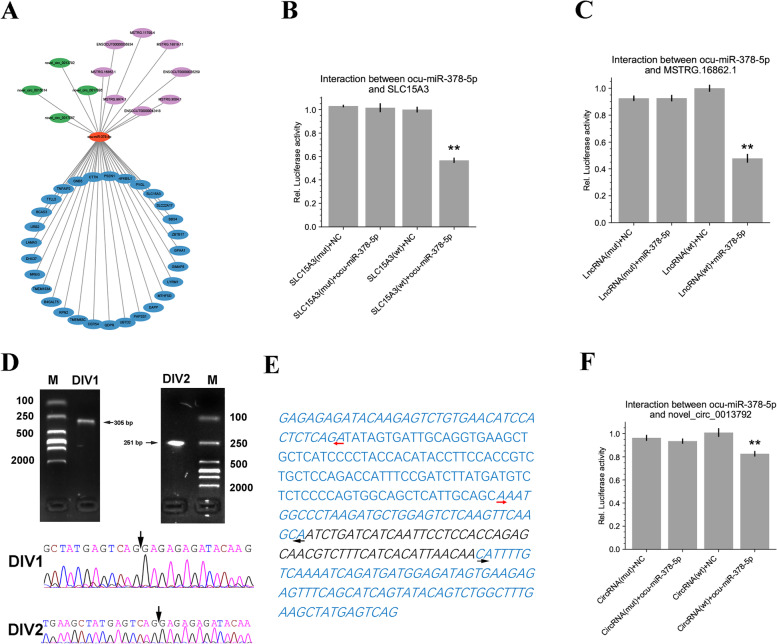
Results: In this study, BATs were collected from rabbits at day0 (D0), D15, D85, and 2 years (Y2). MiRNA-seq was performed to investigate miRNA changes during BAT whitening. Then, a combined analysis of circRNA-seq and whole-transcriptome sequencing was used for circRNA assembly and quantification during BAT whitening. Our data showed that 1187 miRNAs and 6204 circRNAs were expressed in the samples, and many of which were identified as significantly changed during BAT whitening. Target prediction showed that D0-selective miRNAs were significantly enriched in the Ras, MAPK, and PI3K-Akt signaling pathways, and Y2-selective miRNAs were predicted to be involved in cell proliferation. The cyclization of several circRNAs could form novel response elements of key thermogenesis miRNAs at the back-splicing junction (BSJ) sites, and in combination with a dual-luciferase reporter assay confirmed the binding between the BSJ site of novel_circ_0013792 and ocu-miR-378-5p. CircRNAs and lncRNAs have high cooperativity in sponging miRNAs during BAT whitening. Both circRNA-miRNA-mRNA and lncRNA-miRNA-mRNA triple networks were significantly involved in immune response-associated biological processes. The D15-selective circRNA might promote BAT whitening by increasing the expression of IDH2. The Y2-selective circRNA-related ceRNA network and lncRNA-related ceRNA network might regulate the formation of the WAT-like phenotype of BAT via MAPK and Ras signaling pathways, respectively.
Conclusions: Our work systematically revealed ceRNA networks during BAT whitening in rabbits and might provide new insight into BAT-based obesity treatments.
Keywords: BAT; Rabbits; Whitening; ceRNA; circRNA; miRNA.
© 2022. The Author(s).
Conflict of interest statement
The authors declare that they have no competing interests.
Figures

Similar articles
-
Dynamics of transcriptome and chromatin accessibility revealed sequential regulation of potential transcription factors during the brown adipose tissue whitening in rabbits.Front Cell Dev Biol. 2022 Sep 26;10:981661. doi: 10.3389/fcell.2022.981661. eCollection 2022. Front Cell Dev Biol. 2022. PMID: 36225319 Free PMC article.
-
Whole transcriptome analysis of HCT-8 cells infected by Cryptosporidium parvum.Parasit Vectors. 2022 Nov 24;15(1):441. doi: 10.1186/s13071-022-05565-4. Parasit Vectors. 2022. PMID: 36434735 Free PMC article.
-
Validation of Targeted Relationships of Novel circRNA803/lncRNA MSTRG.19726-oar-let-7a-CPEB1 ceRNA Networks, Key to Follicle Development in Single-Litter and Multi-Litter Sheep Based on Whole-Transcriptome Sequencing.Int J Mol Sci. 2025 May 28;26(11):5161. doi: 10.3390/ijms26115161. Int J Mol Sci. 2025. PMID: 40507971 Free PMC article.
-
LncRNA/CircRNA-miRNA-mRNA Axis in Atherosclerotic Inflammation: Research Progress.Curr Pharm Biotechnol. 2024;25(8):1021-1040. doi: 10.2174/0113892010267577231005102901. Curr Pharm Biotechnol. 2024. PMID: 37842894 Review.
-
RNA-Seq Revealed a Circular RNA-microRNA-mRNA Regulatory Network in Hantaan Virus Infection.Front Cell Infect Microbiol. 2020 Mar 13;10:97. doi: 10.3389/fcimb.2020.00097. eCollection 2020. Front Cell Infect Microbiol. 2020. PMID: 32232013 Free PMC article. Review.
Cited by
-
A role for miRNAs in the regulation of brown adipose tissue whitening in goats (Capra Hircus).J Anim Sci. 2024 Jan 3;102:skae124. doi: 10.1093/jas/skae124. J Anim Sci. 2024. PMID: 38712478 Free PMC article.
References
-
- Tchernof A, Després JP. Pathophysiology of human visceral obesity: an update. Physiol Rev. 2013;93(1):359–404. - PubMed
-
- Kershaw EE, Flier JS. Adipose tissue as an endocrine organ. J Clin Endocrinol Metab. 2004;89(6):2548–2556. - PubMed
-
- Reilly SM, Saltiel AR. Adapting to obesity with adipose tissue inflammation. Nat Rev Endocrinol. 2017;13(11):633–643. - PubMed
-
- Peirce V, Carobbio S, Vidal-Puig A. The different shades of fat. Nature. 2014;510(7503):76–83. - PubMed
MeSH terms
Substances
LinkOut - more resources
Full Text Sources
Miscellaneous
