. 2022 Nov 28;21(1):211.
doi: 10.1186/s12943-022-01679-6.

IL-6/STAT3 signaling in tumor cells restricts the expression of frameshift-derived neoantigens by SMG1 induction

Affiliations

IL-6/STAT3 signaling in tumor cells restricts the expression of frameshift-derived neoantigens by SMG1 induction

Daniel Meraviglia-Crivelli et al. Mol Cancer. .

Abstract

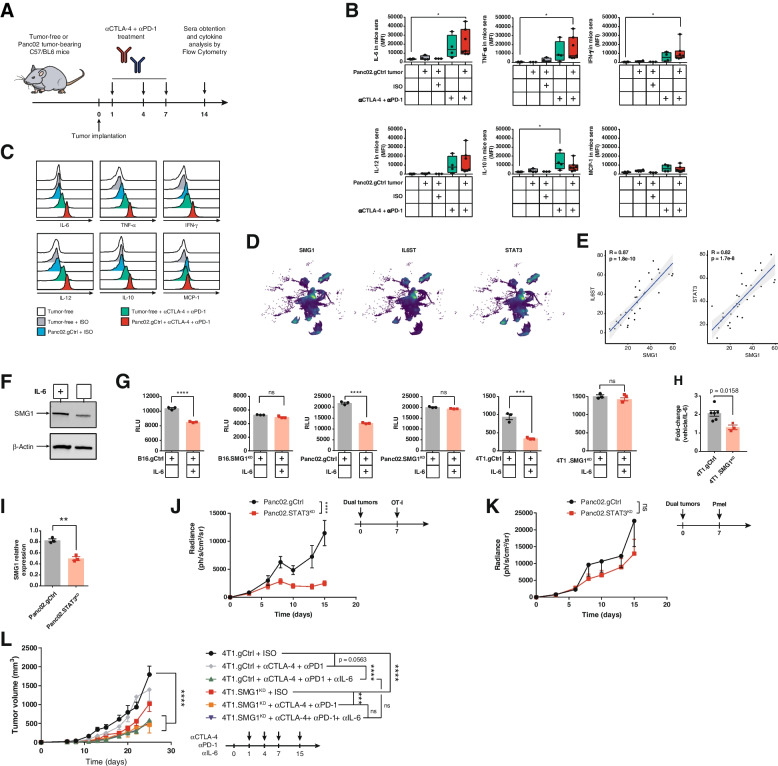
Background: The quality and quantity of tumor neoantigens derived from tumor mutations determines the fate of the immune response in cancer. Frameshift mutations elicit better tumor neoantigens, especially when they are not targeted by nonsense-mediated mRNA decay (NMD). For tumor progression, malignant cells need to counteract the immune response including the silencing of immunodominant neoantigens (antigen immunoediting) and promoting an immunosuppressive tumor microenvironment. Although NMD inhibition has been reported to induce tumor immunity and increase the expression of cryptic neoantigens, the possibility that NMD activity could be modulated by immune forces operating in the tumor microenvironment as a new immunoediting mechanism has not been addressed.

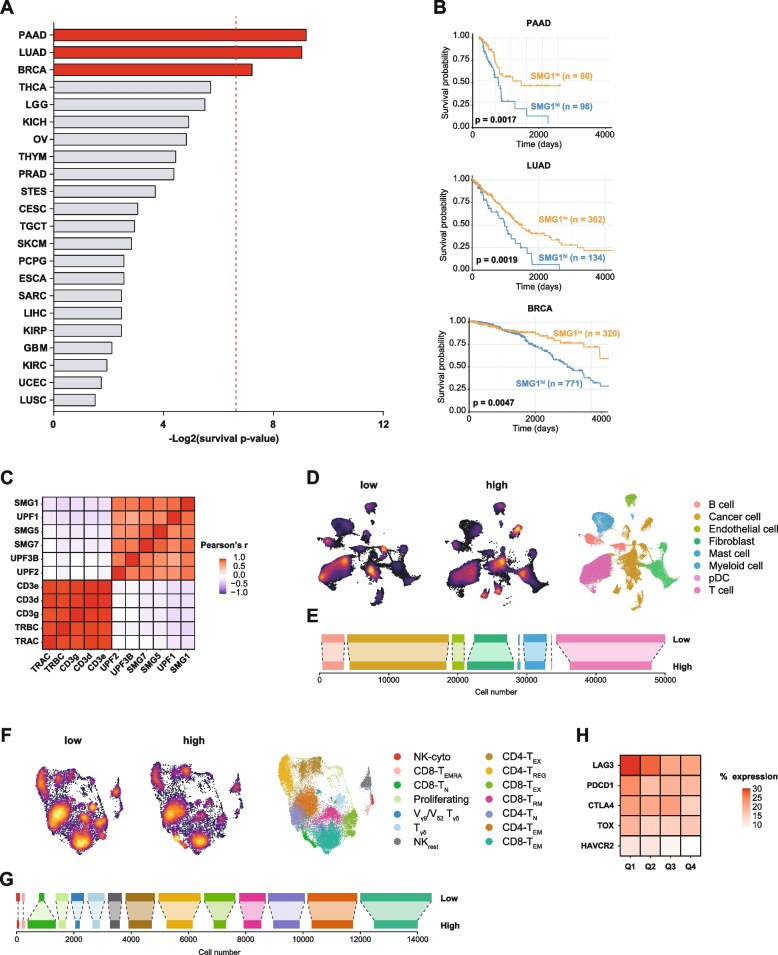
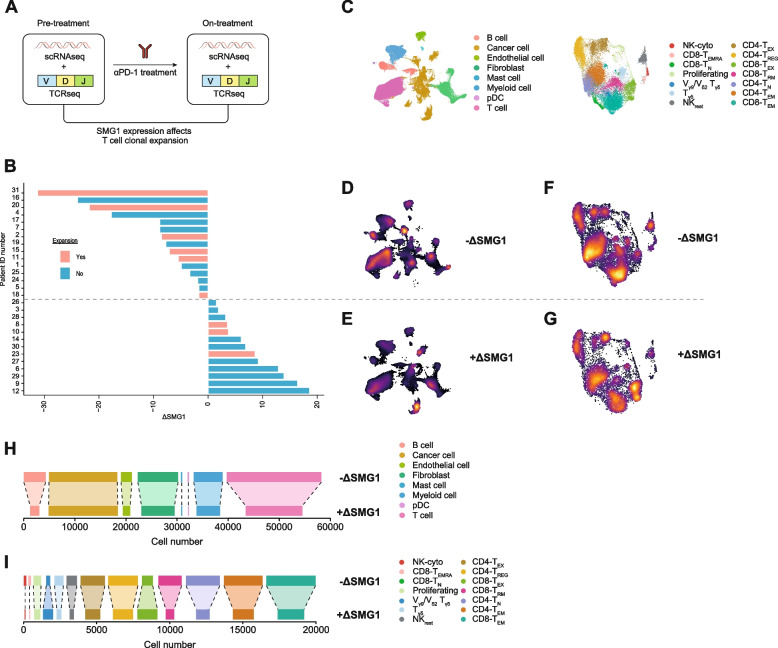
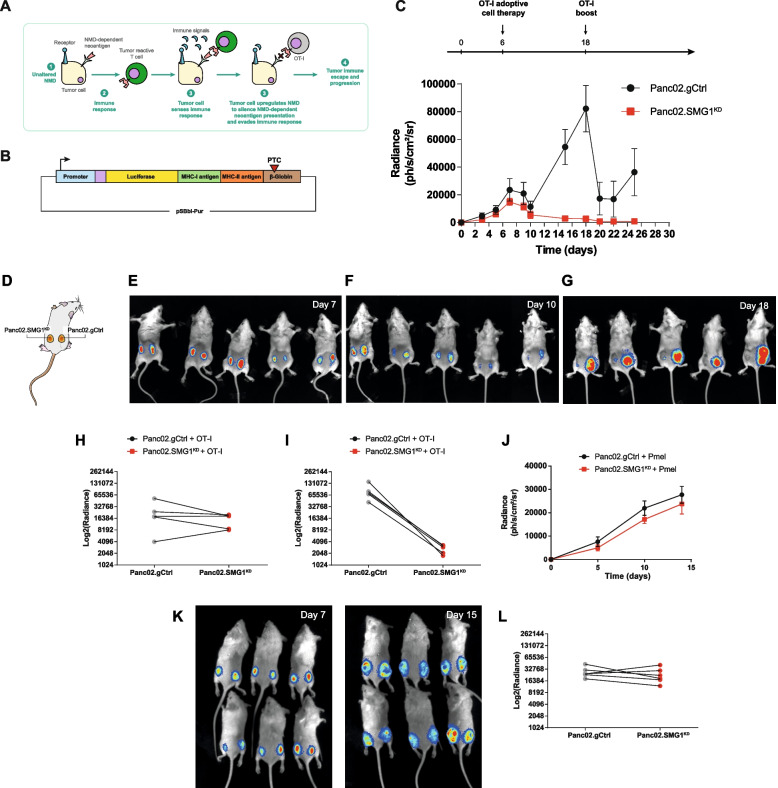
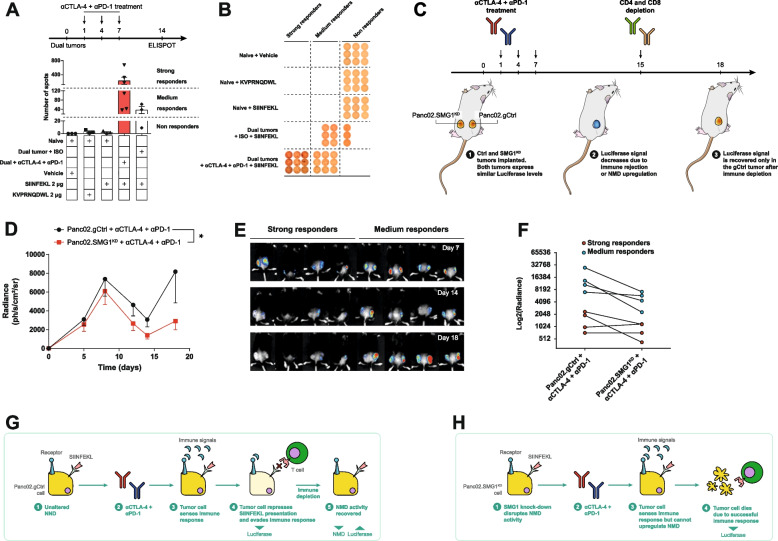
Methods: We study the effect of SMG1 expression (main kinase that initiates NMD) in the survival and the nature of the tumor immune infiltration using TCGA RNAseq and scRNAseq datasets of breast, lung and pancreatic cancer. Different murine tumor models were used to corroborate the antitumor immune dependencies of NMD. We evaluate whether changes of SMG1 expression in malignant cells impact the immune response elicited by cancer immunotherapy. To determine how NMD fluctuates in malignant cells we generated a luciferase reporter system to track NMD activity in vivo under different immune conditions. Cytokine screening, in silico studies and functional assays were conducted to determine the regulation of SMG1 via IL-6/STAT3 signaling.

Results: IL-6/STAT3 signaling induces SMG1, which limits the expression of potent frameshift neoantigens that are under NMD control compromising the outcome of the immune response.

Conclusion: We revealed a new neoantigen immunoediting mechanism regulated by immune forces (IL-6/STAT3 signaling) responsible for silencing otherwise potent frameshift mutation-derived neoantigens.

Keywords: Cancer immunotherapy; Immunoediting; NMD; Neoantigens; Tumor immunity.


Conflict of interest statement

Authors declare that they have no competing interests.

Figures

Fig. 1
Fig. 1
High SMG1 expression correlates with worse survival and lower immune infiltration in some tumors. (A) Patients with different tumors from TCGA cohorts were classified in two categories according to their SMG1 expression levels: ‘low’ or ‘high’ and significance of long-term survival was determined using long-rank test. Statistical significance was set in p ≤ 0.01 (dot line). n ≥ 100 patients per cohort. (B) Kaplan-Meyer curves of statistically significant tumors from (A): PAAD, LUAD and BRCA. (C) Heatmap illustrating correlations between the expression of genes for NMD factors and immune response-related markers in BRCA patients. scRNAseq expression data reanalyzed [21]. Heatmap shows Pearson’s r coefficient. (D) Uniform Manifold Approximation and Projection (UMAP) map of breast cancer patient [21] classified depending on their SMG1 expression as ‘high’ or ‘low’ based on the SMG1 expression on tumor cells from pretreatment samples (n= 31). Each cell type is determined by color code. (E) Bar plot showing absolute cell numbers of each population shown in (D). (F) Differentiated T-cell subpopulations in BRCA patients with low and high SMG1 expression levels as in (D). UMAP clusters of 14 different cell types depicted by color code T cells were classified as naive (CD4+ TN and CD8+ TN), regulatory T cells (CD4+ TREG), effector/memory T cells (CD4+ TEM and CD8+ TEM), recently activated effector/memory T cells (CD8+TEMRA), tissue-resident memory T cells (CD8+ TRM), exhausted T cells (CD4+ and CD8+ TEX) and proliferating T cells, resting NK cells (NKres) and cytotoxic NK cells (NKcyto), gamma-delta T cells with semi-invariant T-cell repertoires (Vγ9/Vδ2 Tγδ) and with memory features (Tγδ). (G) Bar plot showing absolute cell numbers of each population shown in (F). (H) Heatmap showing the abundance exhaustion markers on T cells in samples with different SMG1 expression as in (D), but SMG1 expression was divided in 4 quartiles from low to high: Q1, Q2, Q3 and Q4. Percentage of positive cells for each of the main exhaustion markers is shown (LAG3, PDCD1, CTLA4, TOX and HAVCR2)
Fig. 2
Fig. 2
SMG1 reduction in mouse breast cancer tumor cells slow tumor growth in an immune-dependent manner. (A) Several NMD factors (SMG1, UPF1 and UPF2) were knocked-down using CRISPR/Cas9 in 4T1 breast cancer mouse model implanted subcutaneously in Balb/c mice and tumor growth was measured over time. n = 10-12/group. (B) Tumor volumes from (A). Each line depicts the growth over time of an individual tumor. n = 10-12/group. (C) Top: Experiment schedule. Bottom: Tumor volume over time of 4T1.gCtrl tumors implanted subcutaneously in Balb/c mice treated with isotype, anti-CD4 (clone GK1.5), anti-CD8a (clone 53-6.7), anti-Asialo GM1 (Poly21460) (NK) depleting or anti-IFNAR blocking antibodies (clone MAR1-5A3). n = 6-8/group. (D) Tumor weights of (C) at end point (day 24). n = 6-8/group. (E) Knockdown of SMG1 in 4T1 cells enhances immune infiltrate. Balb/c mice were subcutaneously implanted with 4T1.gCtrl or SMG1KD cells and on day 14 tumors were resected and analyzed by flow cytometry. n = 7-8/group. (F) Knockdown of SMG1 in Panc02 cells enhances immune infiltrate. C57/BL6 mice were subcutaneously implanted with Panc02.gCtrl or SMG1KD cells and on day 14 tumors were resected and analyzed by flow cytometry. n = 6/group. Left to right: CD8 T cell infiltration, CD4+ T cell infiltration, Treg (FOXP3+CD25+) T-cell infiltration, CD8+/Treg ratio. n = 6/group. (G) Draining lymph node flow immune analysis by cytometry study in 4T1.SMG1KD and 4T1.gCtrl tumor bearing mice at day 14. n = 5 (4T1.gCtrl group); 8 (4T1.SMG1KD group). (H) Draining lymph node flow immune analysis by cytometry study in Panc02.SMG1KD and Panc02.gCtrl tumor bearing mice at day 14. n = 6/group. p-values are shown for 2-way ANOVA with Bonferroni’s post-hoc test for tumor growth experiments. 1-way ANOVA was performed in (D); and 2-tailed t-test was performed in the infiltrate study. ∗p < 0.05, ∗∗p < 0.01, ∗∗∗p < 0.001
Fig. 3
Fig. 3
SMG1 expression affects the TCR repertoire and conditions PTC-neoantigen immune responses. (A) Panc02 or 4T1 (gCtrl or SMG1KD) tumor-bearing mice are sacrificed on day 14 post-inoculation and tumor draining lymph node mRNA is isolated for TCRseq. Abundance of the TRBV segment present in the most frequent clones (>50 copies) was analyzed. n = 3/group (Panc02.SMG1KD); n = 3/group (Panc02.gCtrl); n = 3/group (4T1.SMG1KD); n = 2/group (4T1.gCtrl). (B) K-means t-sne clustering of TRBV segment from (A). n = 3/group (Panc02.SMG1KD); n = 3/group (Panc02.gCtrl); n = 3/group (4T1.SMG1KD); n = 2/group (4T1.gCtrl). (C) Pipeline followed for neoantigen discovery in 4T1 mouse breast model. (D) Integrated Genome Browser (IGV) view of the +1 insertion in Trp53 present in 4T1 cells. (E) ELISPOT determining NMD-controlled immune response induction of p53 neoantigen in 4T1 tumor-bearing mice. Balb/c mice were sacrificed on day 14 post-inoculation of gCtrl or SMG1KD 4T1 tumors and draining lymph nodes were isolated. Obtained cells were co-cultured with the candidate peptides to test antigen recognition. n = 10/group. (F) Proportion of responding and non-responding mice to Trp53 neoantigen in (E). All SMG1KD tumor-bearing mice show response to Trp53 peptide compared to the 50% of gCtrl group
Fig. 4
Fig. 4
SMG1 upregulation after anti-PD-1 therapy associates with reduced immune infiltration and compromised T-cell expansion in breast cancer patients. (A) Study design from [21] used to interrogate whether SMG1 expression fluctuation during anti-PD-1 treatment affect at TCR clonal expansion in breast cancer patients (n = 28) (B) Fluctuation of SMG1 expression (ΔSMG1) in breast cancer patient during the course of anti-PD1 treatment. Patients determined with positive TCR clonal expansion after anti-PD1 treatment are depicted in red. (C) Legend for the different cell types assigned in the UMAP clusters. (D) Represent the UMAP intensity of the group of patients with reduction on SMG1 expression after anti-PD-1 treatment (-ΔSMG1) (E) Represent the UMAP intensity of the group of patients with enhance SMG1 expression after treatment (+ΔSMG1). (F) Represent the UMAP intensity from the tumor immune infiltrate of the group of patients with reduction on SMG1 expression after anti-PD-1 treatment (-ΔSMG1). (G) Represent the UMAP intensity from the tumor immune infiltrate of the group of patients with enhance SMG1 expression after treatment (+ΔSMG1). (H) Bar plot showing absolute cell numbers of each population shown in (D-E). (I) Bar plot showing absolute cell numbers of each population shown in (F-G)
Fig. 5
Fig. 5
Tumors upregulate NMD as an immune-escape mechanism to suppress PTC-containing antigen presentation. (A) Scheme depicting the tumor mechanism of immune evasion by NMD upregulation to silence NMD-controlled neoantigens. (B) (A) Scheme of our NMD luciferase-SIINFEKL plasmid construct. Elements cloned in the plasmid (from left to right): EF-1α promoter (blue); PEST motive (violet); luciferase (yellow); SIINFEKL cDNA (green); DDCWFYFTYSVNGYNNEAIVHVVETPDCP MHC-II peptide [26], flanked by 2 cathepsin sites; β-Globin PTC-39 cassette (brown). (C) Top: Experiment schedule. Bottom: Rag2/IL2rg-/- mice were injected with Panc02.gCtrl (right flank) or SMG1KD (left flank) cells expressing luciferase-SIINFEKL reporter plasmid and radiance was measured over time. On day 6, 8 x 10⁶ activated OT-I splenocytes were transferred intravenously. On day 18, 50 μg of SIINFEKL peptide was administered intraperitoneally to induce OT-I reactivation. n = 5/group. (D) Scheme depicting Panc02.gCtrl injected in the right flank and SMG1KD in the left one. (E) Images of Rag2/IL2rg-/- mice from (B) on days 7, (F) Day 10 and (G) Day 18. (D) Radiance comparison between gCtrl and SMG1KD on day 7 from (B) post-tumor inoculation. n = 5/group. (H) Radiance comparison between gCtrl and SMG1KD on day 18 from (B) post-tumor inoculation. n = 5/group. (G) Radiance of Panc02 tumors from (B) on day 7 comparing gCtrl vs. SMG1KD. (I) Radiance of Panc02 tumors from (B) on day 18 comparing gCtrl vs. SMG1KD. (J) Rag2/IL2rg-/- mice were injected with Panc02.gCtrl (right flank) or SMG1KD (left flank) cells expressing luciferase-SIINFEKL reporter plasmid, radiance was measured over time. On day 6, 8 x 10⁶ activated Pmel splenocytes were transferred intravenously. Since SIINFEKL recognition cannot occur, no luciferase changes were observed. n = 6/group. (K) Caption of mice on day 7 (left) and 15 (right) from (J). (L) Radiance comparison between gCtrl and SMG1KD on day 15 from (J) post-tumor inoculation. n = 6/group
Fig. 6
Fig. 6
Tumors upregulate NMD to evade ICB therapy induced immune response. (A) Top: treatment schedule. C57/BL6 mice were implanted with Panc02.gCtrl on the right flank and SMG1KD on the left flank. Both cell lines expressed the NMD reporter plasmid that contains SIINFEKL under the control of a PTC, mimicking a tumor antigen under NMD pressure. Anti CTLA-4 + anti PD-1 combination treatment was injected intraperitoneally as indicated. Bottom: On day 14 mice were sacrificed and cells from tumor-draining lymph nodes were isolated and IFN-γ ELISPOT assay against SIINFEKL peptide was carried out. Human gp100-derived peptide KVPRNQDWL was used as negative control. n = 3-6/group. (B) Individual ELISPOT wells from (A) classified in strong, medium or non-responders. (C) Treatment schedule of (D). (D) C57/BL6 mice were implanted with Panc02.gCtrl (right flank) or SMG1KD (left flank) cells expressing luciferase-SIINFEKL reporter plasmid and radiance was measured over time. Mice were treated with 100 μg of each: anti CTLA-4 and anti PD-1 antibodies (A). On day 15 we depleted CD8 and CD4 T cells by injecting CD4 and CD8 antibodies (200 μg of each, clones GK1.5 and 53-6.7 respectively). n = 7. (E) Images showing luciferase intensity on days 7, 15 and 18. (F) luciferase levels on day 18 comparison between control tumor (left) and SMG1KD (right) from (F). p-values are shown for 2-way ANOVA with Bonferroni’s post-hoc test. ∗p < 0.05, ∗∗p < 0.01, ∗∗∗p < 0.001. (G) Mechanism proposed for the luciferase changes observed in anti-CTLA-4 + anti-PD-1-treated Panc02.gCtrl tumors. ICB therapy elicits a strong immune response and is sensed by the tumor cell. Cell with unaltered NMD trigger upregulation of NMD (reflected in a decrease of luciferase signal) in tumors to repress the presentation of PTC-controlled antigens (SIINFEKL in our scenario) by degrading their mRNAs via this surveillance mechanism. When the immune response is evaded by tumor cells, they recover normal NMD activity which we detected as a luciferase signal increase. (H) Mechanism proposed for anti-CTLA-4 + anti-PD-1-treated mice bearing NMD-reporter-expressing Panc02.SMG1KD tumor cell line. In contrast with control cells (C), SMG1KD cells are unable to modulate NMD activity. In this case, the immune response is capable of eliminating SIINFEKL+ tumor cells
Fig. 7
Fig. 7
IL-6 pathway is activated in tumors treated with ICB therapy upregulating NMD activity. (A) Treatment schedule for (A) and (B). (B)Tumor-free and Panc02.gCtrl tumor-bearing C57/BL6 mice were treated with isotype control (ISO) SO or anti-CTLA-4 + anti-PD-1 combination or untreated on day 1, 4 and 7 and n day 14 post tumor inoculation, mice were bled, to analyze TNF-α, MCP-1, IL-12, IL-10, IL-6 and IFN-γ by Cytometric Bead Array (CBA). (B) Cytokine levels measured by CBA in mouse sera from (A). n = 3-7/group. (C) Representative individual sample from (B) for each cytokine. (D) UMAP depicting expression of SMG1, IL6ST and STAT3 in tumor cells. IL-6 signaling factors perfectly co-localize with SMG1 [21]. Only tumor cells are shown in this figure. (E) IL6ST (gp130) and STAT3 expression at scRNAseq in malignant cells from (D) show a highly significant linear correlation with SMG1. (F) IL-6 signaling upregulates NMD expression in B16.gCtrl cell line. B16.gCtrl were incubated in the presence of hyper-IL-6 for 96 h. Protein levels were analyzed by western blot. (G) IL-6 signaling upregulates NMD. B16, Panc02 and 4T1 mouse tumor cells stably transduced with our luciferase-SIINFEKL NMD reporter plasmid were plated and murine hyper-IL-6 or vehicle was added to the media. 96 h later, luciferase signal was measured. n = 3. (H) 4T1.gCtrl or SMG1KD were treated as in (F). Trp53 mRNA levels were measured by qRT-PCR. (I) 4T1.gCtrl and STAT3KD were treated with hyper-IL-6 as in (F). SMG1 mRNA levels were measured by qRT-PCR. (J) STAT3KD or gCtrl Panc02 were injected in the left and right flanks, respectively, of Rag2/IL2rg-/- mice. Activated OT-I splenocytes were administered intravenously as shown in the schedule (right). n = 9. (K) STAT3KD or gCtrl Panc02 were injected in the left and right flanks, respectively of Rag2/IL2rg-/- mice. Activated Pmel splenocytes were administered intravenously as shown in the schedule (right). n = 7. (L) Antitumor effect of IL-6 blockade and NMD knockdown. Balb/c mice were injected with 4T1.gCtrl or SMG1KD cells. Treatment was carried out as shown in the tumor schedule. n = 6-8/group. 2-way ANOVA corrected with Bonferroni’s test was performed for tumor growth and luciferase evolution over time; 1-way ANOVA corrected by Bonferroni’s test was used in (B); 2-tail t-test employed in (F). ∗p < 0.05, ∗∗p < 0.01, ∗∗∗p < 0.001. ns = non-significant (p > 0.05)

References

    1. Korman AJ, Garrett-Thomson SC, Lonberg N. The foundations of immune checkpoint blockade and the ipilimumab approval decennial. Nat Rev Drug Discov. 2021. - PubMed
    1. Rohaan MW, Wilgenhof S, Haanen JBAG. Adoptive cellular therapies: the current landscape. Virchows Arch Virchows Archiv. 2019;474:449–461. doi: 10.1007/s00428-018-2484-0. - DOI - PMC - PubMed
    1. Yap TA, Parkes EE, Peng W, Moyers JT, Curran MA, Tawbi HA. Development of immunotherapy combination strategies in cancer. Cancer Discov. 2021;11:1368–1397. doi: 10.1158/2159-8290.CD-20-1209. - DOI - PMC - PubMed
    1. Chan TA, Yarchoan M, Jaffee E, Swanton C, Quezada SA, Stenzinger A, et al. Development of tumor mutation burden as an immunotherapy biomarker: Utility for the oncology clinic. Ann Oncol [Internet]; 2019;30:44–56. 10.1093/annonc/mdy495 - PMC - PubMed
    1. O’Donnell JS, Teng MWL, Smyth MJ. Cancer immunoediting and resistance to T cell-based immunotherapy. Nat Rev Clin Oncol [Internet] 2019;16:151–167. doi: 10.1038/s41571-018-0142-8. - DOI - PubMed

Publication types