. 2022 Nov 29;14(1):134.
doi: 10.1186/s13073-022-01137-4.

Epigenetic and transcriptomic reprogramming in monocytes of severe COVID-19 patients reflects alterations in myeloid differentiation and the influence of inflammatory cytokines

Affiliations

Epigenetic and transcriptomic reprogramming in monocytes of severe COVID-19 patients reflects alterations in myeloid differentiation and the influence of inflammatory cytokines

Gerard Godoy-Tena et al. Genome Med. .

Abstract

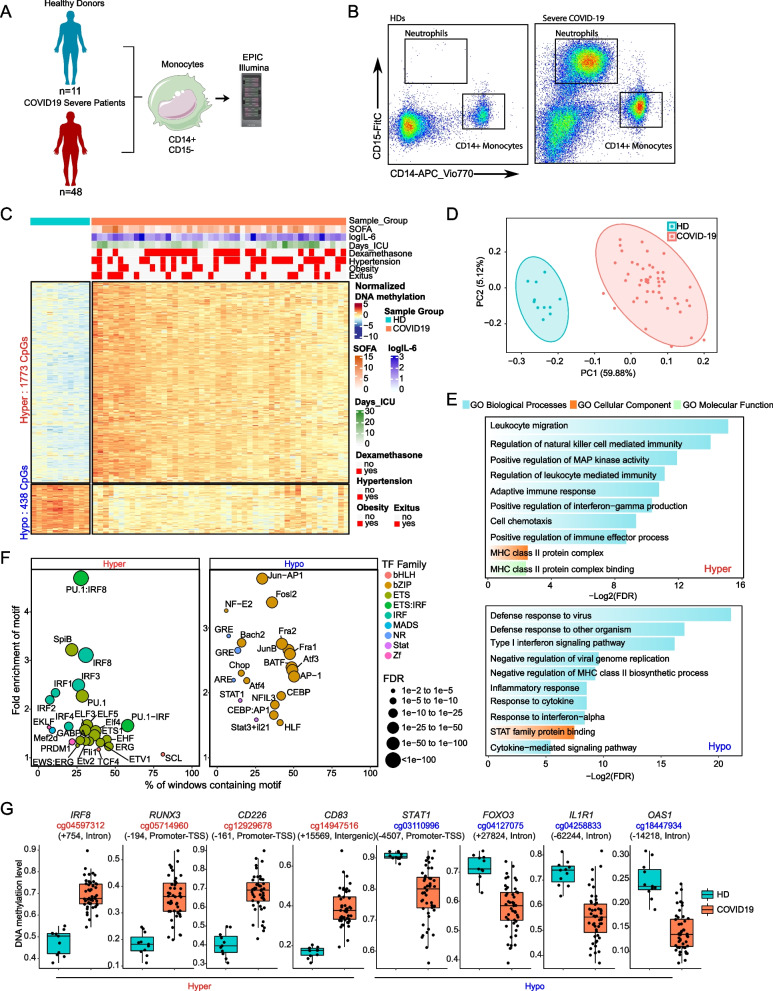
Background: COVID-19 manifests with a wide spectrum of clinical phenotypes, ranging from asymptomatic and mild to severe and critical. Severe and critical COVID-19 patients are characterized by marked changes in the myeloid compartment, especially monocytes. However, little is known about the epigenetic alterations that occur in these cells during hyperinflammatory responses in severe COVID-19 patients.

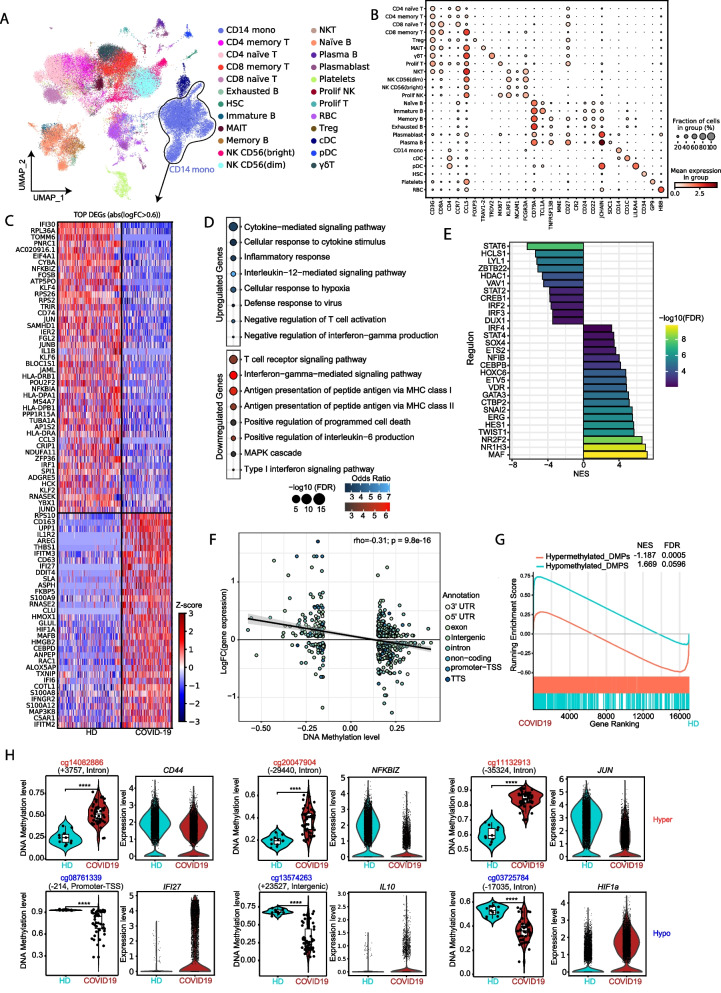
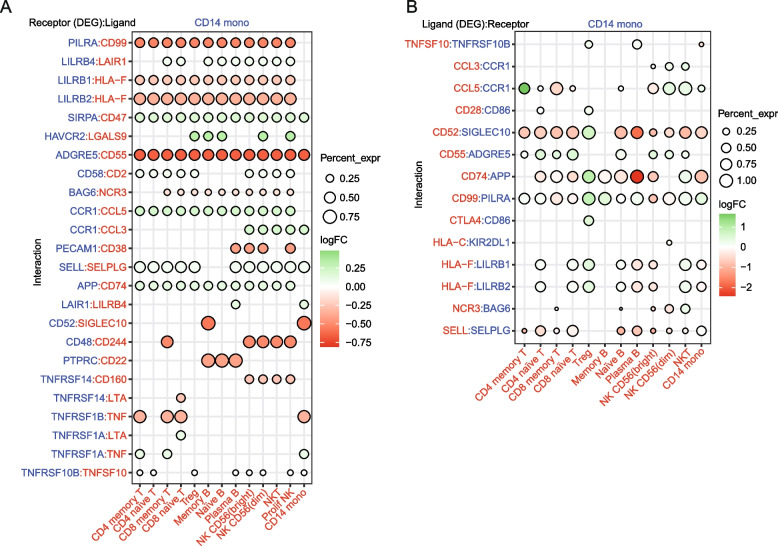
Methods: In this study, we obtained the DNA methylome and transcriptome of peripheral blood monocytes from severe COVID-19 patients. DNA samples extracted from CD14 + CD15- monocytes of 48 severe COVID-19 patients and 11 healthy controls were hybridized on MethylationEPIC BeadChip arrays. In parallel, single-cell transcriptomics of 10 severe COVID-19 patients were generated. CellPhoneDB was used to infer changes in the crosstalk between monocytes and other immune cell types.

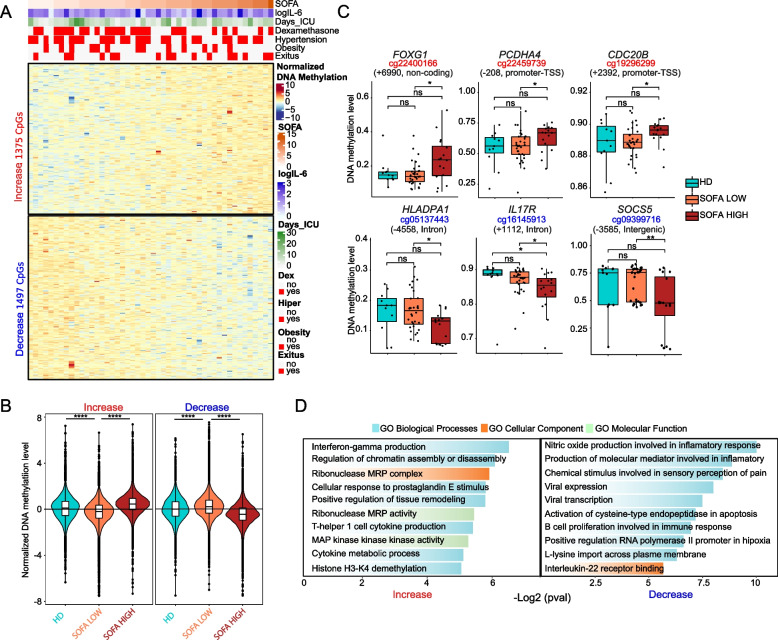
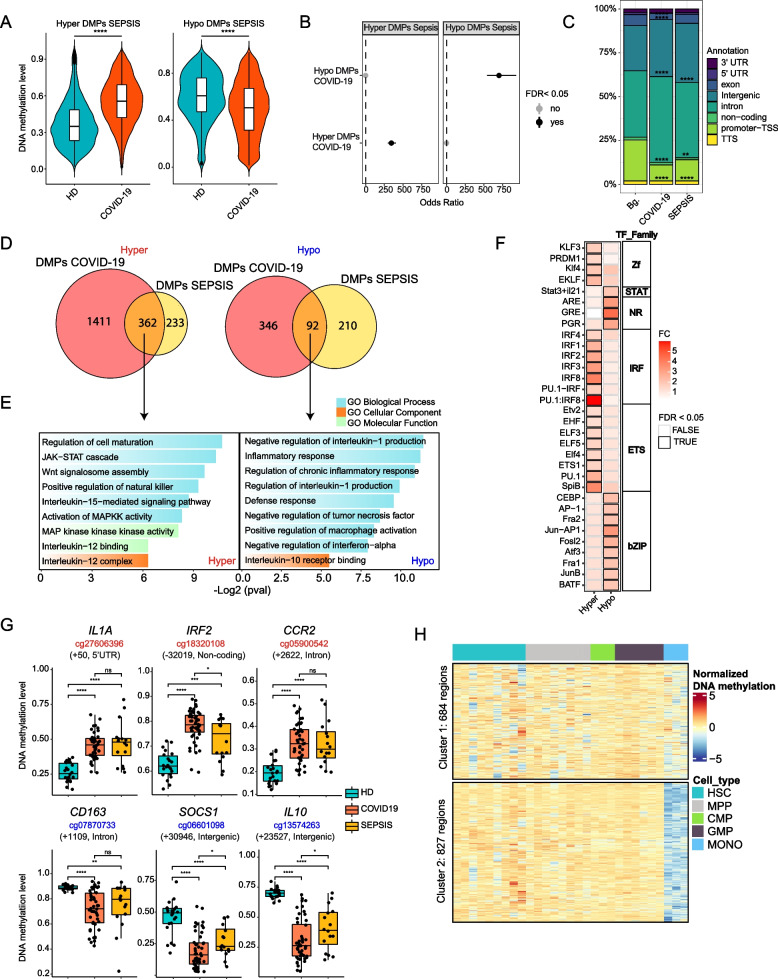
Results: We observed DNA methylation changes in CpG sites associated with interferon-related genes and genes associated with antigen presentation, concordant with gene expression changes. These changes significantly overlapped with those occurring in bacterial sepsis, although specific DNA methylation alterations in genes specific to viral infection were also identified. We also found these alterations to comprise some of the DNA methylation changes occurring during myeloid differentiation and under the influence of inflammatory cytokines. A progression of DNA methylation alterations in relation to the Sequential Organ Failure Assessment (SOFA) score was found to be related to interferon-related genes and T-helper 1 cell cytokine production. CellPhoneDB analysis of the single-cell transcriptomes of other immune cell types suggested the existence of altered crosstalk between monocytes and other cell types like NK cells and regulatory T cells.

Conclusion: Our findings show the occurrence of an epigenetic and transcriptional reprogramming of peripheral blood monocytes, which could be associated with the release of aberrant immature monocytes, increased systemic levels of pro-inflammatory cytokines, and changes in immune cell crosstalk in these patients.

Keywords: COVID-19; DNA methylation; Epigenomics; Immune cell crosstalk; Monocytes; Single-cell transcriptomics.


Conflict of interest statement

The authors declare that they have no competing interests.

Figures

Fig. 1
Fig. 1
Analysis of DNA methylation in blood monocytes of severe COVID-19 patients. A Scheme depicting the cohort and workflow for monocyte purification of severe COVID-19 patients and controls and DNA methylation analysis. B Representative flow cytometry profile, indicating sorting gates used to purify monocytes from HD and COVID-19 patients’ peripheral blood. C Scaled DNA methylation (z-score) heatmap of differentially methylated positions (DMPs) between HDs (blue bar above) and COVID-19 patients (red bar above). Significant DMPs were obtained by applying a filter of FDR > 0.05 and a differential of beta value (Δß) > 0.15. A scale is shown on the right, in which blue and red indicate lower and higher levels of methylation, respectively. Clinical and treatment data of COVID-19 patients are represented above the heatmap. SOFA, IL-6 level, and days in the ICU scales are shown on the right of the panel D Principal component analysis (PCA) of the DMPs. HDs and severe COVID-19 patients are illustrated as blue and red dots, respectively. E Gene ontology of hypermethylated and hypomethylated DMPs. Selected significant functional categories (FDR < 0.05) are shown. F Bubble plot of TF motifs enriched on hypermethylated and hypomethylated DMPs. Bubbles are colored according to their TF family; their size corresponds to the FDR rank. G Box plot of individual DNA methylation values of CpG from hypermethylated and hypomethylated clusters (b-values), with the name of the closest gene and the position relative to the transcription start site
Fig. 2
Fig. 2
DNA methylation changes in COVID-19 monocytes parallel organ damage. A Heatmap of severe COVID-19 patients with DNA methylation ordered by SOFA score, including all CpG-containing probes significantly correlated with the SOFA score (Spearman correlation coefficient rho > 0.4, p < 0.01). Clinical and treatment data of COVID-19 patients are shown above the heatmap. SOFA, IL-6 level, and days in the ICU scales are shown on the right of the panel B. Normalized methylation values from heatmap showing overall group methylation of HD. Patients with SOFA ≤ 6 are indicated as SOFA LOW; those with SOFA > 6 are indicated as SOFA HIGH. C DNA methylation levels (b-values) of selected individual CpGs (and closest genes) in hypermethylated and hypomethylated sets and their position relative to the transcription start site. D Gene ontology (GO) analysis of hypermethylated and hypomethylated DMPs, analyzed with the GREAT online tool, in which CpG annotation in the EPIC array was used as background. Statistical significance: * p < 0.05, ** p < 0.01, *** p < 0.001, **** p < 0.0001
Fig. 3
Fig. 3
Comparative analysis of DNA methylation in blood monocytes of severe COVID-19 and bacterial sepsis patients. A Violin plot representing the mean methylation state of the DMPs found in the comparison between HDs and sepsis patients with b-values obtained from severe COVID-19 patients. B Fisher’s exact test showing the odds ratio ± 95% confidence interval of the overlap between DMPs found in monocytes from bacterial sepsis patients and DMPs in monocytes from COVID-19 patients. C Proportions of the genomic locations (in relation to genes) of DMPs in COVID-19 and sepsis; Bg., background, EPIC probes. D Venn diagram of the overlap of COVID-19 DMPs identified by the comparison of HDs and severe COVID-19 patients with DMPs identified by the comparison between HDs and sepsis patients, separating hypermethylated and hypomethylated DMPs. E Gene ontology analysis of hypermethylated and hypomethylated overlapping DMPs identified in the previous comparison. Selected significant categories (p < 0.05) are shown. F TF binding motif analysis of shared hypermethylated and hypomethylated DMPs comparing HDs and COVID-19 patients, and by HDs and sepsis patients. The panel shows the fold change (FC), TF family. Boxes with black outlines indicate TF binding motifs with FDR < 0.05. G Box-plot showing the DNA methylation values of individual CpGs (together with the name of the closest gene and its position relative to the transcription start site) from the hypermethylated and hypomethylated clusters from both COVID-19 and sepsis. H Scaled DNA methylation heatmap of regions from the whole-genome bisulfite sequencing (WGBS) data of hematopoietic stem cells (HSCs), multipotent progenitors (MPPs), common myeloid progenitors (CMPs), and granulocyte macrophage progenitors (GMPs) that overlap with the genomic location of the 1772 hypermethylated DMPs identified in the COVID-19 vs. HDs comparison. Statistical significance: * p < 0.05, ** p < 0.01, *** p < 0.001, **** p < 0.0001
Fig. 4
Fig. 4
Correlation between DNA methylation and gene expression. A UMAP visualization showing the immune cell populations identified from Louvain clustering and cell-specific marker gene expression. B Dot plot representing the expression of selected marker genes identified in the cell population. The scale represents the mean gene expression level in the cell subset and the circle size represents the percentage of cells in the subset of expressing cells. C Heatmap representing differentially expressed genes (DEGs) with a log2(FC) > 0.6, above, and log2(FC) <  − 0.6, below. Genes overexpressed and downregulated in COVID-19 patients in relation to HDs are depicted in red and blue, respectively. D Gene ontology (GO) overrepresentation of GO Biological Process categories comprising the upregulated and downregulated DEGs. The odds ratios for each group and the − log2(FC) are shown. Selected significant categories (FDR < 0.05) are shown. E Discriminant Regulon Expression Analysis (DoRothEA) of COVID-19 severe patients compared with HDs. Normalized enrichment score (NES) and log2(FC) of transcription factor expression are depicted. F Correlation of average DNA methylation levels of DMPs with average gene expression of DEGs in the HDs vs. COVID-19 severe patients. Log2(FC) of expression is plotted on the y-axis, higher numbers representing a higher level of expression in COVID-19 and lower numbers a higher level of expression in HDs. DNA methylation is depicted on the x-axis as Δβ, lower numbers representing a lower level of methylation in COVID-19 monocytes, and higher numbers a lower level of methylation in HDs. Points are colored according to their genomic context. G Gene set enrichment analysis (GSEA) of HD vs. COVID-19, using hypomethylated-associated genes and hypermethylated-associated genes as genesets. The running enrichment score is represented, and the normalized enrichment score (NES) is shown above (FDR < 0.01). H Representation of individual DNA methylation values of DMPs from the hypermethylated and hypomethylated clusters (beta values), the position in respect to the transcription start site, and the relative expression of the closely related DEGs. Statistical significance: * p < 0.05, ** p < 0.01, *** p < 0.0001, **** p < 0.00001
Fig. 5
Fig. 5
Cell–cell communication analysis. Dot plot of selected receptor/ligand pair (A) and ligand/receptor (B) interactions between CD14 + monocytes and other cell components in the COVID-19 patient group. Gene expression is indicated as log2(FC) for differentially expressed genes (FDR < 0.05), which, in both cases (A and B), are the molecules presented on the left. The percentage expression of the differentially expressed genes in each cell type is indicated by the circle size. Molecules shown in blue are those expressed in CD14 + monocytes. Molecules expressed in the immune cell partner are shown in red

References

    1. Lai C-C, Shih T-P, Ko W-C, Tang H-J, Hsueh P-R. Severe acute respiratory syndrome coronavirus 2 (SARS-CoV-2) and coronavirus disease-2019 (COVID-19): The epidemic and the challenges. Int J Antimicrob Agents. 2020;55:105924. doi: 10.1016/j.ijantimicag.2020.105924. - DOI - PMC - PubMed
    1. Schultze JL, Aschenbrenner AC. COVID-19 and the human innate immune system. Cell. 2021;184:1671–1692. doi: 10.1016/j.cell.2021.02.029. - DOI - PMC - PubMed
    1. Sette A, Crotty S. Adaptive immunity to SARS-CoV-2 and COVID-19. Cell. 2021;184:861–880. doi: 10.1016/j.cell.2021.01.007. - DOI - PMC - PubMed
    1. Huang C, Wang Y, Li X, Ren L, Zhao J, Hu Y, et al. Clinical features of patients infected with 2019 novel coronavirus in Wuhan, China. Lancet. 2020;395:497–506. doi: 10.1016/S0140-6736(20)30183-5. - DOI - PMC - PubMed
    1. Tay MZ, Poh CM, Rénia L, MacAry PA, Ng LFP. The trinity of COVID-19: immunity, inflammation and intervention. Nat Rev Immunol. 2020;20:363–374. doi: 10.1038/s41577-020-0311-8. - DOI - PMC - PubMed

Publication types