. 2022 Nov 28;41(1):331.
doi: 10.1186/s13046-022-02536-6.

Crenigacestat blocking notch pathway reduces liver fibrosis in the surrounding ecosystem of intrahepatic CCA viaTGF-β inhibition

Affiliations

Crenigacestat blocking notch pathway reduces liver fibrosis in the surrounding ecosystem of intrahepatic CCA viaTGF-β inhibition

Serena Mancarella et al. J Exp Clin Cancer Res. .

Abstract

Background: Intrahepatic cholangiocarcinoma (iCCA) is a highly malignant tumor characterized by an intensive desmoplastic reaction due to the exaggerated presence of the extracellular (ECM) matrix components. Liver fibroblasts close to the tumor, activated by transforming growth factor (TGF)-β1 and expressing high levels of α-smooth muscle actin (α-SMA), become cancer-associated fibroblasts (CAFs). CAFs are deputed to produce and secrete ECM components and crosstalk with cancer cells favoring tumor progression and resistance to therapy. Overexpression of Notch signaling is implicated in CCA development and growth. The study aimed to determine the effectiveness of the Notch inhibitor, Crenigacestat, on the surrounding microenvironment of iCCA.

Methods: We investigated Crenigacestat's effectiveness in a PDX model of iCCA and human primary culture of CAFs isolated from patients with iCCA.

Results: In silico analysis of transcriptomic profiling from PDX iCCA tissues treated with Crenigacestat highlighted "liver fibrosis" as one of the most modulated pathways. In the iCCA PDX model, Crenigacestat treatment significantly (p < 0.001) reduced peritumoral liver fibrosis. Similar results were obtained in a hydrodynamic model of iCCA. Bioinformatic prediction of the upstream regulators related to liver fibrosis in the iCCA PDX treated with Crenigacestat revealed the involvement of the TGF-β1 pathway as a master regulator gene showing a robust connection between TGF-β1 and Notch pathways. Consistently, drug treatment significantly (p < 0.05) reduced TGF-β1 mRNA and protein levels in tumoral tissue. In PDX tissues, Crenigacestat remarkably inhibited TGF-β signaling and extracellular matrix protein gene expression and reduced α-SMA expression. Furthermore, Crenigacestat synergistically increased Gemcitabine effectiveness in the iCCA PDX model. In 31 iCCA patients, TGF-β1 and α-SMA were upregulated in the tumoral compared with peritumoral tissues. In freshly isolated CAFs from patients with iCCA, Crenigacestat significantly (p < 0.001) inhibited Notch signaling, TGF-β1 secretion, and Smad-2 activation. Consequently, Crenigacestat also inactivated CAFs reducing (p < 0.001) α-SMA expression. Finally, CAFs treated with Crenigacestat produced less (p < 005) ECM components such as fibronectin, collagen 1A1, and collagen 1A2.

Conclusions: Notch signaling inhibition reduces the peritumoral desmoplastic reaction in iCCA, blocking the TGF-β1 canonical pathway.

Keywords: Crenigacestat; Liver fibrosis; Smad2; Tissue microenvironment; Tumor stroma crosstalk.


Conflict of interest statement

The authors declare that they have no conflict of interest.

Figures
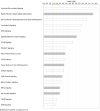
Fig. 1
Fig. 1
Canonical pathways analysis of the differentially expressed genes filtered based on their expression in liver and cancer. The most significantly enriched canonical pathways based on -log p values are displayed
Fig. 2
Fig. 2
Crenigacestat reduced peritumoral fibrosis in two iCCA models. Panel A. PDX iCCA model and Panel B. Hydrodynamic injection iCCA model. Tissue sections were stained using the Azan Mallory’s trichrome staining. Representative images were acquired at 20X magnification. Scale bar represents 50 μm. An adapted METAVIR scoring system was used to quantify the fibrosis in treated and untreated mice, as reported in the graphs
Fig. 3
Fig. 3
“Hepatic Fibrosis/Hepatic Stellate Cell Activation” was the most significant canonical pathways modulated by Crenigacestat in iCCA PDX mouse models
Fig. 4
Fig. 4
Crenigacestat inhibits the TGF-β pathway in iCCA PDX models. Panel A. Real-time PCR for TGFB1 on PDX mice reveals a reduction of TGF-β gene expression in PDX mice treated with Crenigacestat. Panel B and C. Crenigacestat reduces the TGF-β/Smad pathway in PDX-treated mice, as detected by Western blot analysis and immunofluorescence staining. The scale bar represents 50 μm. ***p < 0.0001. Magnification 20X
Fig. 5
Fig. 5
Crenigacestat reduces iCCA hCAFs activation in PDX tissues. Panel A. TGFB1 as predicted upstream regulator and its target molecules by Ingenuity Pathway Analysis (IPA) in treated vs. untreated PDX tissues. Genes in red denote upregulation and downregulation in response to the treatment in green. Lines in orange denote predicted activation; lines in blue predict inhibition. Panel B. Crenigacestat downregulates α-SMA expression in PDX-treated mice, as detected by immunofluorescence staining. Vimentin (green) and α-SMA (red) in overlapping stains (yellow) co-immunolocalize in PDX tissues. The scale bar represents 50 μm. Panel C. The staining quantification was calculated as the mean intensity fluorescence of three images/tissue from PDX mice treated with Crenigacestat compared to the vehicle. ***p < 0.0001. Magnifications: 40X
Fig. 6
Fig. 6
Crenigacestat enhances the chemosensitivity of iCCA to Gemcitabine in the PDX model. At the end of treatment, the tumor volume of the masses was significantly reduced in all treated-mice compared to the vehicle. The combination of Crenigacestat with Gemcitabine improves the efficacy of treatment in iCCA. **p < 0.001, ***p < 0.0001 calculated with Student’s t-test
Fig. 7
Fig. 7
Analysis of TGFB1 and ACTA2 mRNA expression in tumoral and matching peritumoral tissues of 31 iCCA patients from the GEO database (GSE107943). Mean expression data in RPKM (Reads Per Kilobase Million). ***p < 0.0001 calculated with Student’s t-test
Fig. 8
Fig. 8
Crenigacestat inhibits the NOTCH1 pathway in iCCA hCAFs. Panel A. Crenigacestat inhibits the intracellular domain of Notch1 (NICD1) in a dose-dependent manner. Panel B and C. HES1, at both mRNA and protein expression, is downregulated in iCCA hCAFs at all the concentrations used of Crenigacestat. *p < 0.05, **p < 0.01, ***p < 0.001 calculated with Student’s t-test
Fig. 9
Fig. 9
Notch inhibitors downregulate TGFβ pathway in iCCA hCAFs. Panel A and C. Crenigacestat and FLI-06 downregulate TGFβ secretion in iCCA hCAFs conditioned media. Panel B and D. pSmad2 was significantly inhibited by both Notch inhibitors; in particular, Crenigacestat induces a dose-dependent inhibition. *p < 0.05, **p < 0.01, ***p < 0.001 calculated with Student’s t-test
Fig. 10
Fig. 10
Crenigacestat inactivates iCCA hCAFs. Crenigacestat downregulates α-SMA (green signal, Panel A) and Vimentin (green signal, Panel B) expression in treated iCCA hCAFs, as detected by immunofluorescence staining. For both protein markers, staining quantification was calculated on nuclei number as the mean of five images per cell slide treated with increasing Crenigacestat concentrations compared to untreated. The scale bar represents 10 μm, magnification 20x. Panel C. Vimentin (green) and α-SMA (red) in overlapping stains (yellow) were co-immunolocalized in the same primary cell cultures. The scale bar represents 50 μm, magnification 20x.*p < 0.05, **p < 0.001, ***p < 0.0001 calculated with Student’s t-test
Fig. 11
Fig. 11
Crenigacestat reduces ECM component in iCCA hCAFs. Panel A. Real-time PCR for FN1, COL1A1, and COL1A2 on PDX mice reveals a reduction of ECM genes in PDX treated mice. Panel B. Crenigacestat inhibits the ECM protein deposition in iCCA hCAFs, in particular, Crenigacestat effect is more evident on Fibronectin at the lowest dose and COL1A1 at all concentrations. *p < 0.05, **p < 0.01, ***p < 0.001 calculated with Student’s t-test

References

    1. Khan SA, Tavolari S, Brandi G. Cholangiocarcinoma: epidemiology and risk factors. Liver Int. 2019;39 Suppl 1:19–31. - PubMed
    1. Clements O, Eliahoo J, Kim JU, Taylor-Robinson SD, Khan SA. Risk factors for intrahepatic and extrahepatic cholangiocarcinoma: a systematic review and meta-analysis. J Hepatol. 2020;72:95–103. doi: 10.1016/j.jhep.2019.09.007. - DOI - PubMed
    1. Banales JM, Marin JJG, Lamarca A, Rodrigues PM, Khan SA, Roberts LR, et al. Cholangiocarcinoma 2020: the next horizon in mechanisms and management. Nat Rev Gastroenterol Hepatol. 2020;17:557–588. doi: 10.1038/s41575-020-0310-z. - DOI - PMC - PubMed
    1. Matsumoto K, Onoyama T, Kawata S, Takeda Y, Harada K, Ikebuchi Y, et al. Hepatitis B and C virus infection is a risk factor for the development of cholangiocarcinoma. Intern Med. 2014;53:651–654. doi: 10.2169/internalmedicine.53.1410. - DOI - PubMed
    1. Alvaro D, Crocetti E, Ferretti S, Bragazzi MC, Capocaccia R. AISF cholangiocarcinoma committee. Descriptive epidemiology of cholangiocarcinoma in Italy. Dig Liver Dis. 2010;42:490–495. doi: 10.1016/j.dld.2009.10.009. - DOI - PubMed

Substances