

Reversible adhesion by type IV pili leads to formation of permanent localized clusters
- PMID: 36444306
- PMCID: PMC9700013
- DOI: 10.1016/j.isci.2022.105532
Reversible adhesion by type IV pili leads to formation of permanent localized clusters
Abstract
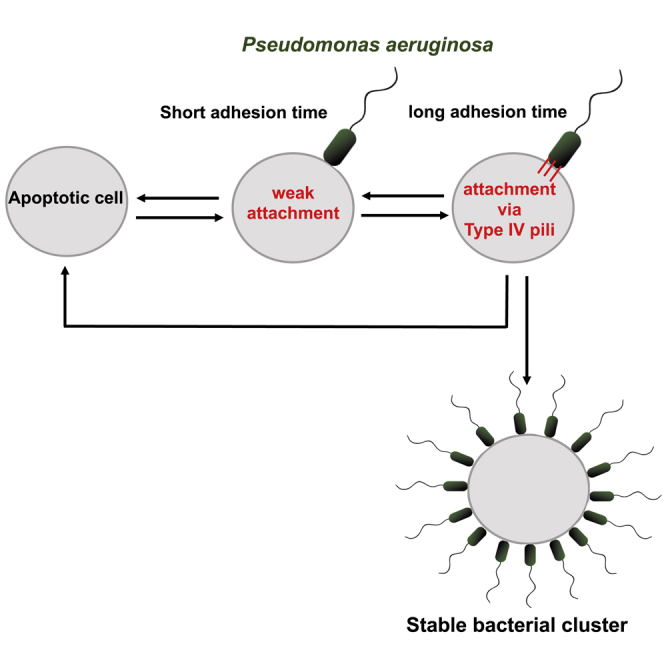
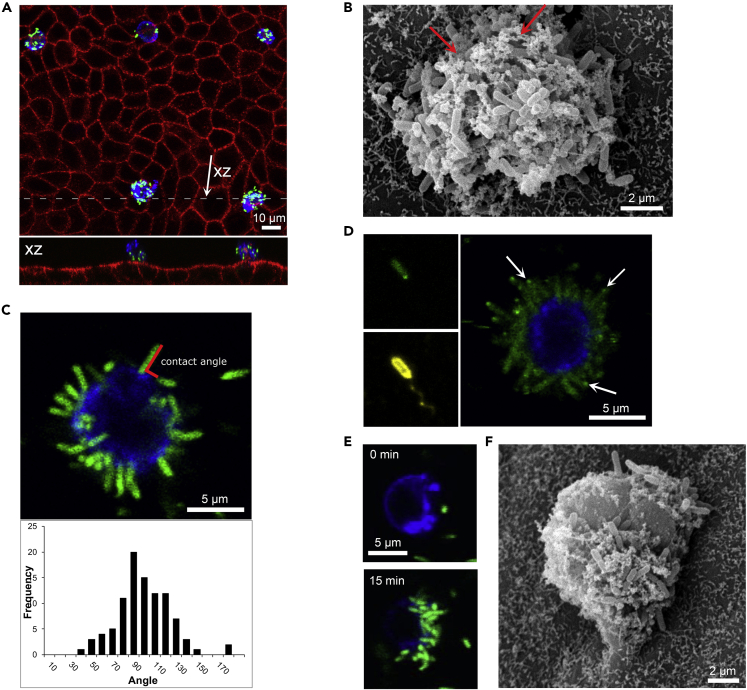
The formation of long-lived, multicellular clusters is a fundamental step in the physiopathology of many disease-causing bacteria. Experiments on abiotic surfaces suggest that bacterial colonization, including initial cluster formation, requires (1) irreversible adhesion, (2) cell proliferation, and (3) a phenotypic transition. However, here we show that on infection of a polarized MDCK epithelium, Pseudomonas aeruginosa (PA) forms long-lived - i.e., permanent - bacterial clusters without requiring irreversible adhesion, cell proliferation, or a phenotypic transition. By combining experiments and a mathematical model, we reveal that the cluster formation process is mediated by type IV pili (T4P). Furthermore, we unveil how T4P quantitatively operate during adhesion, finding that it is a stochastic process that involves an activation time, requires the retraction of pili, and results in reversible attachment. We explain how such reversible attachment process leads to the formation of permanent bacterial clusters and quantify the cluster growth dynamics.
Keywords: Cell biology; Mathematical biosciences; Microbiology.
© 2022 The Authors.
Conflict of interest statement
The authors declare no competing interests.
Figures


Similar articles
-
Type-IV pili tune an adhesion-migration trade-off during surface colonization of Pseudomonas aeruginosa.bioRxiv [Preprint]. 2023 May 9:2023.05.09.538458. doi: 10.1101/2023.05.09.538458. bioRxiv. 2023. PMID: 37215001 Free PMC article. Preprint.
-
Role of Cyclic Di-GMP and Exopolysaccharide in Type IV Pilus Dynamics.J Bacteriol. 2017 Mar 28;199(8):e00859-16. doi: 10.1128/JB.00859-16. Print 2017 Apr 15. J Bacteriol. 2017. PMID: 28167523 Free PMC article.
-
Nanoscale adhesion forces of Pseudomonas aeruginosa type IV Pili.ACS Nano. 2014 Oct 28;8(10):10723-33. doi: 10.1021/nn5044383. Epub 2014 Oct 6. ACS Nano. 2014. PMID: 25286300 Free PMC article.
-
Biogenesis of Pseudomonas aeruginosa type IV pili and regulation of their function.Environ Microbiol. 2015 Nov;17(11):4148-63. doi: 10.1111/1462-2920.12849. Epub 2015 Jun 25. Environ Microbiol. 2015. PMID: 25808785 Review.
-
Type IV pili: dynamics, biophysics and functional consequences.Nat Rev Microbiol. 2019 Jul;17(7):429-440. doi: 10.1038/s41579-019-0195-4. Nat Rev Microbiol. 2019. PMID: 30988511 Review.
References
-
- Bjarnsholt T., Jensen P.Ø., Fiandaca M.J., Pedersen J., Hansen C.R., Andersen C.B., Pressler T., Givskov M., Høiby N. Pseudomonas aeruginosa biofilms in the respiratory tract of cystic fibrosis patients. Pediatr.Pulmonol. 2009;44:547–558. - PubMed
-
- Burmølle M., Thomsen T.R., Fazli M., Dige I., Christensen L., Homøe P., Tvede M., Nyvad B., Tolker-Nielsen T., Givskov M., et al. Biofilms in chronic infections–a matter of opportunity–monospecies biofilms in multispecies infections. FEMS Immunol. Med. Microbiol. 2010;59:324–336. - PubMed
-
- Bjarnsholt T., Alhede M., Alhede M., Eickhardt-Sørensen S.R., Moser C., Kühl M., Jensen P.Ø., Høiby N. The in vivo biofilm. Trends Microbiol. 2013;21:466–474. - PubMed
LinkOut - more resources
Full Text Sources
