

Targeting fibroblast growth factor receptors causes severe craniofacial malformations in zebrafish larvae
- PMID: 36444384
- PMCID: PMC9700454
- DOI: 10.7717/peerj.14338
Targeting fibroblast growth factor receptors causes severe craniofacial malformations in zebrafish larvae
Abstract
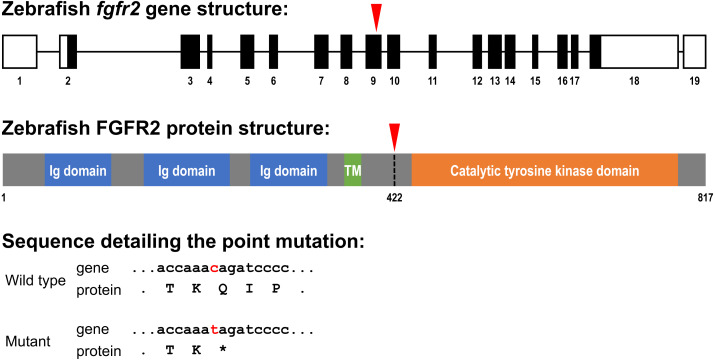
Background and objective: A key pathway controlling skeletal development is fibroblast growth factor (FGF) and FGF receptor (FGFR) signaling. Major regulatory functions of FGF signaling are chondrogenesis, endochondral and intramembranous bone development. In this study we focus on fgfr2, as mutations in this gene are found in patients with craniofacial malformations. The high degree of conservation between FGF signaling of human and zebrafish (Danio rerio) tempted us to investigate effects of the mutated fgfr2 sa10729 allele in zebrafish on cartilage and bone formation.
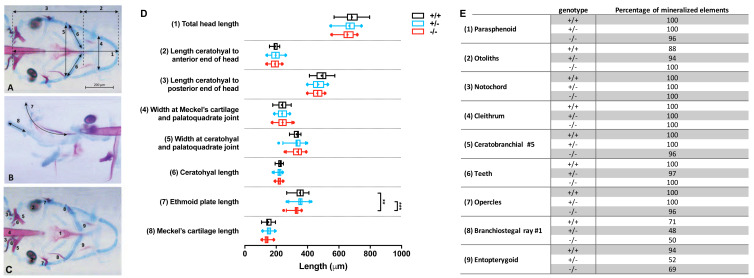
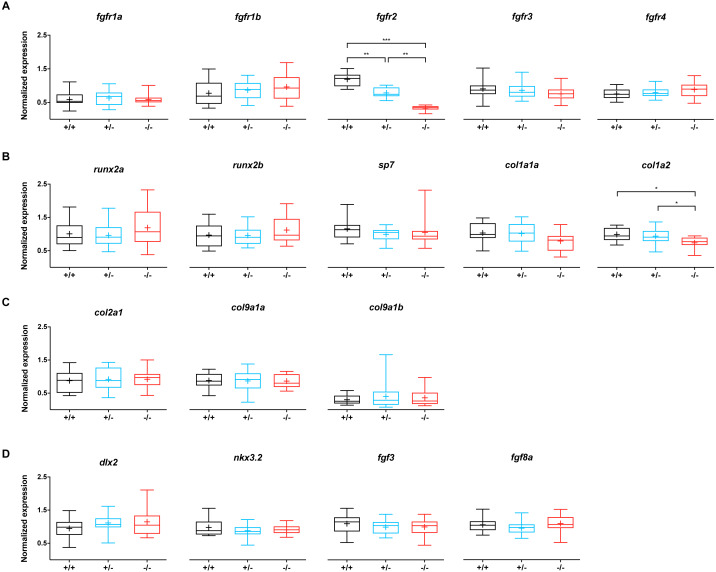
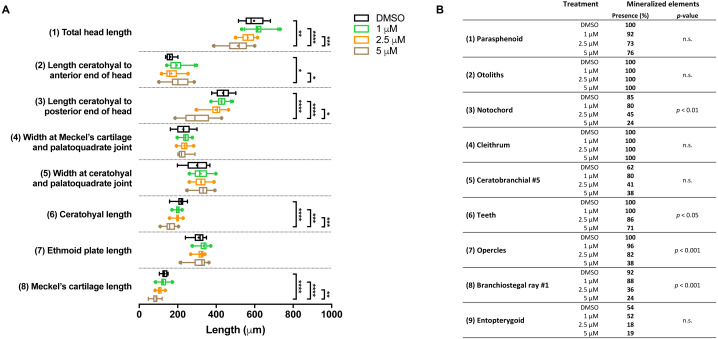
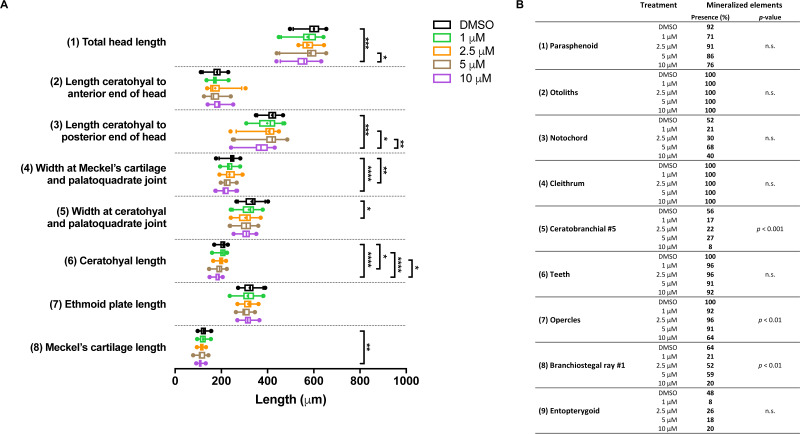
Methods: We stained cartilage and bone in 5 days post fertilization (dpf) zebrafish larvae and compared mutants with wildtypes. We also determined the expression of genes related to these processes. We further investigated whether pharmacological blocking of all FGFRs with the inhibitor BGJ398, during 0-12 and 24-36 h post fertilization (hpf), affected craniofacial structure development at 5 dpf.
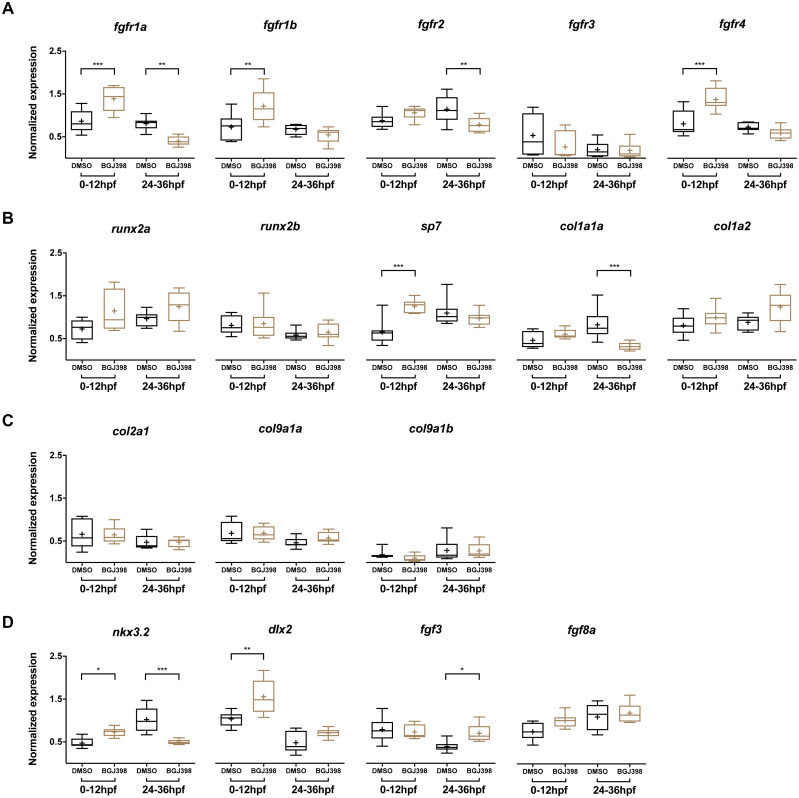
Results: We found only subtle differences in craniofacial morphology between wildtypes and mutants, likely because of receptor redundancy. After exposure to BGJ398, we found dose-dependent cartilage and bone malformations, with more severe defects in fish exposed during 0-12 hpf. These results suggest impairment of cranial neural crest cell survival and/or differentiation by FGFR inhibition. Compensatory reactions by upregulation of fgfr1a, fgfr1b, fgfr4, sp7 and dlx2a were found in the 0-12 hpf group, while in the 24-36 hpf group only upregulation of fgf3 was found together with downregulation of fgfr1a and fgfr2.
Conclusions: Pharmacological targeting of FGFR1-4 kinase signaling causes severe craniofacial malformations, whereas abrogation of FGFR2 kinase signaling alone does not induce craniofacial skeletal abnormalities. These findings enhance our understanding of the role of FGFRs in the etiology of craniofacial malformations.
Keywords: Cranial neural crest cells; Craniofacial malformations; Development; FGF signaling; FGFR mutation; Inhibitors; Zebrafish.
©2022 Gebuijs et al.
Conflict of interest statement
The authors declare there are no competing interests.
Figures
Similar articles
-
The anti-epileptic drug valproic acid causes malformations in the developing craniofacial skeleton of zebrafish larvae.Mech Dev. 2020 Sep;163:103632. doi: 10.1016/j.mod.2020.103632. Epub 2020 Jul 12. Mech Dev. 2020. PMID: 32668265
-
Fgf receptors Fgfr1a and Fgfr2 control the function of pharyngeal endoderm in late cranial cartilage development.Differentiation. 2013 Nov-Dec;86(4-5):192-206. doi: 10.1016/j.diff.2013.07.006. Epub 2013 Oct 29. Differentiation. 2013. PMID: 24176552
-
Fibroblast Growth Factor Receptors Function Redundantly During Zebrafish Embryonic Development.Genetics. 2019 Aug;212(4):1301-1319. doi: 10.1534/genetics.119.302345. Epub 2019 Jun 7. Genetics. 2019. PMID: 31175226 Free PMC article.
-
Altered FGF signalling in congenital craniofacial and skeletal disorders.Semin Cell Dev Biol. 2016 May;53:115-25. doi: 10.1016/j.semcdb.2015.12.005. Epub 2015 Dec 11. Semin Cell Dev Biol. 2016. PMID: 26686047 Review.
-
FGF signaling in craniofacial biological control and pathological craniofacial development.Crit Rev Eukaryot Gene Expr. 2010;20(4):295-311. doi: 10.1615/critreveukargeneexpr.v20.i4.20. Crit Rev Eukaryot Gene Expr. 2010. PMID: 21395503 Review.
Cited by
-
[Role of Fibroblast Growth Factor 7 in Craniomaxillofacial Development].Sichuan Da Xue Xue Bao Yi Xue Ban. 2024 Mar 20;55(2):469-474. doi: 10.12182/20240360505. Sichuan Da Xue Xue Bao Yi Xue Ban. 2024. PMID: 38645865 Free PMC article. Review. Chinese.
-
Transcriptomic landscape of Atlantic salmon (Salmo salar L.) skin.G3 (Bethesda). 2023 Nov 1;13(11):jkad215. doi: 10.1093/g3journal/jkad215. G3 (Bethesda). 2023. PMID: 37724757 Free PMC article.
-
Clinical report and genetic analysis of a Chinese neonate with craniofacial microsomia caused by a splicing variant of the splicing factor 3b subunit 2 gene.Mol Genet Genomic Med. 2023 Dec;11(12):e2268. doi: 10.1002/mgg3.2268. Epub 2023 Aug 9. Mol Genet Genomic Med. 2023. PMID: 37555391 Free PMC article.
References
-
- Arman E, Haffner-Krausz R, Chen Y, Heath JK, Lonai P. Targeted disruption of fibroblast growth factor (FGF) receptor 2 suggests a role for FGF signaling in pregastrulation mammalian development. Proceedings of the National Academy of Sciences of the United States of America. 1998;95:5082–5087. doi: 10.1073/pnas.95.9.5082. - DOI - PMC - PubMed
-
- Borday-Birraux V, Van der Heyden C, Debiais-Thibaud M, Verreijdt L, Stock DW, Huysseune A, Sire JY. Expression of Dlx genes during the development of the zebrafish pharyngeal dentition: evolutionary implications. Evolution & Development. 2006;8:130–141. doi: 10.1111/j.1525-142X.2006.00084.x. - DOI - PubMed
Publication types
MeSH terms
Substances
LinkOut - more resources
Full Text Sources
Medical
Molecular Biology Databases
Miscellaneous
