

Multi-instrument assessment of fine and ultrafine titanium dioxide aerosols
- PMID: 36444639
- PMCID: PMC10663951
- DOI: 10.1080/15287394.2022.2150730
Multi-instrument assessment of fine and ultrafine titanium dioxide aerosols
Abstract
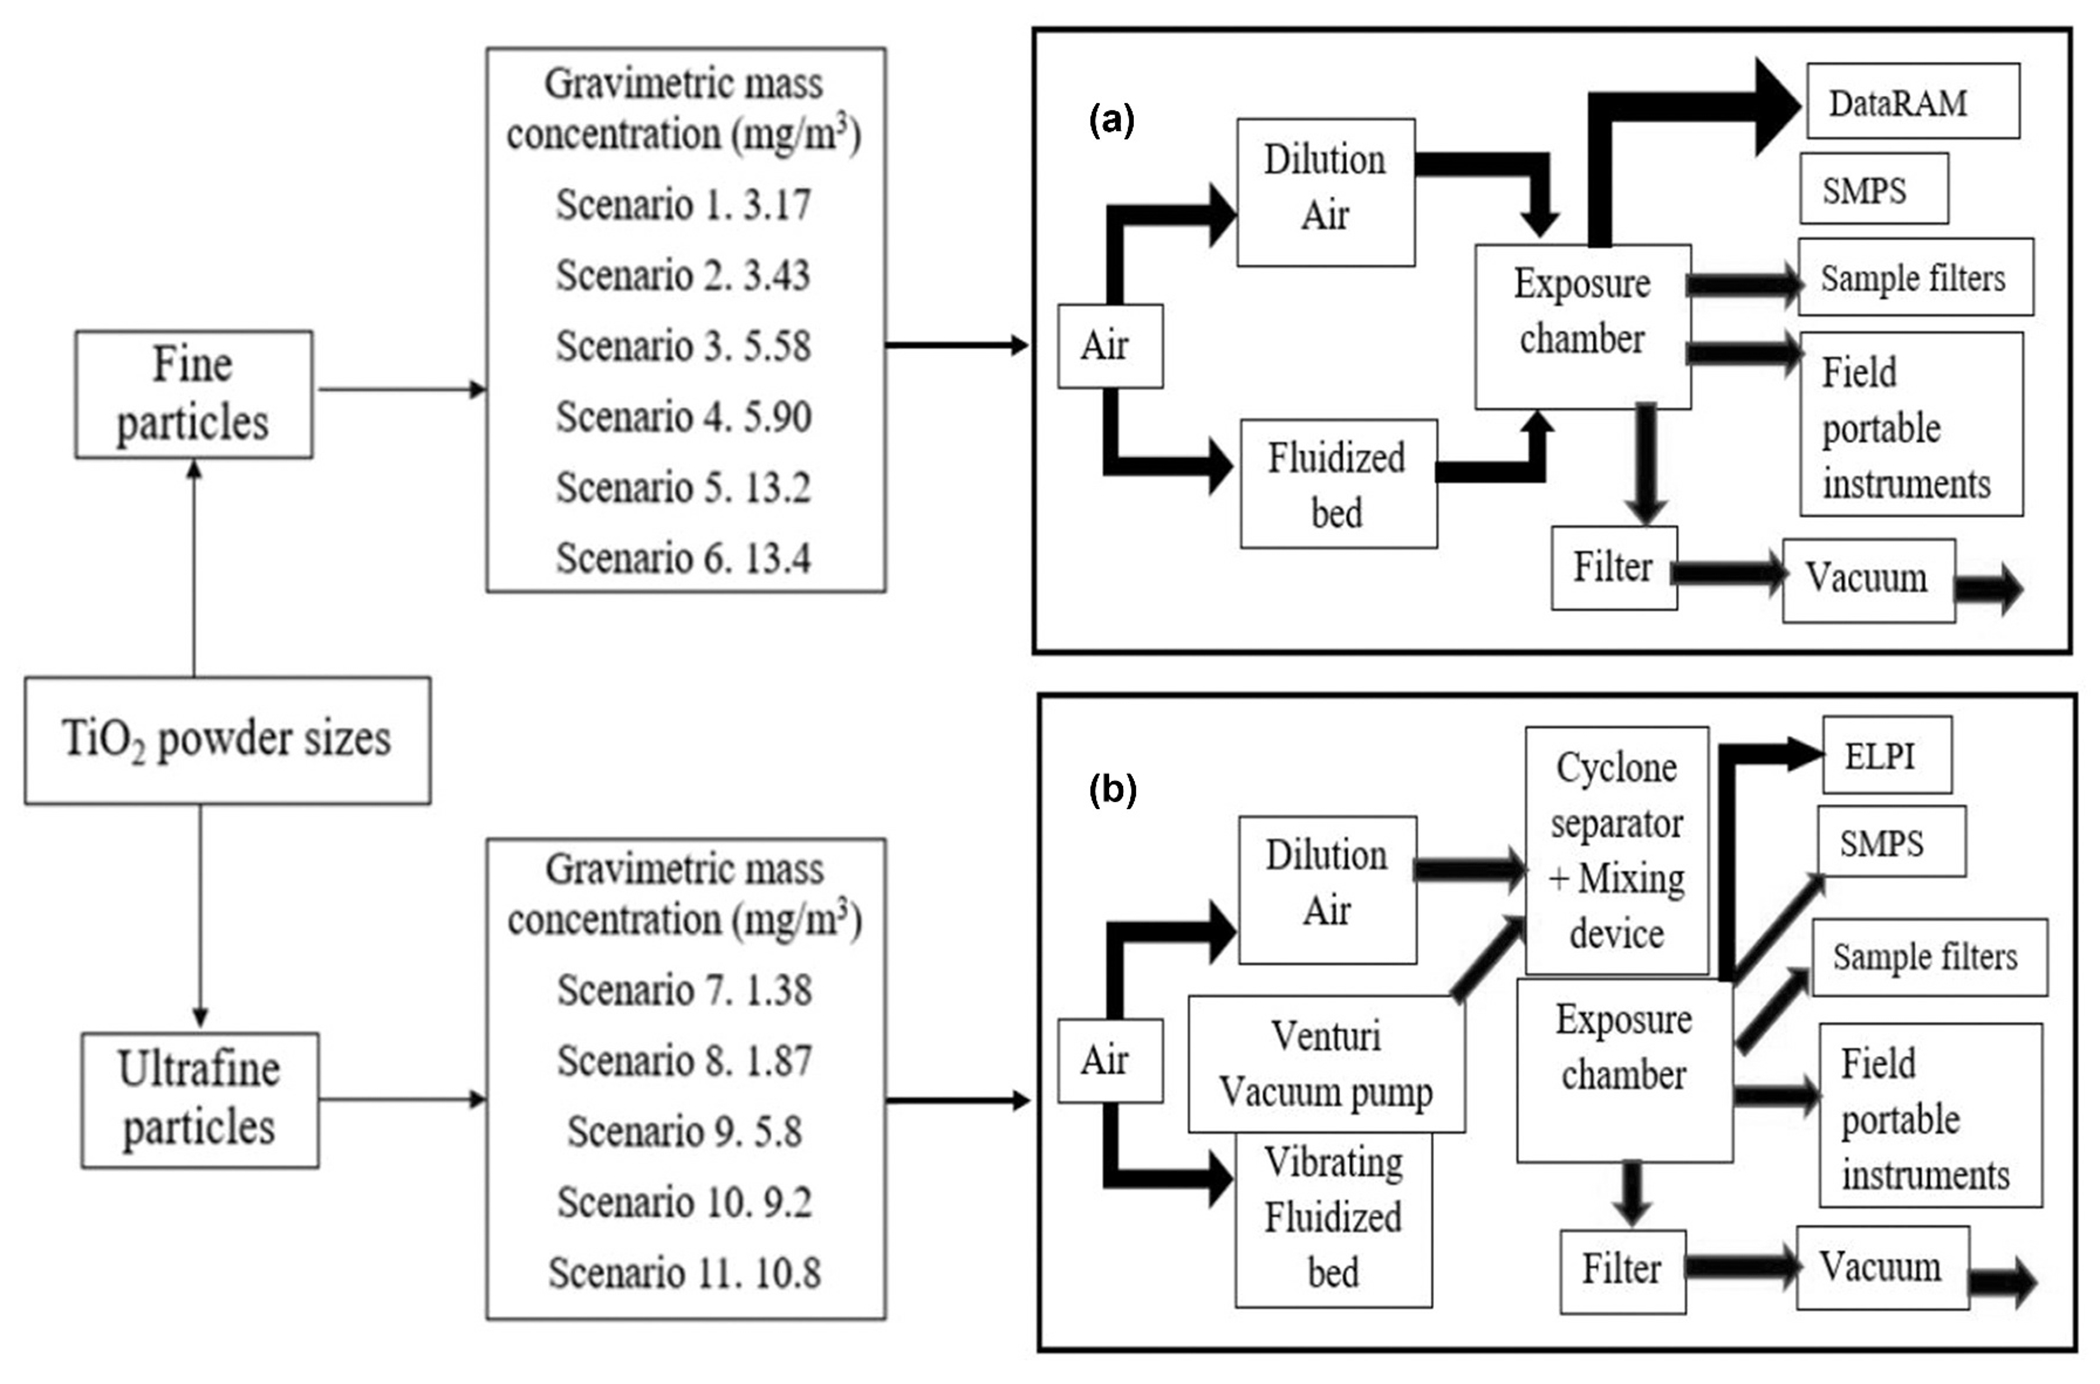
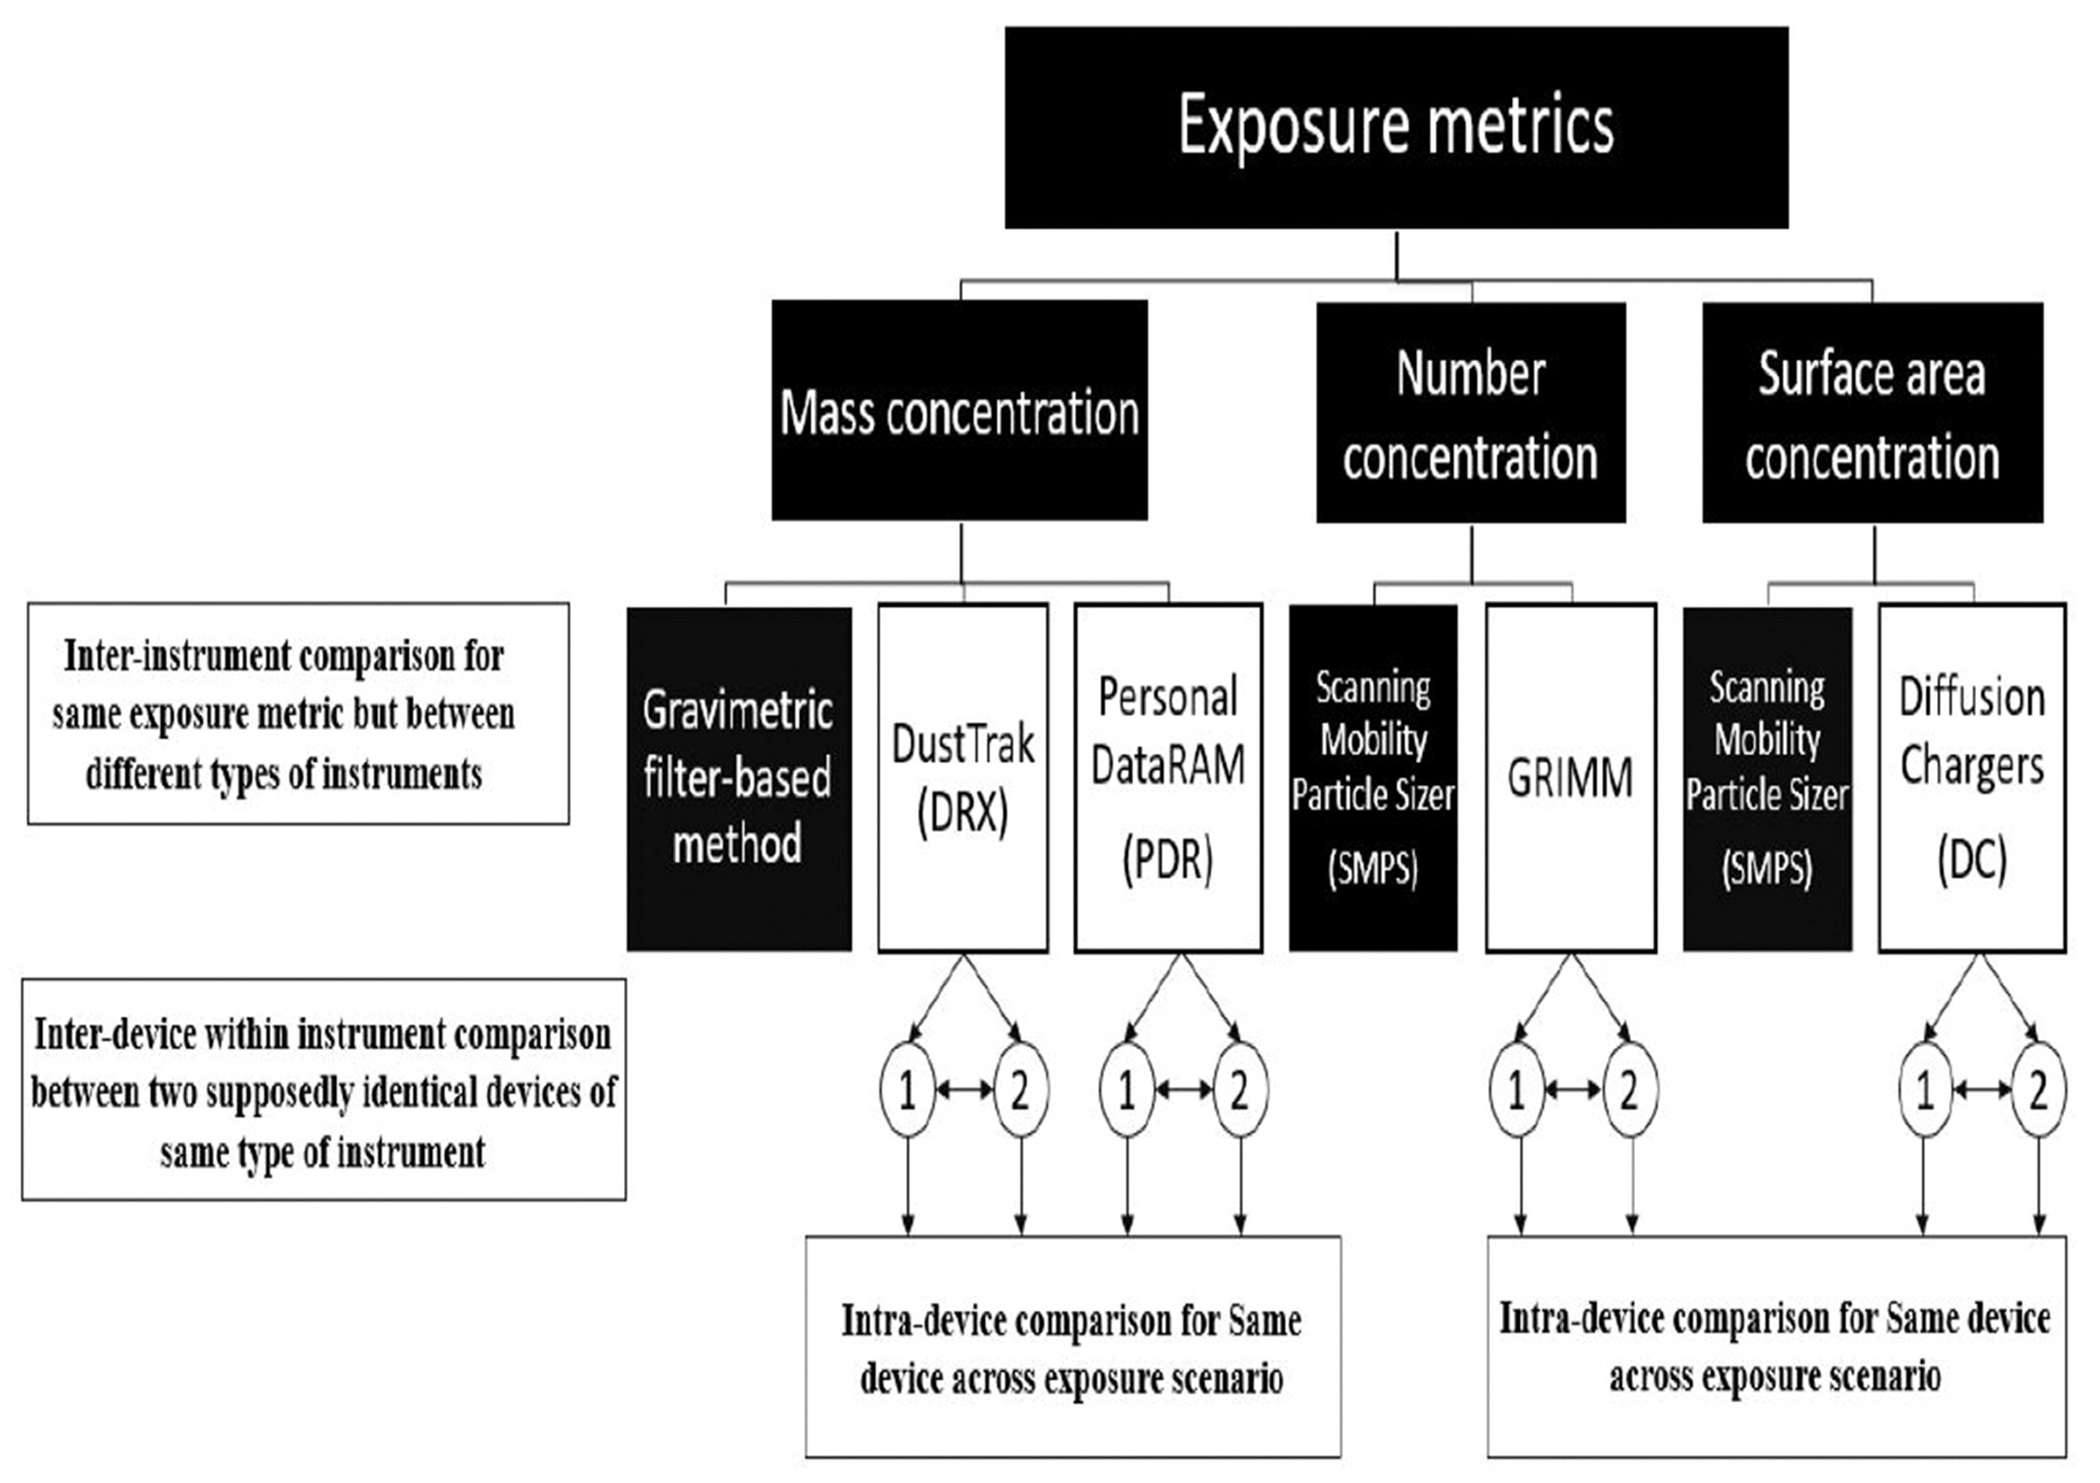
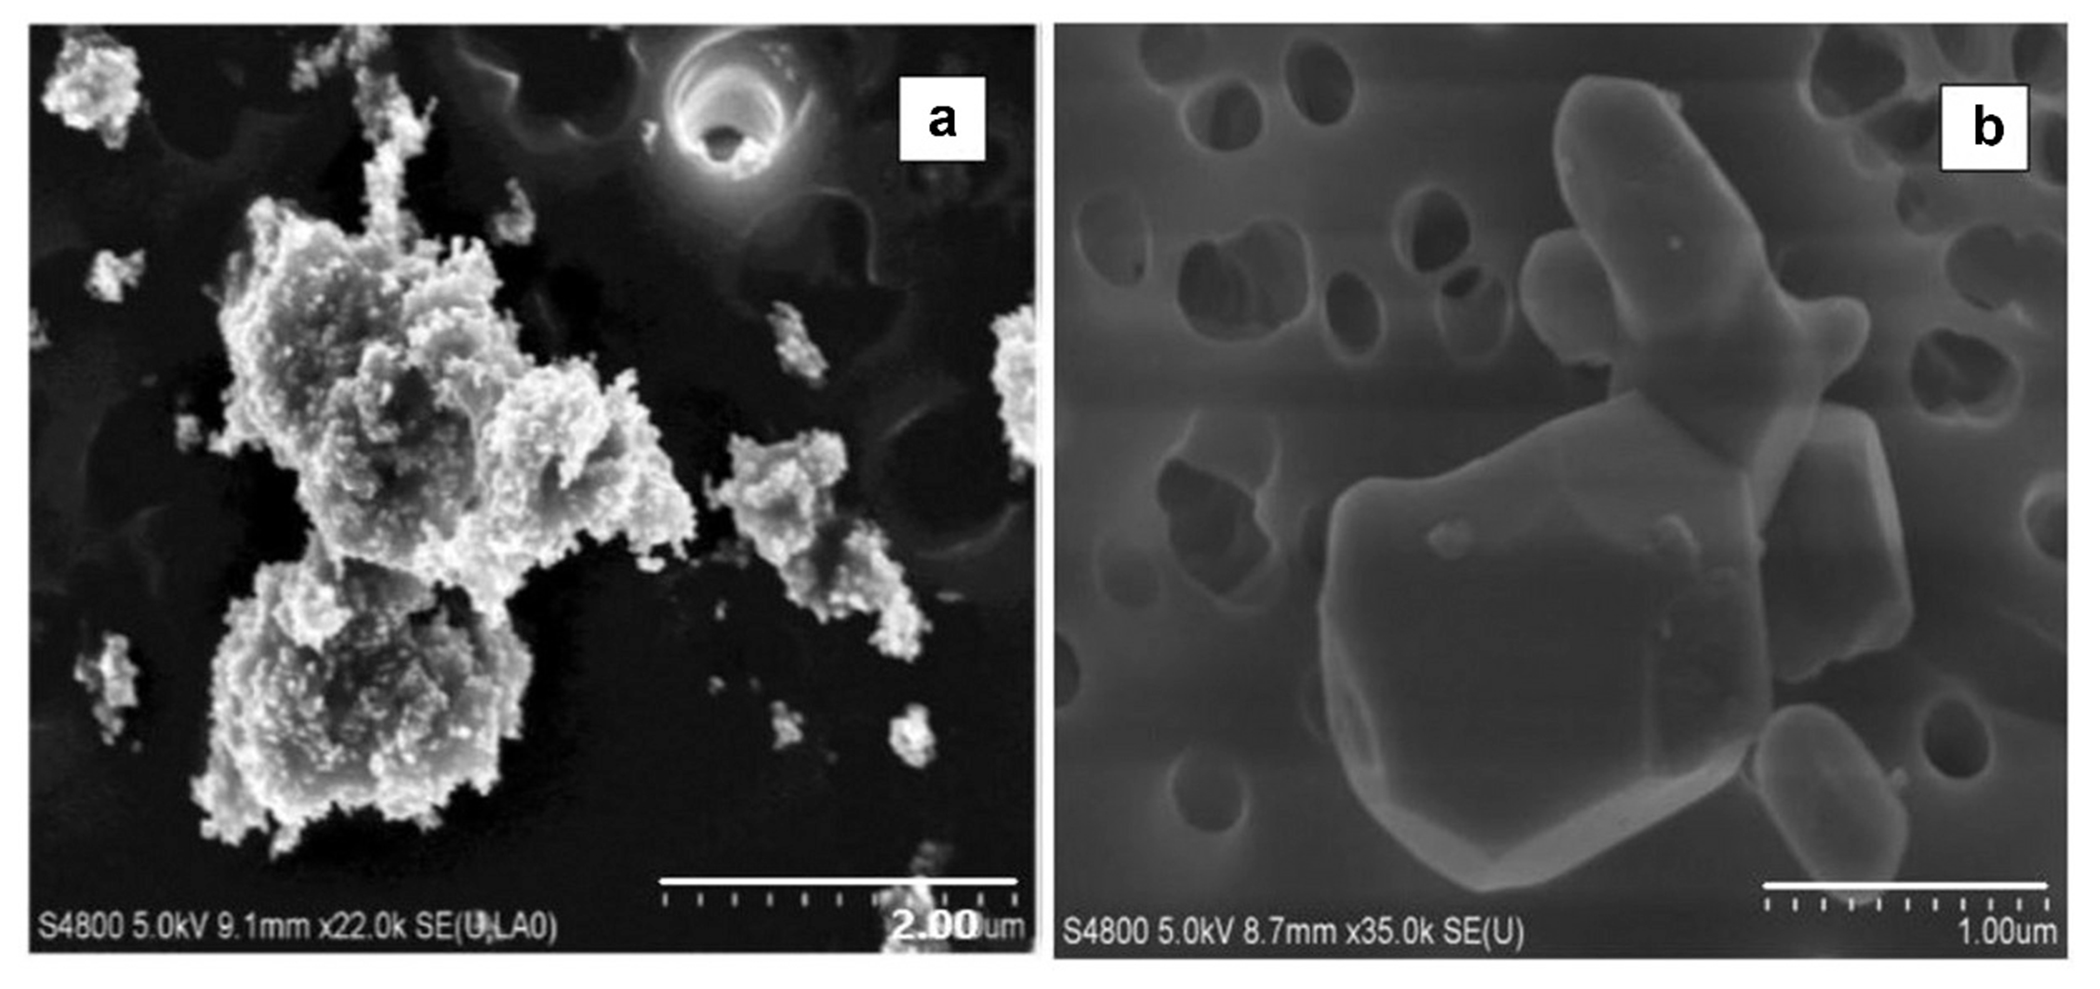
The measurement of fine (diameter: 100 nanometers-2.5 micrometers) and ultrafine (UF: < 100 nanometers) titanium dioxide (TiO2) particles is instrument dependent. Differences in measurements exist between toxicological and field investigations for the same exposure metric such as mass, number, or surface area because of variations in instruments used, operating parameters, or particle-size measurement ranges. Without appropriate comparison, instrument measurements create a disconnect between toxicological and field investigations for a given exposure metric. Our objective was to compare a variety of instruments including multiple metrics including mass, number, and surface area (SA) concentrations for assessing different concentrations of separately aerosolized fine and UF TiO2 particles. The instruments studied were (1) DustTrak™ DRX, (2) personal DataRAMs™ (PDR), (3) GRIMMTM, and (4) diffusion charger (DC). Two devices of each field-study instrument (DRX, PDR, GRIMM, and DC) were used to measure various metrics while adjusting for gravimetric mass concentrations of fine and UF TiO2 particles in controlled chamber tests. An analysis of variance (ANOVA) was used to apportion the variance to inter-instrument (between different instrument-types), inter-device (within instrument), and intra-device components. Performance of each instrument-device was calculated using root mean squared error compared to reference methods: close-faced cassette and gravimetric analysis for mass and scanning mobility particle sizer (SMPS) real-time monitoring for number and SA concentrations. Generally, inter-instrument variability accounted for the greatest (62.6% or more) source of variance for mass, and SA-based concentrations of fine and UF TiO2 particles. However, higher intra-device variability (53.7%) was observed for number concentrations measurements with fine particles compared to inter-instrument variability (40.8%). Inter-device variance range(0.5-5.5%) was similar for all exposure metrics. DRX performed better in measuring mass closer to gravimetric than PDRs for fine and UF TiO2. Number concentrations measured by GRIMMs and SA measurements by DCs were considerably (40.8-86.9%) different from the reference (SMPS) method for comparable size ranges of fine and UF TiO2. This information may serve to aid in interpreting assessments in risk models, epidemiologic studies, and development of occupational exposure limits, relating to health effect endpoints identified in toxicological studies considering similar instruments evaluated in this study.
Keywords: Real-time instruments; aerosol mass concentration; aerosol number concentration; aerosol surface area concentration; particle morphology.
Figures
References
-
- Asbach C, Kaminski H, Fissan H, Monz C, Dahmann D, Mühlhopt S, Paur H, Kiesling H, Herrmann F, Voetz M, et al. 2009. Comparison of four mobility particle sizers with different time resolution for stationary exposure measurements. J Nanopart Res 11:1593–609. doi:10.1007/s11051-009-9679-x. - DOI
Publication types
MeSH terms
Substances
Grants and funding
LinkOut - more resources
Full Text Sources
Medical