

Procedural Outcomes After Percutaneous Coronary Interventions in Focal and Diffuse Coronary Artery Disease
- PMID: 36444858
- PMCID: PMC9851458
- DOI: 10.1161/JAHA.122.026960
Procedural Outcomes After Percutaneous Coronary Interventions in Focal and Diffuse Coronary Artery Disease
Abstract
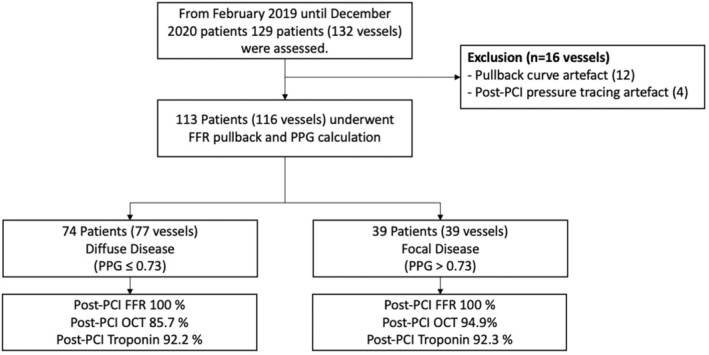
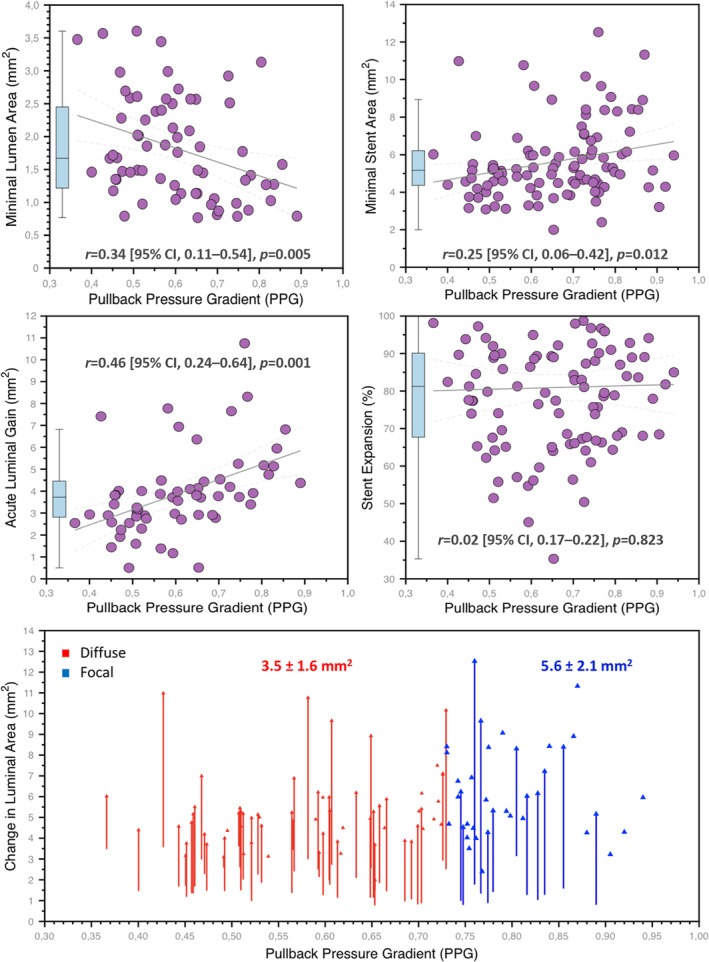
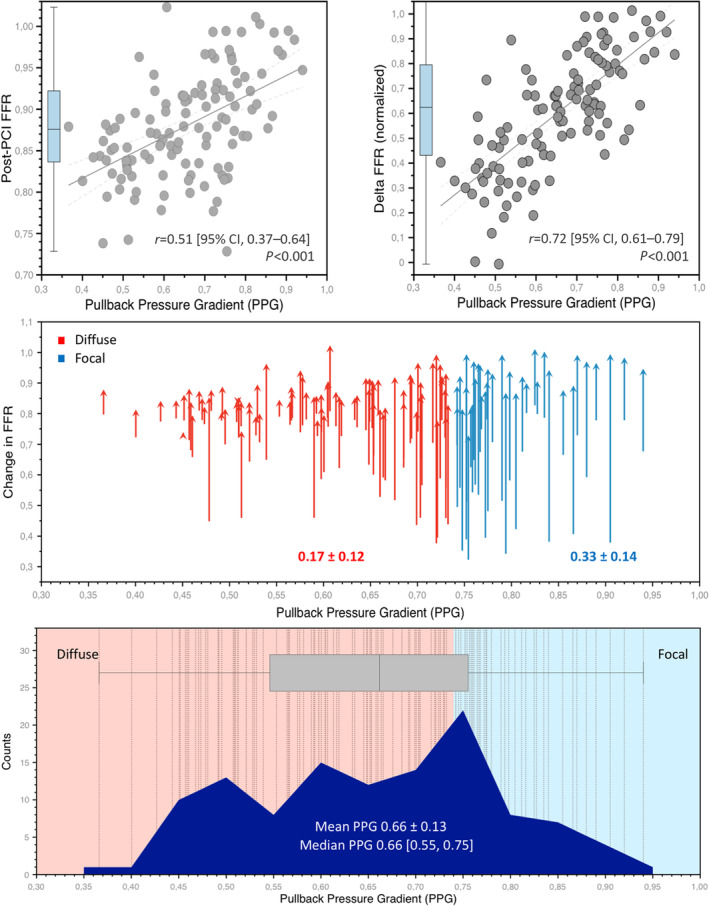
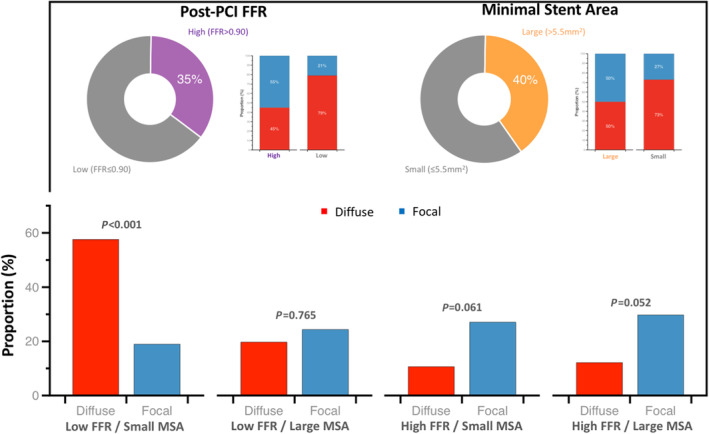
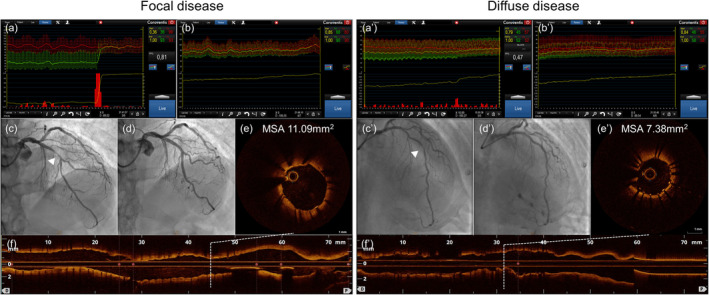
Background Coronary artery disease (CAD) patterns play an essential role in the decision-making process about revascularization. The pullback pressure gradient (PPG) quantifies CAD patterns as either focal or diffuse based on fractional flow reserve (FFR) pullbacks. The objective of this study was to evaluate the impact of CAD patterns on acute percutaneous coronary intervention (PCI) results considered surrogates of clinical outcomes. Methods and Results This was a prospective, multicenter study of patients with hemodynamically significant CAD undergoing PCI. Motorized FFR pullbacks and optical coherence tomography (OCT) were performed before and after PCI. Post-PCI FFR >0.90 was considered an optimal result. Focal disease was defined as PPG >0.73 (highest PPG tertile). Overall, 113 patients (116 vessels) were included. Patients with focal disease were younger than those with diffuse CAD (61.4±9.9 versus 65.1±8.7 years, P=0.042). PCI in vessels with high PPG (focal CAD) resulted in higher post-PCI FFR (0.91±0.07 in the focal group versus 0.86±0.05 in the diffuse group, P<0.001) and larger minimal stent area (6.3±2.3 mm2 in focal versus 5.3±1.8 mm2 in diffuse CAD, P=0.015) compared withvessels with low PPG (diffuse CAD). The PPG was associated with the change in FFR after PCI (R2=0.51, P<0.001). The PPG significantly improved the capacity to predict optimal PCI results compared with an angiographic assessment of CAD patterns (area under the curvePPG 0.81 [95% CI, 0.73-0.88] versus area under the curveangio 0.51 [95% CI, 0.42-0.60]; P<0.001). Conclusions PCI in vessels with focal disease defined by the PPG resulted in greater improvement in epicardial conductance and larger minimal stent area compared with diffuse disease. PPG, but not angiographically defined CAD patterns, distinguished patients attaining superior procedural outcomes. Registration URL: https://clinicaltrials.gov/ct2/show/NCT03782688.
Keywords: CAD patterns; diffuse disease; percutaneous coronary interventions; pullback pressure gradient.
Figures
References
-
- Kang SJ, Ahn JM, Song H, Kim WJ, Lee JY, Park DW, Yun SC, Lee SW, Kim YH, Lee CW, et al. Comprehensive intravascular ultrasound assessment of stent area and its impact on restenosis and adverse cardiac events in 403 patients with unprotected left main disease. Circ Cardiovasc Interv. 2011;4:562–569. doi: 10.1161/circinterventions.111.964643 - DOI - PubMed
-
- Song HG, Kang SJ, Ahn JM, Kim WJ, Lee JY, Park DW, Lee SW, Kim YH, Lee CW, Park SW, et al. Intravascular ultrasound assessment of optimal stent area to prevent in‐stent restenosis after zotarolimus‐, everolimus‐, and sirolimus‐eluting stent implantation. Catheter Cardiovasc Interv. 2014;83:873–878. doi: 10.1002/ccd.24560 - DOI - PubMed
-
- Fournier S, Ciccarelli G, Toth GG, Milkas A, Xaplanteris P, Tonino PAL, Fearon WF, Pijls NHJ, Barbato E, De Bruyne B. Association of improvement in fractional flow reserve with outcomes, including symptomatic relief, after percutaneous coronary intervention. JAMA Cardiol. 2019;4:370–374. doi: 10.1001/jamacardio.2019.0175 - DOI - PMC - PubMed
-
- Collison D, Didagelos M, Aetesam‐Ur‐Rahman M, Copt S, McDade R, McCartney P, Ford TJ, McClure J, Lindsay M, Shaukat A, et al. Post‐stenting fractional flow reserve vs coronary angiography for optimisation of percutaneous coronary intervention: TARGET‐FFR trial. Eur Heart J. 2021;42:4656–4668. doi: 10.1093/eurheartj/ehab449 - DOI - PMC - PubMed
-
- Piroth Z, Toth GG, Tonino PAL, Barbato E, Aghlmandi S, Curzen N, Rioufol G, Pijls NHJ, Fearon WF, Jüni P, et al. Prognostic value of fractional flow reserve measured immediately after drug‐eluting stent implantation. Circ Cardiovasc Interv. 2017;10:10. doi: 10.1161/circinterventions.116.005233 - DOI - PubMed
Publication types
MeSH terms
Associated data
LinkOut - more resources
Full Text Sources
Medical
Miscellaneous
