. 2023 Mar 6;32(6):1048-1060.
doi: 10.1093/hmg/ddac290.

Whole-exome sequencing study identifies four novel gene loci associated with diabetic kidney disease

Affiliations

Whole-exome sequencing study identifies four novel gene loci associated with diabetic kidney disease

Yang Pan et al. Hum Mol Genet. .

Abstract

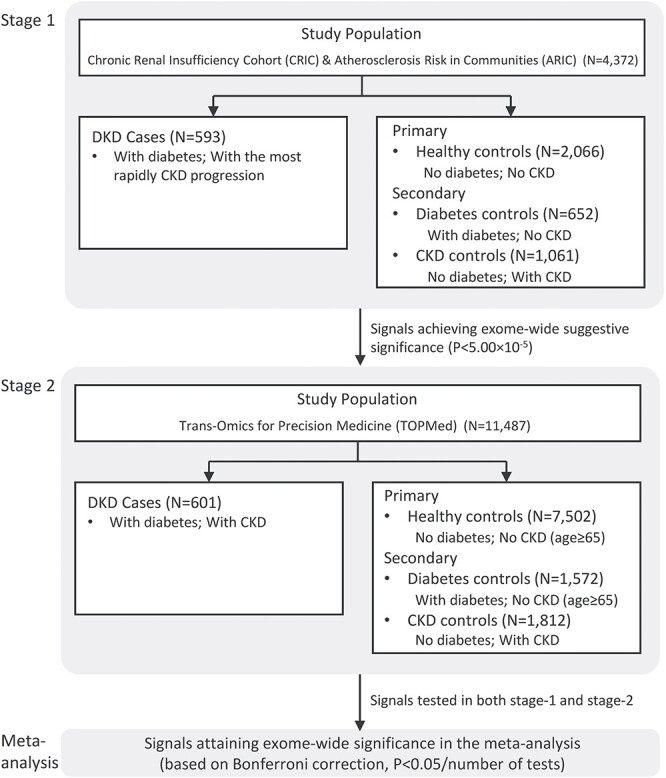
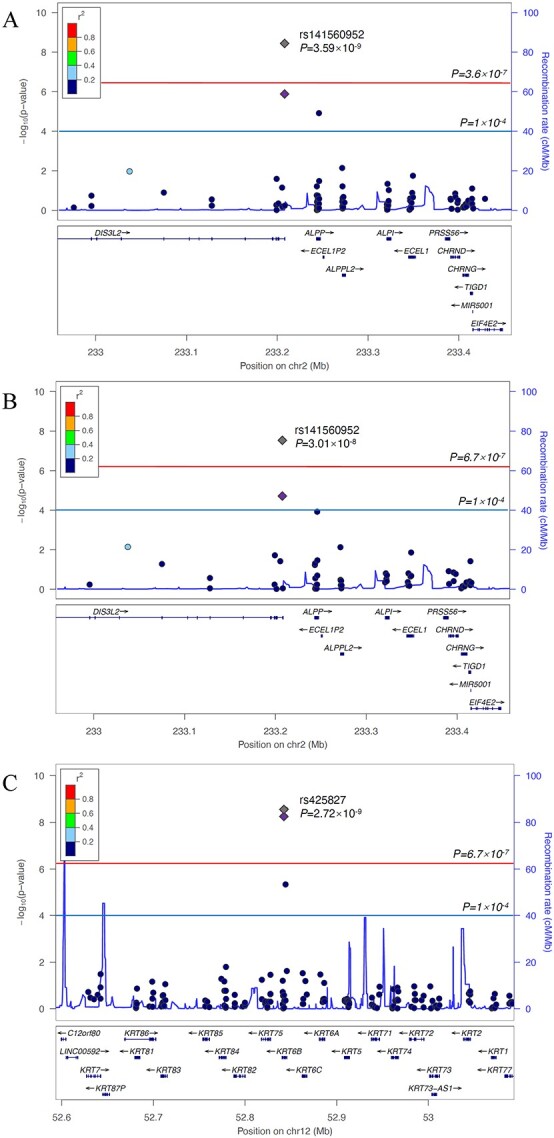
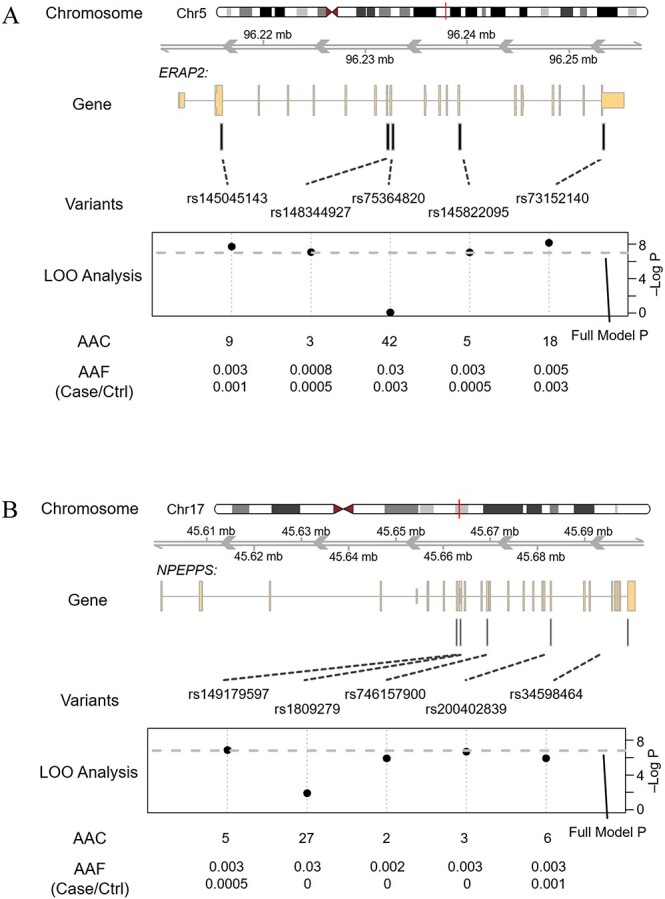
Diabetic kidney disease (DKD) is recognized as an important public health challenge. However, its genomic mechanisms are poorly understood. To identify rare variants for DKD, we conducted a whole-exome sequencing (WES) study leveraging large cohorts well-phenotyped for chronic kidney disease and diabetes. Our two-stage WES study included 4372 European and African ancestry participants from the Chronic Renal Insufficiency Cohort and Atherosclerosis Risk in Communities studies (stage 1) and 11 487 multi-ancestry Trans-Omics for Precision Medicine participants (stage 2). Generalized linear mixed models, which accounted for genetic relatedness and adjusted for age, sex and ancestry, were used to test associations between single variants and DKD. Gene-based aggregate rare variant analyses were conducted using an optimized sequence kernel association test implemented within our mixed model framework. We identified four novel exome-wide significant DKD-related loci through initiating diabetes. In single-variant analyses, participants carrying a rare, in-frame insertion in the DIS3L2 gene (rs141560952) exhibited a 193-fold increased odds [95% confidence interval (CI): 33.6, 1105] of DKD compared with noncarriers (P = 3.59 × 10⁻⁹). Likewise, each copy of a low-frequency KRT6B splice-site variant (rs425827) conferred a 5.31-fold higher odds (95% CI: 3.06, 9.21) of DKD (P = 2.72 × 10⁻⁹). Aggregate gene-based analyses further identified ERAP2 (P = 4.03 × 10⁻⁸) and NPEPPS (P = 1.51 × 10⁻⁷), which are both expressed in the kidney and implicated in renin-angiotensin-aldosterone system modulated immune response. In the largest WES study of DKD, we identified novel rare variant loci attaining exome-wide significance. These findings provide new insights into the molecular mechanisms underlying DKD.


Figures

Figure 1
Figure 1
Study design. In this two-stage whole-exome sequencing study of DKD, an extreme case–control study design was adopted by leveraging 4372 participants of the Chronic Renal Insufficiency Cohort (CRIC) and Atherosclerosis Risk in Communities (ARIC) studies in the stage-1 analysis. Participants with DKD from the CRIC study were compared with one primary and two secondary control groups without DKD from the ARIC study. Suggestive signals identified in the stage-1 WES study were confirmed among 11 487 Trans-Omics for Precision Medicine (TOPMed) participants with existing WGS data (stage-2). Signals achieving an exome-wide significance based on Bonferroni correction in the meta-analysis were reported.
Figure 2
Figure 2
Circos plots display stage-1 signals from analyses comparing DKD cases with healthy controls (inner orange ring), diabetes controls (middle blue ring) and kidney disease controls (outer yellow ring) for the (A) multi-ancestry participants, (B) European ancestry participants and (C) African ancestry participants. Inside each ring are peaks of representing the –log P-value of the smallest P-value within a 500 kb-region on genome. The vertical axis of each ring shows –log P-value (ranging from 0 to 15), with suggestive multi-ancestry signals (P < 1.00 × 10−6) indicated by green coloring and suggestive ancestry-specific signals indicated by red coloring. Suggestive gene loci are annotated on the outside of the circos plots, with loci shared by two and all three case–control comparisons colored in light green and dark green, respectively. Loci identified by comparing DKD cases with healthy, diabetes and kidney disease controls are indicated in orange, blue and yellow, respectively.
Figure 3
Figure 3
Regional association plots displaying significant signals at (A) DIS3L2 in multi-ancestry analyses comparing DKD cases with healthy controls, (B) DIS3L2 in European ancestry analyses comparing DKD cases with healthy controls and (C) KRT6B in European ancestry analyses comparing DKD cases with healthy controls.
Figure 4
Figure 4
Gene structure plot illustrating the LOO analysis of aggregate signals at gene (A) ERAP2 and (B) NPEPPS.

References

    1. De Boer, I.H., Rue, T.C., Hall, Y.N., Heagerty, P.J., Weiss, N.S. and Himmelfarb, J. (2011) Temporal trends in the prevalence of diabetic kidney disease in the United States. JAMA, 305, 2532–2539. - PMC - PubMed
    1. Thomas, M.C., Brownlee, M., Susztak, K., Sharma, K., Jandeleit-Dahm, K.A.M., Zoungas, S., Rossing, P., Groop, P.H. and Cooper, M.E. (2015) Diabetic kidney disease. Nat. Rev. Dis. Primers., 1, 1–20. - PMC - PubMed
    1. Zelnick, L.R., Weiss, N.S., Kestenbaum, B.R., Robinson-Cohen, C., Heagerty, P.J., Tuttle, K., Hall, Y.N., Hirsch, I.B. and De Boer, I.H. (2017) Diabetes and CKD in the United States population, 2009–2014. Clin. J. Am. Soc. Nephrol., 12, 1984–1990. - PMC - PubMed
    1. Afkarian, M., Sachs, M.C., Kestenbaum, B., Hirsch, I.B., Tuttle, K.R., Himmelfarb, J. and Boer, I.H.D. (2013) Kidney disease and increased mortality risk in type 2 diabetes. J. Am. Soc. Nephrol., 24, 302–308. - PMC - PubMed
    1. Tuttle, K.R., Bakris, G.L., Bilous, R.W., Chiang, J.L., De Boer, I.H., Goldstein-Fuchs, J., Hirsch, I.B., Kalantar-Zadeh, K., Narva, A.S., Navaneethan, S.D. et al. (2014) Diabetic kidney disease: a report from an ADA Consensus Conference. Am. J. Kidney Dis., 64, 510–533. - PubMed

Publication types